Earnings Call Presentation - FY 2021 - IuteCredit Europe

Page created by Dustin Pope
 
CONTINUE READING
Earnings Call Presentation - FY 2021 - IuteCredit Europe
Earnings Call Presentation
          FY 2021
Earnings Call Presentation - FY 2021 - IuteCredit Europe
Disclaimer
The information contained in this presentation has been prepared by Aalto Capital AG, a registered corporate finance boutique located in Munich, Germany, based among others on materials provided to
us by IuteCredit.

The information in this presentation has not been independently verified and is subject to updating, completion, revision and further amendment. The presentation does not purport to contain all
information that a prospective lender may require. While the information contained herein has been prepared in good faith, neither the Borrower nor its shareholders, directors, officers, agents, employees,
or advisors, give, has given or has authority to give, any representations or warranties (expressed or implied) as to, or in relation to, the accuracy, reliability or completeness of the information in this
presentation or any revision thereof, or of any other written or oral information made or to be made available to any interested party or its advisors (all such information being referred to as information) and
liability therefore is expressly disclaimed save by each person in respect of their own fraud. Accordingly, the Borrower and its shareholders, directors, officers, agents, employees or advisors do not take any
responsibility for, and will not accept any liability whether direct or indirect, expressed or implied, contractual, statutory or otherwise, in respect of the accuracy or completeness of the information or for any
of the opinions contained herein or for any errors, omissions or misstatements or for any loss, how so ever arising from the use of this presentation.

Information contained in this presentation is confidential information and the property of the Borrower. It is made available strictly for the purposes referred to above. The presentation and any further
confidential information made available to any recipient must be held in complete confidence and documents containing such information may not be reproduced, used or disclosed without the prior
written consent of the Borrower. This presentation shall not be copied, published, reproduced or distributed in whole or in part at any time without the prior written consent of the Borrower. By accepting
delivery of this presentation, the recipient agrees to return it to the Borrower at the request of the Borrower.

This presentation should not be considered as the giving of investment advice by the Borrower or any of its shareholders, directors, officers, agents, employees or advisors. Each party to whom this
presentation is made available must make its own independent assessment of the Borrower after making such investigations and taking such advice as may be deemed necessary. In particular, any
estimates or projections or opinions contained herein necessarily involve significant elements of subjective judgment, analysis and assumption and each recipient should satisfy itself in relation to such
matters. Neither the issue of this presentation nor any part of its contents is to be taken as any form of commitment on the part of the Borrower to proceed with any transaction nor is the right reserved to
terminate any discussions or negotiations with any prospective lenders. In no circumstances will the Borrower be responsible for any costs, losses or expenses incurred in connection with any appraisal or
investigation of the Borrower.

This presentation does not constitute, or form part of, any offer or invitation to sell or issue, or any solicitation of any offer to subscribe for or purchase any securities in the Borrower, nor shall it, or the fact of
its distribution, form the basis of, or be relied upon in connection with, or act as any inducement to enter into, any contractor commitment what so ever with respect to such securities. The Borrower assumes
that the recipient has professional experience and is a high-net worth individual or Borrower this presentation has not been approved as any governmental agency.

By accepting this presentation, the recipient represents and warrants that it is a person to whom this presentation may be delivered or distributed without a violation of the laws of any relevant jurisdiction.
This presentation is not to be disclosed to any other person or used for any other purpose and any other person who receives this presentation should not rely or act upon it. Neither the Borrower nor its
directors make any recommendation as to the matters set out in the presentation. Prospective lenders interested in investing in the Borrower are recommended to seek their own independent legal, tax
and/or financial investment advice from a competent financial advisor. The whole of the presentation should be read. Reliance on this presentation for the purposes of engaging in any investment in the
Borrower may expose an individual to a significant risk of losing the entire investment and may not be suitable for all recipients.

                                                                                                                                                                                                                               2
Earnings Call Presentation - FY 2021 - IuteCredit Europe
Presenting

            Tarmo Sild                                                         Kristel Kurvits
            Chief Executive Officer                                            Chief Financial Officer

        •   Co-founder of IuteCredit                                       •    Kristel has been building IuteCredit since 2017

        •   After graduating high school with gold medal in 1994,          •    Kristel holds a Master’s degree in Financial Management from
            tossed the coin, whether to study economics or law.                 Estonian Business School
            Tarmo holds a Master’s degree with distinction in Law
            from Vrije Universiteit Brussels while BA degree was           •    Since 2000 she has served as Chief Financial Officer for MTÜ
            obtained in University of Tartu after one year of studies in        Estonian Banking Association
            University of Helsinki.
                                                                           •    Has performed as chief accountant of Ektornet Land Estonia OÜ,
        •   Tarmo started his professional career as attorney in 1999           the SPV of Swedbank Group to deal with the high risk exposures
            and was founding partner and manager of LEXTAL Law                  in 2008 financial crisis) and financial reporting of the group
            Firm until 2010                                                     companies

        •   Co-founded IuteCredit with Allar Niinepuu in 2008, after a     •    Kristel started her professional career at Hansa Leasing Inkasso
            late-night discussion with an inspirational Estonian banker         OÜ (part of Hansapanga Group)

                                                                                                                                               3
Earnings Call Presentation - FY 2021 - IuteCredit Europe
Group Highlights

  Total Customer Pool           Net Loan Portfolio            •   2021 as year of growth reflecting evolution towards fully digitized customer
                                                                  solutions and diversified revenue streams, including now payment services
            ~811,000+                     105.4 EURm
            +124,000 vs. FY20             +33.1% vs. FY20     •   Even more sustainable credit practices – larger loan amounts for longer periods,
                                                                  but lower interest for customers – as contributing factors

  Total Income FY 2021          Adj. EBITDA                   •   Loan payouts with strong growth up 41.9% while repayment discipline improved
                                                                  further
            61.2m                         22.8m
            +9.1% vs. FY20                +9.4% vs. FY20
                                                              •   Robust default recovery maintained, with average of 40% of principal collected in
                                                                  cash within first 180 days after default

  Customer Performance          NPLs in Net Portfolio         •   Growing and investing in online technologies – MyIute app downloads reached
  Index (CPI) in FY 2021                                          180,000+ at YE21 with increasing momentum

            86.7%                         11.3%
            vs. 84.6% FY20                vs. 16.6% in FY20   •   Rollout of 30 cardless ATMs to date cuts intermediaries and reduces need for
                                                                  plastic cards and cuts plastic waste

                                                                                                                                                      4
Earnings Call Presentation - FY 2021 - IuteCredit Europe
Operational Footprint
    Geographical and product diversification                                                        Moldova
                                                                                                    •   Launch: August 2008
             Bosnia and Herzegovina                                                                 •   Loans issued 2021: 62.1 EURm
                                                                                                    •   Net loan portfolio 2021: 40.4 EURm
                                                                                                    •   Total income 2021: 24.5 EURm
              •    Launch: May 2019                                                                 •   EBITDA 2021: 7.2 EURm
              •    Loans issued 2021: 4.9 EURm                                                      •   Impairments 2021: 6.2 EURm
              •    Net loan portfolio 2021: 2.8 EURm
              •    Total income 2021: 2.0 EURm
              •    EBITDA 2021: -2.7 EURm
              •    Impairments 2021: 0.8 EURm

                                                                                                                Bulgaria
                                                                                                            •   Launch: June 2021
      Albania                                                                                               •
                                                                                                            •
                                                                                                                Loans issued 2021: 1.8 EURm
                                                                                                                Net loan portfolio 2021: 1.1 EURm
                                                                                                            •   Total income 2021: 0.2 EURm
•   Launch: April 2015                                                                                      •   EBITDA 2021: -0.7 EURm
•   Loans issued 2021: 65.9 EURm                                                                            •   Impairments 2021: 0.3 EURm
•   Net loan portfolio 2021: 41.1 EURm
•   Total income 2021 : 23.8 EURm
•
•
    EBITDA 2021: 7.9 EURm
    Impairments 2021: 5.0 EURm
                                                       North Macedonia                          ?       New Countries
                                                       •   Launch: September 2017                       •   Get additional access to at least 20
                                                       •   Loans issued 2021: 32.4 EURm                     million people markets before 2023
                                                       •   Net loan portfolio 2021: 20.0 EURm
                                                       •   Total income 2021: 9.5 EURm
                                                       •   EBITDA 2021: 3.7 EURm
                                                       •   Impairments 2021: 2.6m EURm                                                              5
         Share of loans issued in FY 2021

                                                                                                                                                        CFO
Earnings Call Presentation - FY 2021 - IuteCredit Europe
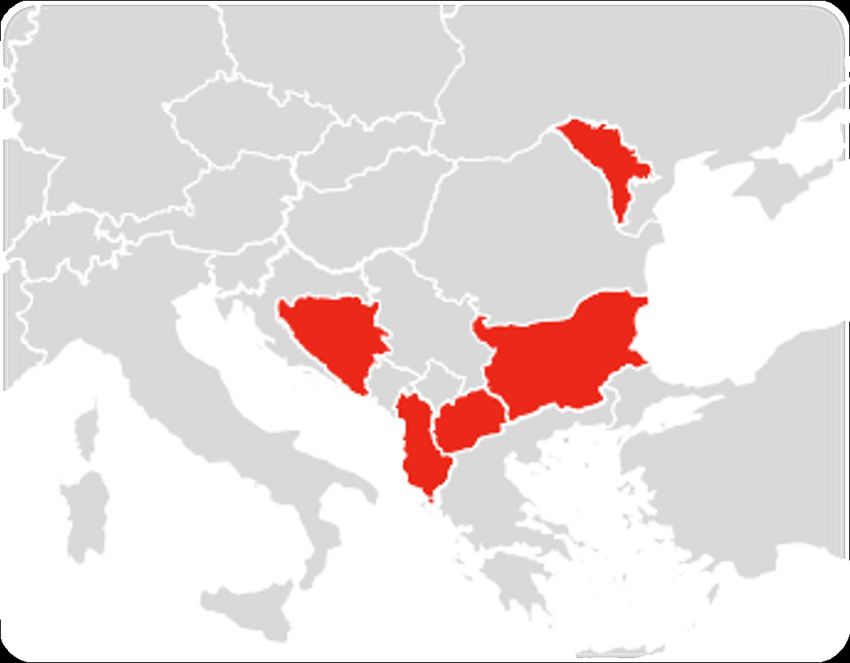
Operating Highlights

 Total income growth (EURm)                                                                                                                                      •   Total income up 9.1% to 61.2 EURm in FY21
                                                                                                                           5.6
                                     5.3
                                                           5.1
                                                                                                           5.5      5.3                                          •   Almost 4% of total revenue generated with Wallet services – share of services-
                          4.9                                                                     5.0      0.5%            0.8%
                                     0.4%      4.8                     4.7             4.7                                          Other Income
           4.5                                                                                                     0.7%
  4.4                    0.5%                 0.4%
                                                          0.5%
                                                                       0.4%        0.7%
                                                                                                  0.7%                                                               related money payments processing increasing
 0.6%      0.6%
                                                                                                                                    Loan Administration Fees
                                                                                                                                    and Penalties
                                                                                                                                                                 •   Loan payout increase of 41.9% translating to total asset expansion of 166.8 EURm
                                                                                                                                    Fee and Commission
                                                                                                                                    Income From Other
                                                                                                                                    Services                         at YE21
                                                                                                                                    Fee and Commission
                                                                                                                                    Income From Loan Portfolio
                                                                                                                                    Interest Income              •   WA APR of new loan issuances gradually decreased to 54% while loan maturity
                                                                                                                                                                     tends to be longer, at 20 months

                                                                                                                    …
           b…

                                                                                               p…

                                                                                                                             …
                                                                                                            …
    …

                                                                                     …
                                                                       ly

                                                                                                                           ez
  n-

                                                                                                          kt

                                                                                                                   ov
                                              ay
                          ch

                                                          ne

                                                                                   ug
                                     il

                                                                                             Se
        Fe

                                  pr

                                                                   Ju

                                                                                                          O
Ja

                                             M

                                                                                                                          D
                                                                                                                  N
                       ar

                                                         Ju

                                                                                  A
                                 A
                      M

                                                                                                                                                                 •   MyIute App downloaded by more than 180,000 customers at YE21 since its
 Steady improvement of loans issued                                                                                                                                  launch in Q1 21
 (EURm), lower APR & longer maturity                                                                                      Total assets (EURm)

 23              23
                                  22           22          22               22
                                                                                                                                         43 %      166.8
                                                                                             20

        54%                                                                                                                      116.6
                        53%                                                                               loan issuance
                                     52%                                                                  WA Maturity
                                                   51%           51%             51%
                                                                                                         WA APR
                                                                                             49%

  Jun 21      Jul-21           Aug-21       Sep-21       Oct-21        Nov-21          Dec-21                                FY 2020             FY 2021

                                                                                                                                                                                                                                                        6
Earnings Call Presentation - FY 2021 - IuteCredit Europe
Loan Repayment Behaviour

Customer Performance Index                                                                     Evolution of Customer Performance Index (CPI 30)

•   Customer Performance Index (CPI) is a unique index developed by IuteCredit:

                                                                                         90%
                                     !"#$%& '()#*&+ ,-.%+/-)#0
                            CPI =                                                        85%
                                    12.-"#-3 '()#*&+ ,-.%+/-)#0
                                                                                         80%
                                                                                         75%
•   CPI measures customers’ actual repayments against the expected repayments,
                                                                                         70%

    according to the repayment schedules of their loan agreements, within a tolerance    65%
                                                                                         60%

    period for repayment delays. We consider it superior to NPL’s as measurement tool.   55%
                                                                                         50%
                                                                                                 2017      2018        2019    2020      FY 2021    Q1 Q2 Q3 Q4 Q1 Q2 Q3 Q4
•   CPI is a cashflow-centric indicator that avoids illusions from evergreening or                            CPI 30
                                                                                                                                                   20202020202020202021202120212021

    inadequate provisioning. Repayment with maximum 30 days of delay (CPI 30) is
                                                                                           •    CPI 30 remained stable over years, yet was moderately affected since Mid-March
    considered normal. IuteCredit declares a loan defaulted (and recognizes it as NPL)
                                                                                                2020 due to public lockdown caused by COVID
    when repayment is delayed for more than 50 days (DPD+50).

•   AT YE21, IuteCredit reached a CPI30 ratio of 86.7% as the weighted average across      •    IuteCredit’s successful navigation led to a steady recovery in CPI 30

    products and markets.

                                                                                                                                                                                      7

                                                                                                                                                                                          CRO
Repayment Dynamics

                                                                                                                   160%

•   The vintage chart indicates IuteCredit’s loan repayment performance over time
                                                                                                                   140%                                                                                                135%
    by showing the aggregate repayments of different monthly loan issuance cohorts                                                                                                                                 134%    135%
                                                                                                                                                                                                                                        134%
    (vintages), as measured in % of the original paid out loan amount (100%).
                                                                                                                   120%

•   September 2019 to February 2020 vintages demonstrate a relatively complete

                                                                                         Collection/payout ratio
                                                                                                                   100%
    loan cycle, whereas March 2020 to December 2021 vintages include loans which
    full maturity has not yet arrived
                                                                                                                   80%

•   Most of the loan cohorts can recover their paid-out principal by 7 to 9 months                                 60%

    from the moment of paying out, which is significantly shorter than the average
    loan maturity of 18 months, indicating IuteCredit’s excellence in loan                                         40%

    repayments efficiency
                                                                                                                   20%

•   By the end of loans lifecycle, IuteCredit can receive about ~135% of the paid-
                                                                                               0%
                                                                                     Month on book                        1    2   3   4   5   6    7   8     9      10   11    12   13   14   15   16   17   18   19   20   21    22
    out amount which represents the profitability of lending
                                                                                                                              19-May       19-Jun           19-Jul             19-Aug          19-Sep          19-Nov             19-Dec
                                                                                                                              20-Jan       20-Feb           20-Mar             20-Apr          20-May          20-Jun             20-Jul
                                                                                                                              20-Aug       20-Sep           20-Oct             20-Nov          20-Dec          21-Jan             21-Feb       8

                                                                                                                                                                                                                                                   CRO
Defaulted Performance
Index
•   Defaulted Performance Index (DPI) is another index that is used by                                                      Defaulted Loan Collection (FY21)
    IuteCredit:                                                                                                            €m
                                                                                                                           90%

                                                                                                                           80%

                             !"#$%& ,-.%+/-)#0 %4#-5 6-5/7)%#7()
                     DPI =
                                 857)"7.%& 9-:# %# 6-5/7)%#7()                                                             70%

•   DPI measures the amount of principal capital that is rescued after the loan                                            60%

                                                                                    Collection/Defaulted Principal Ratio
    agreement defaults. It is a ratio of actual collected amount from defaulted                                            50%

    customers against the principal debt amount at termination of loan                                                     40%

    agreements within a certain period from the default                                                                    30%

•   IuteCredit has always been focusing on debt collection as integrated but                                               20%

    autonomous business part with its own KPI’s, business processes and team
                                                                                                                           10%

•   As can be seen in the chart, most of the defaulted cohorts can achieve
                                                                                  Month on0%
                                                                                           Book
                                                                                                                                 1   2   3      4     5     6      7    8       9   10   11   12   13   14   15   16      17    18     19     20    21      22   23   24
    55%~70% of the defaulted amount towards the end of 24-month timeline                                                                     Jun 19       Jul 19       Aug 19       Sep 19    Okt 19     Nov 19        Dez 19        Jan 20        Feb 20
                                                                                                                                             Mär 20       Mai 20       Jun 20       Jul 20    Aug 20     Sep 20        Okt 20        Nov 20        Dez 20
•   In April 2020, there were very few terminated loans due to the payment                                                                   Jan 21       Feb 21       Mär 21       Apr 21    Mai 21     Jun 21        Jul 21        Aug 21        Sep 21

                                                                                                                                                                                                                                                                           9
    holidays caused by COVID, therefore the cohorts behaved as an outlier
Financial Highlights

                                                                                                                     •   Total income up 9.1% to 61 EURm
Adj. EBITDA Growth (EURm)                            Operating Expenses Breakdown (EURm)

                                                                                                                     •   EBITDA adjusted for FX/revaluations increased 9.4% to 22.8EURm in FY21,
                                                                                              Other
                  9.4 %                                                                                                  benefitting from improved allowances
                           22.8                                                               Travel
         20.9                                                                                 Taxes
                                                                                              Rent and utilities
                                                                                              Legal and consulting   •   Operating expenses driven by recovering business activities as well as
                                                                                              Debt collection
                                                                                              IT                         strategic initiatives and consulting costs such as advertising expenses (+93%
                                                                                              Advertising expenses
                                                                                              Personnel                  yoy), IT (+181% yoy), and debt collection (+181% yoy),

         2020             FY 2021                          2020              FY 2021                                 •   Net loan portfolio sustainably growing 33.1% to 105.4 EURm at YE21driven by
                                                                                                                         new customers and returning customers as well as improved repayments
Net loan portfolio growth (EURm)                                  Net profit growth (EURm)
                                           130,92 105.37                         15.7 %     6.1                      •   Net profit up 15.7% to 6.1 EURm in FY21 affected by increased interest
                                  101.59
                          98.79                                        5.2
                  96.07                                                                                                  payments related to bonds issuances while cash position remained high.
          92.67
88.11

                                                                                                                     •   Stable capitalization ratios of 24.3% and interest coverage ratio of 1.6 (LTM)

Jun 21    Jul 21 Aug 21 Sep 21 Okt 21 Nov 21 Dez 21
                                                                      2020                FY 2021
                                                                                                                                                                                                          10
Financial Ratios
Income & Adj. EBITDA in EURm                                        Net profit in EURm & Net profit margin                                                       Capitalization ratio
                                                                     9,0                          8.4
                                                      61.2
                                   56.0                              8,0          7.3                                                            33%
                     50.8                                            7,0                                                                                                     27.1%
                                                                                                                                6.1              28%   26.4%
                                                                     6,0                                        5.2                                                                      24.3%
                                                                                         22%                                                                        23.4%
                                                                                                                                                 23%
     33.4                                                            5,0
                                                                     4,0                                 17%                                     18%
                            20.2          20.9               22.8                                                                                                                                       15%
                                                                     3,0
                                                                                                                       9%                        13%
            12.9                                                                                                                      10%
                                                                     2,0
                                                                                                                                                 8%
                                                                     1,0
                                                                     0,0                                                                         3%
      2018            2019           2020             FY 2021                     2018            2019          2020          FY 2021                  2018          2019    2020        FY 2021

                       Income       EBITDA

                   Cost to income ratio                                                        Leverage ratio                                                  Interest coverage ratio

                                                         40.3%
                                                                                                          3.7          3.8                  1)
                                                                                                                                      3.6               3.3
                                                 2)
                                      32.4%                                                2.8
                       30.7%                                               2.8
       28.8%
                                                                                                                                                                      2.2
                                                                                                                                                                              1.9
                                                                                                                                                                                                   1)
                                                                                                                                                                                            1.6
                                                                                                                                                                                                        1.5x

       2018             2019          2020              FY 2021            2017            2018          2019          2020      FY21 FY               2018          2019     2020       FY 2021

                                                                                                                                                                                                               11
1)      Adjusted for FX gains/losses
2)      Adjusted for one-time Kosovo expenses
                                                                                                                                                                                                                    CFO
Loan Asset Quality Analysis

Net loan portfolio quality analysis (YE21)                                                          Gross and net NPL (50+ DPD) portfolio

                                                                                              30%
                       2%        11%
                                                                                              25%

                                                                                              20%
                                                         Stage 1: Current - 30 days overdue
                                                                                              15%

                                                         Stage 2: 31 - 50 days overdue        10%

                                                                                              5%

                                                         Stage 3: 50+ days overdue (NPL)      0%
                                                                                                     2017 2017 2017 2017 2018 2018 2018 2018 2019 2019 2019 2019 2020 2020 2020 2020 2021 2021 2021 2021
                                        87%                                                           Q1 Q2 Q3 Q4 Q1 Q2 Q3 Q4 Q1 Q2 Q3 Q4 Q1 Q2 Q3 Q4 Q1 Q2 Q3 Q4
                                                                                                                           Gross NPLs / Gross portfolio    Net NPLs / Net portfolio

  • IuteCredit applies a conservative internal NPL definition                                 • IuteCredit’s Gross and Net NPL ratios have been stable during 2016 and 2020, yet
  • Loans 50+ DPD recognized as non-performing loans (NPLs); in 2016 and 2017                       was negatively impact by COVID during Q2 and Q3 2020
      NPLs have been defined as 70+ DPD, in 2015 and earlier as 90+ DPD                       • Both Gross and NPL ratios declined and recovered towards pre-COVID level
  • IuteCredit has always followed the ECL methodology prescribed by IFRS 9                   • At YE21, IuteCredit’s gross NPL stood at 18.1%, net NPL at 11.3%
  • IuteCredit creates and accounts for provisions simultaneously when loans are              • The Company’s provision coverage ratio resulted in 69.0% at YE21, down from
      being issued                                                                                  71.1% at YE20
                                                                                                                                                                                                           12
1) Cost of risk=impairment charge/gross loan portfolio
                                                                                                                                                                                                                CFO
Assets & Liabilities

Assets (EURm)                                                                                                      Liabilities (EURm)                                                Liability maturities (EURm)
 180                                                                                                       166.8
                                                                                                                                                                                                                       71.9

                                                                                                                                                              Cash

                                                                                                                                                                                   46.3
 150
                                                                                                                                                                                                                  0
                                                                                         116.6
 120                                                                  106.3                                                                123.6

                                                                                                                                                              Net loan portfolio
    90                                                                                                                      Net interest

                                                                                                                                                                                   105.4
                                                                                                                          bearing liabilities                                                     51.0   3.8
                                                   55.3
    60                                                                                                                      89.4 EURm

    30                          23.0                                                                                   11.2
                8.8                                                                                                       0.9
                                                                                                                                                                                           8.9
     0
               2016             2017               2018               2019               2020              2021
                                                                                                                       Loans and leasing        Bonds   P2P                                2022   2023   2024   2025   2026+

                                                                                                                   •   Total liabilities stood at 141.2 EURm at YE21 (YE20: 95.1 EURm).
                                        2017              2018           2019             2020            2021
                                                                                                                   •   Loans and borrowings at 135.7 EURm (YE20: 91.4 EURm), accounting for 96.1% of
    Capitalization ratio               23.0%              26.4%          23.4%           27.1%            24.3%        all liabilities (2020: 96.1%)
                                                                                                                   •   Bonds accounting for majority of borrowings (91%), followed by loans and leasing
•        91% of total assets consist of net loan portfolio as well as cash and liquid assets at                        (8%)
         YE21
•        Clearly-structured balance sheet
•        Healthy capitalization

Note: Net interest-bearing liabilities: Total interest-bearing liabilities minus cash and liquid assets
                                                                                                                                                                                                                               13

                                                                                                                                                                                                                                CFO
Strategic Roadmap 2023

Roll-out and continuous improvement of technology

• Loan Engine
• Task Management
• Customer Management
• Data Analytics and Reporting                                                    1 million performing customers
• Core Banking System
                                                       Skills
                                                                  Multinational
                                                                                  1 EUR billion balance sheet
Roll-out and continuous extension of services          Services   IuteCredit
                                                                  Neo Bank
• Mobile App                                           Growth                     20% Profit margin
• Online Identity Verification and Digital Signature
• Digital Wallet
• ATM network

Expansion into banking and countries

• Entry into new countries 2022-2023 with
  IuteCredit total access to more than 50 million
  people
• Acquisitions or set-ups from scratch
                                                                                                                   14

                                                                                                                    CEO
Environmental, Social &
Governance

     Environmental                                          Social                                                   Governance
 •   MyIute app saves customers from unnecessary        •   Responsible lending with full transparency, clear    •   Non-discrimination policy and inclusion policy
     travel to the branch or agent, with ecological         pricing and no hidden costs                              fully implemented on all Group companies
     footprint of about 120,000 less travels per        •   Offer clients in underbanked markets financing       •   Well balanced gender diversity among the
     quarter, translating to at least 480,000 less          for their daily basic needs as well as for               group
     travel kilometres per month                            improvement of their lifestyle                       •   Offer its employees work and self-improvement
 •   Avoid usage of paper and promotion of online       •   Support several education campaigns to                   opportunities as further education, team trainings
     and non-paper interaction channels with the            increase the financial literacy; donated hospitals       and attractive bonuses
     customers, ~125,000 pages of paper are saved           and sponsored sport clubs                            •   Health and safety of employees as priority
     per month, equals to 15 big trees                                                                           •   IuteCredit is the first company from Estonia listed
                                                        •   100,000 lei (ca 5000 EUR) was donated to the             in the General Standard of the Frankfurt Stock
 •   Digital revolution on the Balkan markets by            Republican       Clinical     Hospital   "Timofei
     piloting cardless ATMs, thereby diminishing the                                                                 Exchange
                                                            Moșneaga" in Moldova
     need for plastic cards and reducing possible       •   #Granny_Stay_Home campaign launched to
     plastic waste                                          bring food home to the elderly in Moldova
 •   All offices have paper collection boxes for the    •   Medical equipment donated to Tirana Hospital
     purpose of recycling; bathrooms have air hand-         and food packages distributed to families and
     dryers                                                 pensioners in need in Albania
 •   Usage of LED lamps as illumination and reduction   •   Over 100 medical suits and high-quality
     of plastic waste                                       protection masks donated to the public clinics in
 •   Eco-friendly packaging for business lunch              Macedonia
     deliveries

                                                                                                                                                                           15

                                                                                                                                                                                CFO
Group Legal Structure

                                                                   Tarmo Sild and Kristi Sild                                        Allar Niinepuu

                                                                                  50% (indirect
                                                                                   ownership)
                                                                                                                                    50% (indirect ownership)
                                                                                                         Alarmo Kapital OÜ

                                                                                                               89,82%

                                                                                                                                                               Management team
                                       IuteCredit Finance S.à r.l. (under the                        IuteCredit Europe AS                                             &
         The Issuer                           laws of Luxembourg)                      100%                (Estonia)                10,18%
                                                                                                                                                               Round B Investors

       100%                           100%                           100%                         100%                       100%                       100%                       100%                    100%

                                                                                                                            IuteCredit
O.C.N. “IUTE             IuteCredit Kosovo JSC                                                                                                                               MKD IuteCredit BH
                                                             IuteCredit Albania        IuteCredit Bulgaria              Macedonia DOOEL           IutePay Bulgaria                                 Velox Pay SH. P.K.
CREDIT” S.R.L.               (in liquidation                                                                                                                                   d.o.o. Sarajevo
                                                               SH.A (Albania)           EOOD (Bulgaria)                   Skopje (North           EOOD (Bulgaria)                                      (Albania)
 (Moldova)                      process)                                                                                                                                    (Bosnia Herzegovina)
                                                                                                                           Macedonia)

                                                                                                                                                                                                                        16
        Note: Group Legal structure as of 31 December 2021

                                                                                                                                                                                                                             HLC
Income Statement
in EURm                                                  2018       2019      2020     FY 2021
                                                          22.6       47.0      44.5        48.3
Interest and commission fee income                      (69.8%)    (92.5%)   (79.4%)    (78,9%)
                                                           9.4        3.5       8.4         8.2
Loan administration fees and penalties                  (29.1%)     (6.9%)   (15.0%)    (13,4%)
                                                           0.3        0.3       3.1         4,7
Other income                                             (1.1%)     (0.5%)    (5.6%)     (7,6%)
                                                          33.4       50.8      56.0       61.2
Total Income                                           (100.0%)   (100.0%)   (100%)     (100%)
                                                          (3.9)      (9.0)    (11.0)      (14.4)
Interest expense                                        (11.9%)    (17.7%)   (19.6%)    (23,5%)
                                                         (10.4)     (11.0)    (18.8)      (16.3)
Allowances for loan impairment                          (32.0%)    (21.5%)   (33.5%)    (26,7%)
                                                          18.2       30.9      26.3       30.5
Net operating income                                    (56.1%)    (60.8%)   (46.9%)    (49,8%)
                                                          (3.9)      (6.3)     (8.1)       (8.9)
Salaries and other personnel expenses                   (12.0%)    (12.4%)   (14.4%)    (14,6%)
                                                          (5.2)     (14.2)     (8.3)      (13.1)
Other operating expenses                                (16.1%)    (28.0%)   (14.8%)    (21,4%)
                                                          (0.2)      (1.2)     (1.7)       (2.6)
Depreciation/amortization charge                         (0.7%)     (2.4%)    (3.1%)     (4,3%)

                                                              -       1.0          -        0.8
Financial assets measured at fair value gains/losses                (1.9%)               (1.4%)
                                                           0.7        0.4      (2.0)        1.2
Foreign exchange gains/losses                            (2.0%)     (0.7%)    (3.5%)     (3,3%)
                                                           9.5       10.5       6.2        7.9
Profit or loss before taxes                             (29.3%)    (20.6%)   (11.0%)   (12,9%)
                                                          (2.2)      (2.1)     (0.9)       (1.8)
Income tax                                               (6.9%)     (4.1%)    (1.7%)     (3,0%)
                                                           7.3        8.4       5.2         6.1
Net profit for the year/period                          (22.4%)    (16.5%)    (9.4%)     (9,9%)
                                                           0.5       (0.3)     (1.8)        1.2
Other comprehensive income                               (1.6%)     (0.6%)    (3.1%)     (1,9%)
                                                           7.8        8.1       3.5         7.2
Total comprehensive income for the year/period          (24.0%)    (15.9%)    (6.2%)    (11,8%)
                                                                                                   17

                                                                                                        CFO
Balance Sheet

in EURm                                   2018   2019    2020     FY 2021

Assets
Cash and bank accounts                     2.6     6.7    19.5        46.2
Loans to customers                        48.1    79.0    79.2       105.4
Prepayments                                0.3     0.9     1.3         0.6
Other assets                               1.7     2.5     2.7         3.1
Other financial investments                1.5     9.9     7.2         2.8
Property, plant and equipment              0.5     1.0     1.0         1.1
Right-of-use assets                          -     2.9     2.1         1.6
Intangible assets                          0.7     3.3     3.7         5.9
Total assets                              55.3   106.3   116.6       166.8

Liabilities and equity
Liabilities
Loans and borrowings                      39.2    84.1    91.4       135.7
Other liabilities                          3.4     3.7     3.7         5.5
Total liabilities                         42.6    87.7    95.1       141.2

Equity
Share capital                             10.0    10.0    10.0        10.0
Legal reserve                              0.0     0.4     0.5         0.8
Unrealized foreign exchange differences    0.4     0.1    (1.7)       (0.5)
Retained earnings                          2.3     8.0    12.6        15.3
Total equity
                                          12.7    18.5    21.5        23.7
Total equity and liabilities
                                          55.3   106.3   116.6       166.8
                                                                              18

                                                                                   CFO
Statement of Cash Flow

in EURm                                                  2018     2019     2020     FY 2021         in EURm                                            2018     2019     2020     FY 2021

Operating activities                                                                              Financing activities
Prepayments to partners for issuance of loans             (6.3)   (11.3)   (11.4)      (25.9)
                                                                                                                                                        26.1     85.0     51.4       113.2
                                                            9.3    12.8     36.2        33.4      Loans received from investors
Received pre- and overpayments from customers
                                                                                                                                                       (10.8)   (48.5)   (42.3)      (74.3)
Paid trade payables                                       (5.9)   (10.7)   (12.3)      (18.2)     Repaid loans to investors

                                                            0.0      0.8     0.9         2.4                                                             2.0      4.2     (5.2)             -
Received debts from buyers and received other claims                                              Change in overdraft
Received from collection companies                          7.4     13.0     22.6        27.8                                                               -    (0.9)    (0.9)       (1.0)
                                                                                                  Principal payments of lease contracts
Paid net salaries                                         (2.3)    (4.5)    (5.3)       (6.7)
Paid tax liabilities, exc. CIT                            (1.5)    (2.9)    (3.0)       (4.9)                                                           (3.7)    (5.2)    (8.0)       (8.9)
                                                                                                  Paid interests
Corporate income tax paid (CIT)                           (1.4)    (3.3)    (1.9)       (1.4)
                                                                                                                                                        (2.0)    (2.2)    (0.5)       (3.2)
Paid out to customers                                    (39.3)   (76.2)   (47.4)      (67.6)     Paid dividends

Paid out loans to customers related to MC                     -    (0.1)        -             -                                                          3.2         -        -             -
                                                                                                  Capital increase
                                                              -    (1.4)    (8.2)      (17.2)                                                               -     0.0         -             -
Change in MasterCard (MC) settlement account                                                      Grants received
Principal repayments from customers                       20.4     40.3     29.4        41.6
                                                                                                                                                            -        -    (0.0)         0.0
                                                                                                  Payments for other financing activities
                                                              -      0.5     4.5        12.6
Loan principal repayments from customers related to MC                                                                                                      -        -     0.0          0.0
                                                            8.8    17.4     15.0        21.1      Receipts from other financing activities
Interest, commission and other fees
                                                         (10.7)   (25.6)   18.9         (3.1)                                                          14.9     32.4     (5.4)       (25.8)
Net cash flows from operating activities                                                          Net cash flows from financing activities

Investing activities
Purchase of fixed assets                                  (0.8)    (0.8)     0.5        (1.9)     Cash and cash equivalents at the beginning of the      1.8      2.6      6.7        19.5
                                                          (1.1)    (0.2)        -             -   period
Net cash flow from acquisition of subsidiaries
                                                              -      0.2        -             -                                                          0.9      4.0     13.2        26.7
Received from the sale of subsidiaries                                                            Change in cash and cash equivalents
Payments for other financial investments                  (1.5)    (1.8)    (7.3)       (0.0)                                                           (0.0)     0.0     (0.5)         0.1
                                                                                                  Net foreign exchange difference
Receipts from other financial investments                   0.0        -     6.5         5.9
                                                                                                  Cash and cash equivalents at the end of the period     2.6      6.7    19.5         46.3
Net cash flows from investing activities                  (3.3)    (2.7)   (0.3)         3.9
                                                                                                                                                                                                19

                                                                                                                                                                                                     CFO
Thank you for your attention!

IuteCredit Group                        Contact person:
Maakri 19/21                            Kristel Kurvits, Group CFO
EST-10145 Tallinn, Estonia              Phone: +372 62 29 177
www.iutecredit.com                      investor@iutecredit.com

Aalto Capital Group                     Contact person:
(Investor Relations)                    Sven Pauly, Consultant
Bahnhofstr. 98                          Phone: +49 89 89 86 777 0
D-82166 Graefelfing / Munich, Germany   sven.pauly@aaltocapital.com
www.aaltocapital.com
You can also read