H1 2021 RESULTS INVESTORS PRESENTATION 24 AUGUST 2021 - GTC
←
→
Page content transcription
If your browser does not render page correctly, please read the page content below
H1 2021 RESULTS
     INVESTORS PRESENTATION
     24 AUGUST 2021

1
CONTENTS

     KEY HIGHLIGHTS H1 2021

     PORTFOLIO

     DEVELOPMENT PROJECTS

     OPERATIONS AND FINANCIALS

     ADDITIONAL MATERIALS

2                             | H1 2021 RESULTS |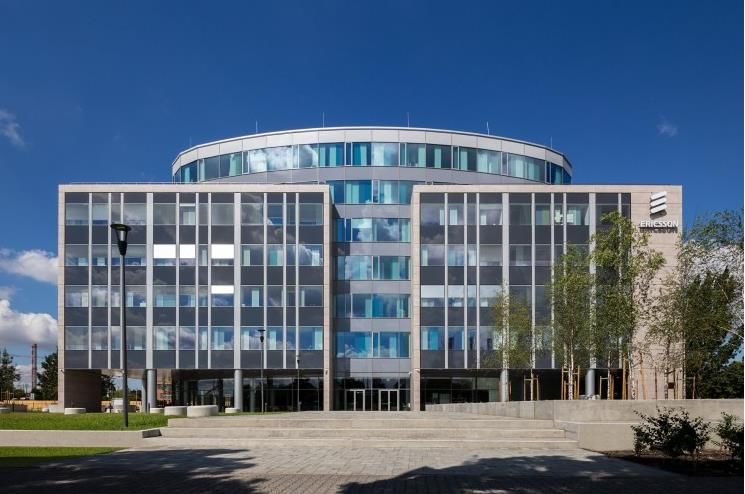
FINANCIAL RESULTS: STRONG EARNINGS, TRANSFORMATION TO
UNSECURED DEBT AND €300m INVESTMENT
Gross margin from rental activity at €59m in H1 2021 (€59m in H1 2020)
Adjusted EBITDA at €52m in H1 2021 (€52m in H1 2020)
FFO at €31m (€33m in H1 2020), FFO per share at €0.06
EPRA NAV at €1,126m as of 30 June 2021, EPRA NAV per share at €2.32 (PLN 10.49)
Strong liquidity position with cash and cash equivalents at €246m as of 30 June 2021
Investment of €268m into acquisition of income generating assets and landbank for future
development
Occupancy at 91% (91% as of 31 December 2020)
€59m €31m €246m €268m
GROSS MARGIN FFO I CASH ACQUISITIONS
Source: GTC
3 | H1 2021 RESULTS |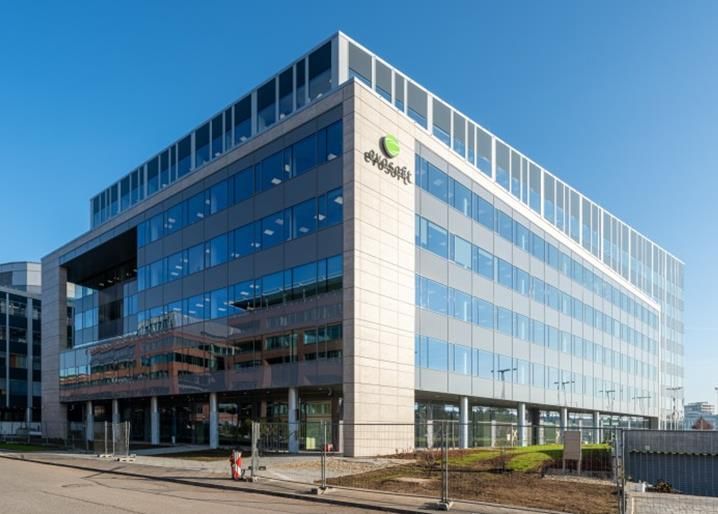
FINANCIAL RESULTS: TRANSITIONING FROM SECURED TO
PREDOMINANTLY UNSECURED DEBT
Two rating agencies assigned a corporate family rating (“CFR”) to GTC:
− Fitch Ratings (“Fitch”) – BBB- with stable outlook
− Moody's Investors Service ("Moody's") – Ba1 with positive outlook
Issue of €500m of green Eurobonds in June 2021 (2.8x oversubscribed with a peak order book in
excess of €1.4bn.)
€369.1m of secured project loans refinanced
− €13.0m for GTC Metro
− €174.1m for Galeria Północna
− €41.6m for Korona Office Complex
− €41.1m for Advance Business Center
− €62.0m for City Gate
− €13.8m for Premium Point and Plaza
− €23.5m for Matrix.
€82m of secured project loans under the refinancing process
− €29m for Ada Mall
− €53m for Mall of Sofia
Unsecured debt at 48% and unencumbered properties up to 35% (9% as of 31 December 2020)
WAIR at historical low of 2.18%¹ (2.3% as of 31 December 2020)
Source: GTC ¹ Excludes loans related to assets held for sale
4 | H1 2021 RESULTS |
OFFICE SECTOR: A MIX OF ACQUISITIONS AND DISPOSALS COMBINED
WITH STRONGER LEASING ACTIVITY
€264m invested in 4 office building and one mix-use project in Hungary will contribute
€15.0m p.a. to our in-place rent
Disposal of Serbian office buildings for €268m (above the book value) to be closed in
Q3 2021
Commencement of construction of GTC X, 16,800 sqm office in Belgrade
Leasing activity reached over 53,000 sq m in H1 2021 (70,000 sqm in 2020)
− Prolongation and expansion of LyondellBasell in Globis Poznań (c.2,000 sq m)
− New lease with Milennium - Best Value in City Gate, Bucharest (c. 1,700 sq m)
− New lease with Theta Furniture & More in City Gate, Bucharest (c. 1,000 sq m)
− Prolongation of Millenium Bank in Francuska Office Centre, Katowice (c. 900 sq m)
Occupancy at 90%¹ as of 30 June 2021 (90% in December 2020)
Source: GTC ¹ Includes leases signed and starting post 30 June 2021
5 | H1 2021 RESULTS |
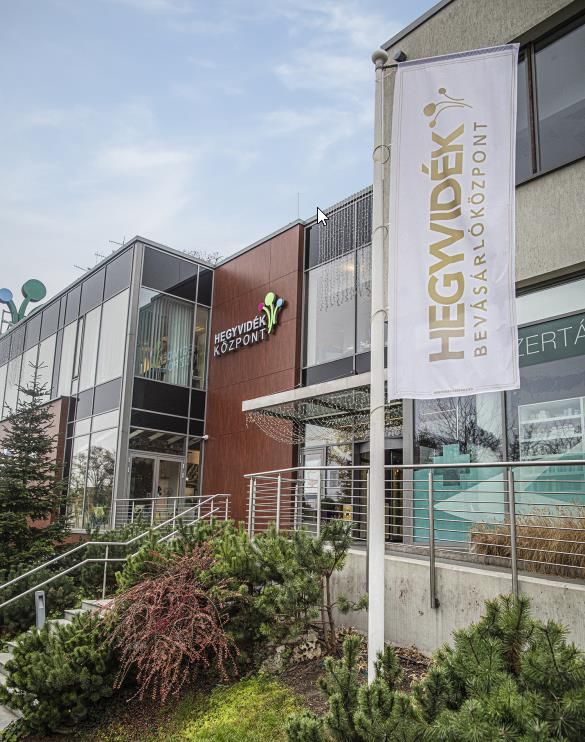
OFFICE SECTOR: RECENT ACQUSITIONS                                                                                               HUNGARY
  As of 30 June 2021

                                        4 office and
No of buildings
                                          1 mix-use
Location
                                Budapest, Hungary

GLA                                    78,800 sq m

Occupancy                                       98%               FOREST OFFICES ¹

In-place rent                                 €15m

Purchase price                               €264m

                       2 projects with LEED GOLD
Green certification         1 project with BREEAM                                                                HEGYVIDÉK RETAIL AND
                        2 project under certification                                                            OFFICE CENTRE
                                                                  VACI GREENS D

VACI 188                                  ERICSSON HQ                                                       EVOSOFT HUNGARY HQ

   Source: GTC                                          Note: (1) 24,000 sq office building in Debrecen acquired post balance sheet date for the amount of €47m
 6                                             | H1 2021 RESULTS |
RETAIL SECTOR: CURRENTLY 100% OF SPACE OPERATIONAL,
HOWEVER COVID-19 IMPACT STILL VISIBLE IN H1 2021
Currently, 100% of our retail GLA is allowed to trade
Occupancy at 94% as at 30 June 2021
(95% as at 31 December 2020)
Retailers continue to expand:
− 4,100 sq m Cinema City in Mall of Sofia (prolongation)
− 608 sq m Comsed in Mall of Sofia Galeria Jurajska
− 315 sq m Foot Locker in Galeria Jurajska
Avenue Mall and Ada Mall showed an increase in gross
margin from operations of €0.5m while Polish and Bulgarian
assets were negatively impacted by €1.1m.
Polish assets showed tremendous improvement in malls’
turnover in May, June and July
Mall of Sofia
Source: GTC
7 | H1 2021 RESULTS |
RETAIL: STRONG REBOUND POST EACH LOCKDOWNS WITH
HIGH CONVERSION RATE
GROUP FOOTFALL AND TURNOVER CHANGE (2021/2020 vs. 2019)
FOOTFALL          TURNOVER

                                                                                                  Next lockdowns                        Last lockdown
                                                                                                     46% GLA                              31% GLA
                                                                                                    operational                          operational           103%                  101%
                                                                                                                                                                            97%
                                                                                                                             92%
               First lockdown                              89%
                  16% GLA                          86%                86%
                operational           83%                                         80%
                                                                   77%                                                                                                             75%
                                                         74%                                                                                                72%
                                  70%        71%                               69%                                                                                    72%
                                                                                                      66%                 64%               66%

                        58%
                           58%
53%                                                                                                                                   55%
                                                                                             50% 53%
                                                                                          48%
      43%                                                                                                                                         40%
                                                                                                                    34%                              35%
                                                                                                              34%

            15%
                  10%

 March*    April* 2020 May* 2020 June 2020   July 2020    August   September    October   November December    January*   February*    March*     April* 2021 May*2021 June 2021   July 2021
  2020                                                     2020      2020        2020       2020     2020        2021       2021        2021

    restrictions on the opening                                                                               restrictions on the opening
       of shopping centres                                                                                       of shopping centres

Turnover                                                                                                          Galeria Północna                              Galeria Jurajska
May                                                                              2021v2019                                    113%                                         114%
June                                                                             2021v2019                                    106%                                         103%
July                                                                             2021v2019                                    111%                                         103%
 Source: GTC                                                                                                          Note: Period between January and May excludes Ada Mall data
8                                                                   | H1 2021 RESULTS |
CONTENTS

     KEY HIGHLIGHTS H1 2021

     PORTFOLIO

     DEVELOPMENT PROJECTS

     OPERATIONS AND FINANCIALS

     ADDITIONAL MATERIALS

9                             | H1 2021 RESULTS |
HIGH QUALITY PROPERTY PORTFOLIO WITH FOCUS ON OFFICES
As of 30 June 2021
TOTAL PORTFOLIO (BOOK VALUE)
90% of GAV base is recurring income-producing
66% of recurring income-producing portfolio is Project under construction
Belgrade
€370m
4% Budapest
office €605m 15%
Projects in pipeline Sofia
25% €187m
5%
Active development projects and land(1) reserves
(1) Landbank (incl. 8%
landbank held for
account for almost 10% of total property portfolio. sale)
Own use &
1%
83% of assets green certified
TOTAL GAV
€2,398m
Own use assetsOFFICE PORTFOLIO OVERVIEW
Sustainable high occupancy of prime office buildings provides solid recurring income
As of 30 June 2021
OFFICE ASSETS OVERVIEW
€1,431m €104m 47 624,000
GAV annualized buildings sq m GLA
in-place rent
GREEN CERTIFICATION OCCUPANCY RATE LOCATION
5% by GAV
12%
Warsaw
92% 93% 93% 94% 93% 95% 90% 90% 5%
3%
48%
83% assets Major Polish
cities (1) €1,431m
with green 22%
certification
32% Capital cities CEE
73%
LEED&preLEED BREEAM DGNB
Under certification No certificaton 2014 2015 2016 2017 2018 2019 2020 H1
2021 Note: (1) Cities with more than 200,000 inhabitants
Source: GTC Note: Data includes Avenue Centre in Zagreb and Sofia Tower in Sofia
11 | H1 2021 RESULTS |RETAIL PORTFOLIO OVERVIEW
Landmark shopping centers in local markets
As of 30 June 2021
RETAIL ASSETS OVERVIEW
€721m €47m 6 205,100
GAV annualized buildings sq m GLA
in-place rent
GREEN CERTIFICATION OCCUPANCY RATE LOCATION
12% 3% by GAV
95% 94% 95% 96% 95% 94% Budapest
90% 89% Belgrade 3% Zagreb
13% 12%
59% Sofia 11%
26%
85% assets
€721m
with green Warsaw
35%
certification
Częstochowa
26%
LEED BREEAM
2014 2015 2016 2017 2018 2019 2020 H1
Under certification No certificaton 2021
Source: GTC Note: Data excludes Avenue Centre in Zagreb and Sofia Tower in Sofia
12 | H1 2021 RESULTS |CONTENTS
KEY HIGHLIGHTS H1 2021
PORTFOLIO
DEVELOPMENT PROJECTS
OPERATIONS AND FINANCIALS
ADDITIONAL MATERIALS
13 | H1 2021 RESULTS |OFFICE FOCUSED DEVELOPMENT PIPELINE
54,000 sq m of class A offices under construction to be completed by end of 2022 with €11m
expected rental income
GTC X 16,800 sq m Class A office
16,800 sq m
PILLAR 29,000 sq m Class A office space Q3 2022
space
29,000 sq m
Q4 2021 Secured construction loan Total investment cost of €35.8m
Office space fully let to Exxon Under LEED certification
LEED GOLD pre-certification
LOIs signed for 2,500 sqm
Expected rental income upon
Expected rental income upon
stabilization of €3.5m
stabilization of €6.1m (96%
secured)
8,300 sq m new office space
Total investment cost of SOFIA 8,300 sq m CENTER
Redevelopment of 40,900 sq m
€13.4m TOWER 2 POINT 1&2 40,900 sq m Class A office buildings
Strong interest from potential Q2 2022 Q3 2022 Total investment cost of €10m
tenants Full renovation of ground floor
Under LEED certification
areas, lift, lobbies and exterior
Expected rental income upon
Under LEED certification
stabilization of €1.4m
Source: GTC
14 | H1 2021 RESULTS |OFFICE FOCUSED DEVELOPMENT PIPELINE
94,900 sq m of class A offices ready to launched in 24 months
CENTER POINT 3, Budapest 35,000 sq m THE TWINS, Budapest 40,000 sq m
MATRIX C, Zagreb 10,700 sq m ABC 3, Sofia 9,200 sq m
Source: GTC
15 | H1 2021 RESULTS |CONTENTS
KEY HIGHLIGHTS H1 2021
PORTFOLIO
DEVELOPMENT PROJECTS
OPERATIONS AND FINANCIALS
ADDITIONAL MATERIALS
16 | H1 2021 RESULTS |INCOME STATEMENT
New completions offset the decrease in operating margin due to disposal of assets and impact
of COVID-19
BREAK DOWN OF OPERATING
(€m) H1 2021 H1 2020 MARGIN (BRIDGE)
Revenue from rental activity 79 79
58.6 (2.0) 2.5 (0.6)
Cost of rental operations (20) (20) 0.3 58.8
Gross margin from operations 1 59 59
G&A expenses w/o share based provision (6) (6)
Profit/(loss) from revaluation of invest.
property
(1) (68)
Gross Sold assets New Covid LFL Gross
Other income/ (expenses) and provisions, margin from completions margin from
net
(1) - operations operation
H1 2020 H1 2021
Profit/(loss) from continuing operations
before tax and finance income / 51 (15)
(expense)
COMMENTS
Foreign exchange differences gain/(loss),
net
- (3)
Finance expenses, net 2 (21) (17) Mostly resulted from an increase in
1
the rental revenues due to
Profit/(loss) before tax 29 (35) acquisitions and completion of new
properties, partially offset by a loss
Taxation (8) 1 in rental and service revenues due
to sale of Spiral and Covid 19
Profit/(loss) for the period 21 (34)
related lockdowns in our shopping
malls.
Adjusted EBITDA 52 52
Profit for the period: One off due to early prepayment of
2
refinanced loans of €4m
Attributable to equity holders of the parent 21 (34)
Attributable to non-controlling interest 0.5 (0.2)
Source: GTC
17 | H1 2021 RESULTS |BALANCE SHEET
(€m) 30 June 2021 31 Dec 2020 COMMENTS
Investment property (excl. right of use) 1 2,111 2,082
1 Mainly due to an investment (€300m)
Residential landbank (excl. right of use) 7 9 mostly into acquisitions and development
partially offset by reclassification of
Right of use 43 44 Serbian office buildings (€270m) to assets
Assets held for sale 2 290 2 held for sale
Property, land and equipment 7 8 Mainly due to reclassification of Serbian
2
office buildings to assets/liabilties held for
Loan granted to non-controlling interest partner 11 11 sale
Cash & cash equivalents and deposits 3 274 310
3 Mainly as a result of refinance of loans
VAT receivable 2 2 and final repayment of bonds (€437),
Other assets acquisition of assets and investment into
23 13
assets under construction (net of loans)
TOTAL ASSETS 2,768 2,481 (€151m), partially offset by the bond issue
(€552m).
Common equity 4 Mainly as a result of bonds issue (€552m),
974 958
new loans related to acquisitions in
Minorities 17 17 Hungary (€132m), drawdown of loans for
projects under construction, partially offset
Short and long term financial debt 4 1,377 1,261 by refinance of loans (€467m) and
Liabilities related to assets held for sale 168 - repayment of bonds (€20m) and
2 reclassification of loans to liabilities related
Derivatives 15 19 to assets held for sale in the amount of
(€146m)
Lease liability 38 43
Provision for deferred tax liabilities 129 133
Other liabilities 50 50
TOTAL EQUITY AND LIABILITIES 2,768 2,481
Source: GTC
18 | H1 2021 RESULTS |STRENGHT OF DEBT METRICS
Confirmed by investment grade ratings of BBB- by Fitch and Ba1 by Moody’s
As of 30 June 2021
KEY CREDIT METRICS DEBT MATURITY
757
€m
Post the disposal of
Serbian assets and 251
planned capital
increase LTV ratio
c. €1.5bn 51.6% will improve
Total debt Net LTV significantly
267
213 500
77
139
3.3x 2.18%¹ 163 116
Annualized interest 86 169
Weighted average 36 128
cover ratio 10 32 16 14 21
interest rate For 12M
26 18 11 6
ended 30 June'22 30 June'23 30 June'24 30 June'25 30 June'26 30 June'27 and
beyond
Loans to be recycled/ Bonds Regular amortization
sale of asset
31 December
(€m) 30 June 2021
2020
DEBT SPLIT
95% fixed Unsecured
Annualized interest cover ratio 3.3x 3.3x
interest rate debt
€725m
or hedged
48%
Net LTV 51.6% 45.2%
Consolidated secured leverage ratio 29% 44%
% Unencumbered properties 35% 9%
Weighted average debt maturity (years) 5.0y 4.2 y
Secured debt
€801m
52%
Source: GTC Note: (1) Excludes loans related to assets held for sale;
19 | H1 2021 RESULTS |CASH FLOW STATEMENT
As of 30 June 2021
COMMENTS
(€m) H1 2021 H1 2020
Operating activities
Operating cash before working capital changes 52 52
1 Composed of expenditure on
Add / deduct: investment properties mainly
Change in working capital - (7) related to acquisition of new
Interest paid, net (21) (16) assets (€204m) and investment
in asset under construction (Pillar,
Tax (6) (3) GTC X and Sofia Tower 2)
Cash flow from operating activities 25 26
Investing activities 2 Reflects mainly the bond issue
(€552), loans related to assets
Investment in real estate and related 1 (245) (45) under construction (€20m) and
Change in deposits 1 6 new loans related to acquisitions
in Hungary (€74m)
Advances for sale (property) 1 -
VAT/CIT on purchase/sale of investments 1 1
Cash flow used in investing activities (242) (38) Related mainly to refinance of
3
loans (€417m), settlement of
maturing bonds (€20m), as well as
Finance activity amortization of existing loans
Proceeds from long term borrowings net of cost 2 686 138 (€12m)
Repayment of long term borrowings/bonds 3 (488) (164)
Cash flow from/(used in) finance activities 198 (26) Cash and cash equivalents include
4
€7m related to assets held for sale
due to Serbian portfolio disposal
Net change (19) (38)
Cash at the beginning of the period 272 180
Cash at the end of the period 4 253 142
Source: GTC
20 | H1 2021 RESULTS |ADDITIONAL MATERIALS 21 | H1 2021 RESULTS |
KEY SHAREHOLDER INFORMATION

  BASIC SHARE INFORMATION               (as of 30 June 2021)                 SHAREHOLDER STRUCTURE
  Symbol                                                   GTC S.A.                                                         GTC Holding Zártkörűen
                                                                                                       Free Float           Működő Részvénytársasá
  Share price                                              PLN 6.70                                     17.58%                      4.51%

  ISIN                                              PLGTC0000037                     Aviva OFE
                                                                                       Aviva
  Performance 12M                                                    2%              Santander
                                                                                       7.77%
  Primary exchange                         Warsaw Stock Exchange                                                                             GTC Dutch
                                                                                  OFE PZU SA                                                Holdings B.V.
                                                                                                                                              61.49%
  Market capitalization(1)                       PLN 3.3bn / €0.7bn               Zlota Jesien
                                                                                     8.65%
  Shares outstanding                                    485.6 million

     SHARE PERFORMANCE 12M                                                   BROKER COVERAGE

 Currency: PLN                                                      mWiG40   Analyst coverage               Target Price (PLN)       Analyst name         Date
 GTC                                                           39%
10,00
                                                                     5 000
 9,00                                                                        Erste Securities Polska         7.93 (Accumulate)     Cezary Bernatek     05/08/21
                                                                     4 500
 8,00                                                                4 000   IPOPEMA                                8.10 (Buy)     Marek Szymański     26/07/21
 7,00                                                          2%
                                                                     3 500
 6,00                                                                        Wood&Company                           7.70 (Buy)      Jakub Caithalm     25/03/21
                                                                     3 000

 5,00                                                                2 500
                                                                             DM BOŚ SA                              6.01 (Sold)    Maciej Wewiórski    06/12/20
 4,00                                                                2 000
                                                                             DM Santander                           7.60 (Hold)        Adrian Kyrcz    03/12/20

                                                                             DM PKO BP                              8.00 (Buy)          Piotr Zybała   28/08/20
                                GTC   mWIG 40
 Source: GTC; stooq.com
 Note: (1) 1 EURO = 4,5208PLN

22                                                | H1 2021 RESULTS |
LEADING COMMERCIAL REAL ESTATE PLATFORM
As of 30 June 2021
BOOK ANNUALISED
GTC PORTFOLIO GLA
# VALUE % IN-PLACE
(€m) RENT (€m)
(ths. sqm) ASSETS LOCATION BY GAV
Income generating Poland
53 2,152 90% 151.6 829 36%
(a+b) Assets for own usePORTFOLIO: INCOME GENERATING PROPERTIES
As of 30 June 2021
POLAND BUDAPEST BELGRADE ZAGREB BUCHAREST SOFIA TOTAL
OFFICE PROJECTS
Number of building 16 9* 11** 3 5 3 47
Total GLA (ths. sq m) 196 167 122 28 67 44 624
Book value (€m) 381 454 267 61 172 96 1,431
Average rent (€/sq m) 14.6 15.1 16.8 14.3 18.6 14.5 15.5
Average occupancy (%) 86% 98% 91% 90% 81% 84% 90%
RETAIL PROJECTS
Number of buildings 2 1 1 1 - 1 6
Total GLA (ths. sq m) 113 6 35 28 - 23 205
Book value (€m) 443 22 91 85 - 81 721
Average rent (€/sq m) 20.9 18.9 21.2 21.5 - 20.9 21.0
Average occupancy (%) 93% 83% 96% 99% - 96% 94%
TOTAL
Number of buildings 18 10 12 4 5 4 53
Total GLA (ths. sq m) 309 173 157 56 67 67 829
Book value (€m) 824 476 357 146 172 177 2,152
Average rent (€/sq m) 17.0 15.2 17.8 18.1 18.6 16.9 16.9
Average occupancy (%) 88% 97% 92% 94% 81% 88% 91%
Source: GTC Note:* Budapest incl. small office building located on plot for future development; **Assets held for sale
24 | H1 2021 RESULTS |PROPERTY OVERVIEW
High quality assets base in Poland and capital cities of CEE
As of 30 June 2021
BOOK GLA RENT
TOP ASSET VALUE ths. €/sqm/ OCCUPANCY
PROPERTIES CLASS COUNTRY CITY €m sqm month %
Galeria
Poland Warsaw 254 65 19.9 92%
Północna
Galeria
Poland Czestochowa 189 49 22.2 94%
Jurajska
City Gate Romania Bucharest 124 48 18.5 78%
Green Heart Serbia Belgrade 106 46 17.1 93%
Ada Mall Serbia Belgrade 91 35 21.2 96%
Center Point I&II Hungary Budapest 89 41 14.2 97% 10 LARGEST
ASSETS CONSTITUTE
Avenue Mall 55% OF GAV OF
Croatia Zagreb 85 28 21.5 99% INCOME GENERATING
Zagreb
PORTFOLIO
Mall of Sofia Bulgaria Sofia 81 23 20.9 96%
Ericsson HQ Hungary Budapest 81 21 15.8 100%
evosoft Hungary
Hungary Budapest 81 21 18.9 100%
HQ
TOTAL 1,181 377
Source: GTC Note: Data for Avenue Mall zagreb excludes Avenue Centre and data for Mall of Sofia excludes Sofia Tower
25 | H1 2021 RESULTS |HIGH QUALITY PROPERTY PORTFOLIO WITH FOCUS ON OFFICES
PRO FORMA FOR DISPOSAL OF SERBIAN PORTFOLIO
As of 30 June 2021
89% of GAV base is recurring income-producing TOTAL PORTFOLIO (BOOK VALUE)
62% of recurring income-producing portfolio is
Budapest
Project under construction €605m
office 4% 28%
Belgrade
€103m
Active development projects and land reserves Projects in pipeline
6%
5%
Sofia
€187m
9%
Landbank (incl.
account for almost 11% of total property(1)(1)portfolio. landbank held for
84% of assets green certified
TOTAL GAV
sale)
1%
Zagreb
€167m
Own use &
others
Own use assets TOTAL GAV
€2,132m 8% €7mPIPELINE OF DEVELOPMENT PROJECTS
10% of portfolio in development projects and land reserve
UNDER CONSTRUCTION PROJECTS
PROJECTS UNDER CONSTRUCTION
KEY METRICS
30 June 31 Dec.
Belgrade
2021 2020 €12m
Office 13%
Gross asset value (€M) 93 63 100%
Lettable area (ths. sqm) 54 37 GAV GAV
€93m Budapest €93m Sofia
€76m
Office segment share 100% 100% €5m
81%
6%
PROJECTS READY TO LAUNCH
KEY METRICS PROJECTS READY TO LAUNCH
30 June 2021
Office
100% Sofia
Gross asset value (€M) 41 €5m
11%
Lettable area (ths. sqm) 95 GAV GAV
€41m €41m
Zagreb
Office segment share 100% Budapest €3m
€34m 7%
81%
Source: GTC
27 | H1 2021 RESULTS |UNIQUE DEVELOPMENT PIPELINE
Unlocking significant embedded value through development projects
As of 30 June 2021
TOTAL EXPECTED REVALUATION EXPECTED
INVESTMENT(1) INVESTMENT 1 IN-PLACE GAIN BOOK DEVELOPMENT
TOTAL GLA COST COST RENT RECOGNIZED VALUE YIELD EXPECTED
CITY (ths. sq m) (€m) (€m) (€m) (€m) (€m) (%) COMPLETION
UNDER CONSTRUCTION
Pillar Budapest 29.0 64.1 83.3 6.1 11.7 75.8 7.3% Q4 2021
Sofia Tower 2 Sofia 8.3 5.2 13.4 1.4 - 5.2 10.4% Q2 2022
GTC X Belgrade 16.8 12.1 35.8 3.5 - 12.1 9.8% Q3 2022
TOTAL 54.1 81.4 132.5 11.0 11.7 93.1
READY TO BE LAUNCHED IN 24 MONTHS²
Center Point 3 Budapest 35.0 18.7 98.6 7.6 - 18.7 7.7% 2023
Matrix C Zagreb 10.7 3.0 21.8 2.0 - 3.0 9.0% Q3 2023
ABC 3 Sofia 9.2 4.7 17.5 1.8 - 4.7 10.3% Q4 2023
Twins Budapest 40.0 14.9 105.0 8.2 - 14.9 7.8% 2024
TOTAL 94.9 41.3 242.9 19.6 - 41.3
149.0 122.7 375.4 30.6 11.7 134.4
PLANNING STAGE
6 PROJECTS 251.3
GRAND TOTAL 400.2
Source: GTC Note: (1) Investment cost includes cost of land, construction cost, marketing cost and cost of finance; (2) All the numbers are preliminary
28 | H1 2021 RESULTS |FUNDS FROM OPERATIONS (FFO I)
Robust acquisitions and developments drive FFO I
As of 30 June 2021
FFO I
€m
70
66 FFO I per share of €0.06
61
Robust operational performance despite impact of
47 COVID-19
42
38
33 31 Significant development pipeline to further boost
28
FFO I
Solid basis for sustainable and long term dividend
policy
2014 2015 2016 2017 2018 2019 2020 H1'20 H1'21
FFO I bridge FFO I / share
€m
€
6.0 0.3 31.4
29.0 (6.4)
1.1 0.3 0.07
0.2 0.9 0.06
Profit before tax Tax paid FV re- Foreign Unpaid financial SBP One-off items* Depreciation FFO H1'20 H1'21
measurement exchange expenses, net and other
differences
Source: GTC Note: * Adjustments due to tax on asset disposals and non recurring financial expenses
29 | H1 2021 RESULTS |NAV
EPRA NAV growth
As of 30 June 2021
EPRA NAV EPRA NAV per share
€m € 2.29 (PLN 10.57) 2.32 (PLN 10.49)
+83% 1,170 1,200
1,112 1,126
1,073
897
779
614
31 Dec 2020 30 June 2021
31 Dec'14 31 Dec'15 31 Dec'16 31 Dec'17 31 Dec'18 31 Dec'19 31 Dec'20 30 June'21
EPRA NAV bridge NAV EPRA growth momentum
€m 137 1,126
991 (17) 974 15
EPRA NAV per share at €2.32 (€2.29 at
31 December 2020)
Strong EPRA NAV uplift since 2014
Total equity Non-controlling Equity Derivatives Def. tax liab. on EPRA NAV
interest attributable to RE assets
equity holders of
the Company
Source: GTC
30 | H1 2021 RESULTS |DEBT AND LTV
(€m) 30 JUNE 2021 31 DECEMBER 2020
Loans and bonds (incl. LHFS) 1,523 1,261
Loans from minorities (9) (9)
Deferred debt expense 11 7
Bank loans and bonds 1,526 1,259
Cash & cash equivalents & deposits 287 310
Net debt 1,239 949
Investment property, assets held for sale
2,434 2,137
and residential landbank
Right of use (43) (44)
Assets for own use 7 7
Net loan to value ratio 51.6% 45%
Weighted average interest rate 2.18%¹ 2.3%
Annualized interest cover ratio 3.3x 3.3x
Source: GTC Note: (1) Excludes loans related to assets held for sale
31 | H1 2021 RESULTS |USEFUL INFORMATION
INVESTOR CONTACT FINANCIAL CALENDAR
GTC consolidated quarterly report -
Małgorzata Czaplicka 16 November 2021
3rd quarter of 2021
Investor Relations Director
T: +48 22 16 60 710
mczaplicka@gtc.com.pl
USEFUL LINKS
Corporate website IR website Corporate governance H1 2021 report
32 | H1 2021 RESULTS |DEFINITIONS
FFO
profit before tax less tax paid, after adjusting for non-cash transactions (such as fair value or real estate
remeasurement, depreciation and amortization share base payment provision and unpaid financial expenses) share
of profit/(loss) of associates and joint ventures and one-off items (such as FX differences and residential activity
and other non-recurring items)
EPRA NAV
are to measure representing the IFRS net assets and calculated as total equity less non-controlling interest,
excluding the derivatives at fair value as well as deferred taxation on property
GROSS ASSET VALUE (GAV)
is investment properties (excluding right of use under land leases), residential landbank, assets held for sale,
building for own use and share on equity investments
NET DEBT
total financial debt net of cash and cash equivalents and deposits and excluding loans from non-controlling interest
and deferred debt issuance costs
33 | H1 2021 RESULTS |DEFINITIONS
NET LOAN TO VALUE RATIO (LTV)
net debt divided by gross asset value. Net loan to value provides a general assessment of financial risk undertaken
AVERAGE COST OF DEBT; WEIGHTED AVERAGE INTEREST RATE
a weighted average interest rate of total debt, as adjusted to reflect the impact of contracted interest rate swaps and
cross-currency swaps by the Group
IN-PLACE RENT
rental income that was in place as of the reports date. It includes headline rent from premises, income from parking
and other rental income
ADJUSTED EBITDA
consolidated profit/(loss) of the Group before taxes, depreciation, amortisation and impairments, non-controlling
interest and share of profit/(loss) of joint ventures, excluding any fair value adjustments, the net result on sale of
financial investments, financial income and/or expenses, foreign exchange gains and/or losses, share-based
payment expenses, acquisition fees, net result on acquisitions and disposals and any other exceptional or non-
recurring item, as determined by reference to the most recent consolidated statement of comprehensive income
set out in the audited annual or unaudited semi-annual financial statements of the Group prepared in accordance
with IFRS or IAS 34, as applicable.
34 | H1 2021 RESULTS |DEFINITIONS
CONSOLIDATED SECURED LEVERAGE RATIO
Secured Consolidated Total Indebtedness divided by Consolidated Total Assets;
UNENCUMBERED PROPERTIES
such amount of the Consolidated Total Properties not pledged as Security Interest for Indebtedness
ANNUALIZED INTEREST COVER RATIO
the aggregate amount of Adjusted EBITDA for the two most recent consecutive semi-annual periods ending on
such Measurement Date divided by the Consolidated Interest Expense for such two semi-annual periods.
WEIGHTED AVERAGE DEBT MATURITY
when applied to any Indebtedness at any date, the number of years obtained by dividing:
(i) the sum of the products obtained by multiplying (a) the amount of each then remaining instalment, sinking fund,
serial maturity or other required payments of principal, including payment at final maturity, in respect of the
Indebtedness, by (b) the number of years (calculated to the nearest one-twelfth) that will elapse between such
date and the making of such payment; by
(ii) the then outstanding principal amounts of such Indebtedness .
35 | H1 2021 RESULTS |DISCLAIMER THIS PRESENTATION IS NOT FOR RELEASE, DIRECTLY OR INDIRECTLY, IN OR INTO THE UNITED STATES OF AMERICA, AUSTRALIA, CANADA OR JAPAN. THIS PRESENTATION IS NOT AN OFFER TO SELL OR THE SOLICITATION OF AN OFFER TO BUY ANY SECURITIES. BY ATTENDING OR VIEWING THIS PRESENTATION, YOU ACKNOWLEDGE AND AGREE TO BE BOUND BY THE FOLLOWING LIMITATIONS AND RESTRICTIONS. This presentation (the ”Presentation”) has been prepared by Globe Trade Centre S.A. (”GTC S.A.”, the “Company”) solely for use by its clients and shareholders or analysts and should not be treated as a part of any an invitation or offer to sell any securities, invest or deal in or a solicitation of an offer to purchase any securities or recommendation to conclude any transaction, in particular with respect to securities of GTC S.A. The information contained in this Presentation is derived from publicly available sources which the Company believes are reliable, but GTC S.A. does not make any representation as to its accuracy or completeness. GTC S.A. shall not be liable for the consequences of any decision made based on information included in this Presentation. The information contained in this Presentation has not been independently verified and is, in any case, subject to changes and modifications. GTC S.A.'s disclosure of the data included in this Presentation is not a breach of law for listed companies, in particular for companies listed on the Warsaw Stock Exchange. The information provided herein was included in current or periodic reports published by GTC S.A. or is additional information that is not required to be reported by the Company as a public company. In no event may the content of this Presentation be construed as any type of explicit or implicit representation or warranty made by GTC S.A. or, its representatives. Likewise, neither GTC S.A. nor any of its representatives shall be liable in any respect whatsoever (whether in negligence or otherwise) for any loss or damage that may arise from the use of this Presentation or of any information contained herein or otherwise arising in connection with this Presentation. The Presentation contains forward-looking statements. All statements other than statements of historical fact included in the Presentation are forward-looking statements. Forward- looking statements give the Company’s current expectations and projections relating to its financial condition, results of operations, plans, objectives, future performance and business. These statements may include, without limitation, any statements preceded by, followed by or including words such as “target,” “believe,” “expect,” “aim,” “intend,” “may,” “anticipate,” “estimate,” “plan,” “project,” “will,” “can have,” “likely,” “should,” “would,” “could” and other words and terms of similar meaning or the negative thereof. Such forward- looking statements involve known and unknown risks, uncertainties and other important factors beyond the Company’s control that could cause the Company’s actual results, performance or achievements to be materially different from the expected results, performance or achievements expressed or implied by such forward-looking statements. Such forward-looking statements are based on numerous assumptions regarding the Company’s present and future business strategies and the environment in which it will operate in the future. The Company makes no representation, warranty or prediction that the factors anticipated in such forward-looking statements will be present, and such forward-looking statements represent, in each case, only one of many possible scenarios and should not be viewed as the most likely or typical scenario. The forward looking statements included in this Presentation does not constitute profit forecast or estimates. GTC S.A. does not undertake to publish any updates, modifications or revisions of the information, data or statements, including any forward‐looking statements, contained herein should there be any change in the strategy or intentions of GTC S.A., or should facts or events occur that affect GTC S.A.'s strategy or intentions, or any change in events, conditions or circumstances on which the forward‐looking statements are based, unless such reporting obligations arises under the applicable laws and regulations. GTC S.A. hereby informs persons viewing this Presentation that the only source of reliable data describing GTC S.A.'s financial results, forecasts, events or indexes are current or periodic reports submitted by GTC S.A. in satisfaction of its disclosure obligation under Polish law. This presentation does not constitute or form part of and should not be construed as, an offer to sell, or the solicitation or invitation of any offer to buy or subscribe for or underwrite or otherwise acquire, any securities of GTC S.A., any holding company or any of its subsidiaries in any jurisdiction or any other person, nor an inducement to enter into any investment activity. In particular, this presentation does not constitute an offer of securities for sale into the United States. No securities of GTC S.A. have been or will be registered under the U.S. Securities Act, or with any securities regulatory authority of any State or other jurisdiction in the United States, and may not be offered or sold within the United States, absent registration or an exemption from, or in a transaction not subject to, the registration requirements of the Securities Act of 1933, as amended, and applicable state laws. The distribution of this presentation and related information may be restricted by law in certain jurisdictions and persons into whose possession any document or other information referred to herein comes should inform themselves about and observe any such restrictions. Any failure to comply with these restrictions may constitute a violation of the securities laws of any such jurisdiction. Note: Due to rounding, numbers presented throughout the Presentation may not add up precisely to the totals provided and percentages may not precisely reflect the absolute figures. 36 | H1 2021 RESULTS |
GLOBE TRADE CENTRE SA
KOR 45 A
Nothus building
02-146 Warsaw
T (22) 16 60 700
F (22) 16 60 705
www.gtc.com.pl

  37
You can also read