Ecological Site Assessment and Monitoring
of Bush Fire Management
A Guide for Landholders
←
→
Page content transcription
If your browser does not render page correctly, please read the page content below
Ecological Site Assessment and Monitoring of Bush Fire Management A Guide for Landholders
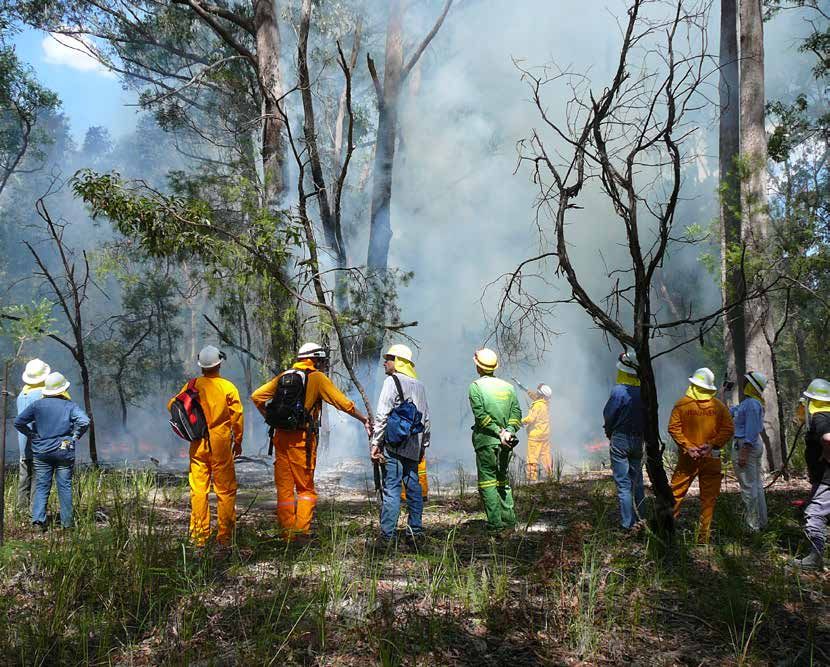
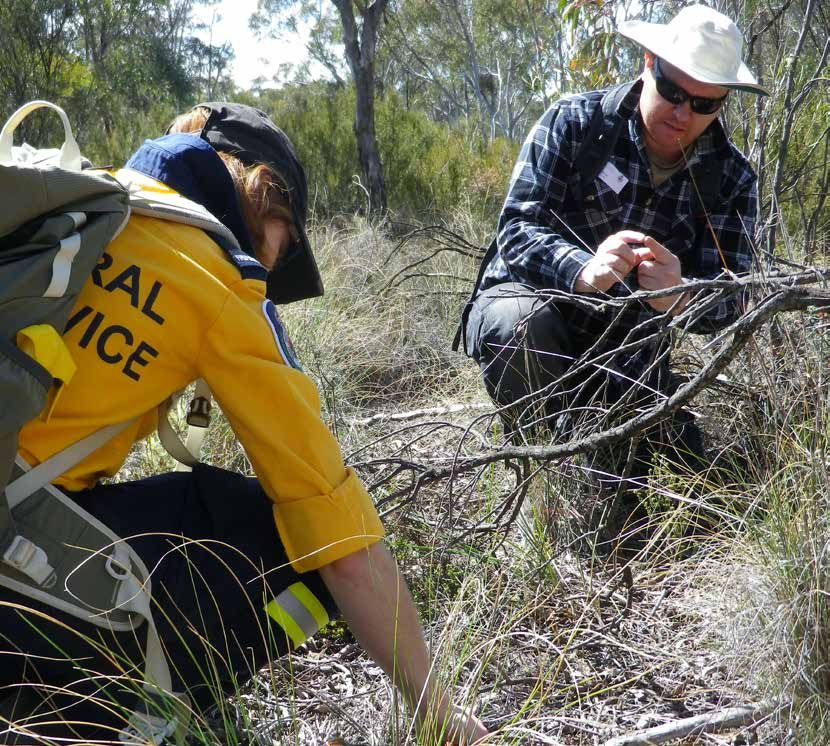
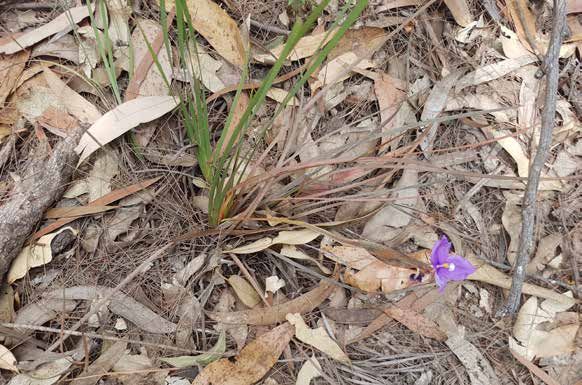
Acknowledgements
The Hotspots Fire Project is jointly delivered by the NSW Rural Fire Service and the Nature
Conservation Council of NSW.

The Hotspots Fire Project acknowledges that the preparation and implementation of this
guide occurs on the traditional lands of Indigenous cultures and that this management has
and continues to shape the landscape we see today.
This guide has been developed for the Hotspots Fire Project community to compliment
the workshops and other written resources available at http://hotspotsfireproject.org.au. A
number of resources were important in guiding the production of this booklet, see references
in Section 8.

Disclaimer
This booklet has been compiled for the Hotspots Fire Project. It serves merely as an aid to planning, and in no way provides any
guarantee of fire safety. Although people living in and working in fire-prone areas or areas with potential for fire can attempt to
minimise risk, a degree of risk will always remain. The information contained herein reflects our understanding at the time of
publication. We are learning more about fire and the environment every day and anticipate that some recommendations may
change as new information comes to hand. Thus whilst every effort has been made to ensure the information presented herein
is as accurate and well-informed as possible, those involved in compiling this booklet take no responsibility for any outcomes,
actions or losses resulting either directly or indirectly from the booklet’s interpretation, misinterpretation or implementation. The
examples provided are not intended to suggest a recommended course of action. Nor is this booklet intended to be used without
the help of experts, good neighbour relations, the experience of the associated Hotspots Fire Project workshops and the tools
provided at those workshops. Readers should also note that the focus of this booklet is on fire management planning, as distinct
from fire response planning. The NSW Rural Fire Service can assist with the latter.

Version 1, June 2018
Front cover image © K. McShea, Hotspots Fire Project. Page 4 Image 1 © J.Cramp, Hotspots
Fire Project. Image 2 © M. Graham, Hotspots Fire Project. Image 3 © Upper Coldstream
Biodiversity Project, Reconyx. Back cover image © L. Andrews, Hotspots Fire Project.
Contents

1. Scope of This Guide                                             4
2. Introduction                                                    5
3. How to Use This Guide                                           7
    3.1 Setting your goals, management objectives and actions      7
    3.2 Monitoring the effectiveness of your actions in reaching   9
    objectives
    3.3 Features and processes to monitor                          11
4. Using Site Assessment and Monitoring Techniques                 13
    4.1 Site location                                              13
    4.2 Photo points                                               14
    4.3 Disturbance history                                        16
    4.4 Establishing a Hotspots monitoring plot                    18
       4.4.1 Vegetation monitoring                                 18
       4.4.2. Weed monitoring                                      23
    4.5 Assessing fuel and monitoring accumulation                 23
    4.6 Habitat values                                             27
5. Approvals                                                       28
6. Monitoring Fauna                                                29
    6.1 Assessments                                                29
    6.2 Spotlighting                                               31
    6.3 Motion sensing camera traps                                32
    6.4 Trapping                                                   34
7. Digital Information, Monitoring Tools & Other                   34
   Resources
8. References                                                      39
9. Appendices                                                      40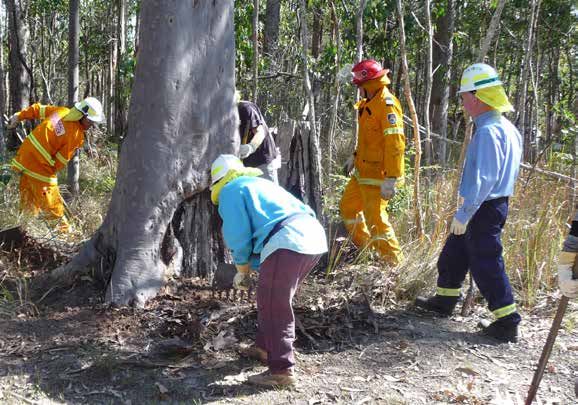
1. Scope of this guide
    A key aim of the Hotspots Fire Project is to increase community understanding, confidence
    and capacity to sustainably manage fire for ecological and Aboriginal cultural outcomes,
    whilst protecting life and property. This publication furthers this aim by assisting landholders
    to follow-up and implement what they have learned at the Hotspots workshops, and to
    understand and evaluate the benefits of any management actions. It is primarily designed
    for use in native vegetation which includes bushland, grassland and wetland areas but many
    techniques can be used in agricultural or other modified landscapes.
    During Hotspots workshops, attendees are provided with an overview of the ecology of their
    area, the recommended fire intervals for different vegetation types on their property, and how
    to measure fuel loads. They are also assisted to develop map-based Property Fire Management
    Plans for their properties, which detail key natural and built assets, their management
    objectives and priority fire management actions.
    By applying the simple site assessment, monitoring and evaluation techniques outlined in this
    guide, landholders can identify changes, refine and update their management plan and actions
    over time. The observation and interpretation of changes to vegetation communities and fuel
    loads can then be incorporated into the Property Fire Management Plan periodically to keep it
    current.

       Vegetation Monitoring               Fire Responses                  Fauna Monitoring

4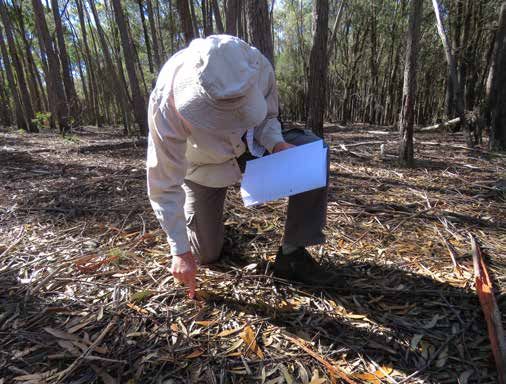
2. Introduction
Many landholders already spend a good deal of time on their land – checking and experiencing
their surroundings, observing how things are changing, learning, and planning. Most say that
it’s all part and parcel of land management.
This Guide provides an introduction to monitoring for non-scientists. It is not intended to
cover the range of methods used by trained scientists. The idea is to see how processes such as
fire shape your bushland by observing how the vegetation, fuel loads and fauna change over
time. It is also an opportunity to learn through experience and informed observation. You
won’t be expected to devise scientific questions and come up with definitive answers. In fact,
you won’t be expected to carry out anything complex or unrealistic in terms of your time, skill,
money, effort and expectations.
These insights can provide a ‘rough guide’, allowing you to link the understanding offered by
rigorous science with the bush you interact with day-to-day. This is the great advantage that
you - the landholder- has. In your day-to-day life you will likely be observing things in your
surroundings far more regularly than a scientist usually would. You may also glean a better
understanding of individual species, plants, animals and patches of bush on your property,
have a greater appreciation of seasonal changes and gain more of a ‘feel’ for how the vegetation
changes over time.
This isn’t to say that a more rigorous style of monitoring cannot be pursued. In some cases,
the expertise and resources may be at hand (e.g. through a landholder partnership with a
university or Landcare network). It’s also possible that a well-designed, low-cost monitoring
program may be able to provide some useful feedback in relation to some management
objectives (e.g. reducing the abundance of a weed species).
In order to effectively assess and manage land it is critical to be able to “read country” using
site assessment techniques to identify what is there, measure trends, formulate objectives, plan
effective management actions, monitor and evaluate the impacts of these management actions
and implement modified actions if necessary. This process is called adaptive management.

Adaptive management
Adaptive management is a feedback loop whereby the results of monitoring influence the
management outcome. It is often advocated in fire and land management practices because
of the uncertainties of fire and our incomplete understanding of its effects. The approach
often involves setting clear management goals, consistently implementing a small number of
‘best bet’ management regimes plus a control, documenting management actions and fires,
monitoring the outcomes, and modifying strategies and practices in light of results. The
approach has shifted the emphasis of monitoring from simply recording changes to comparing
the outcomes of different management regimes.
If valid insights are to be gained, there are some basic scientific ‘must dos’ that need to happen
such as replication, randomisation and interspersion of treatments. If not, it can be easy for
someone to think they have the answer when in fact they haven’t.

                                                                                                     5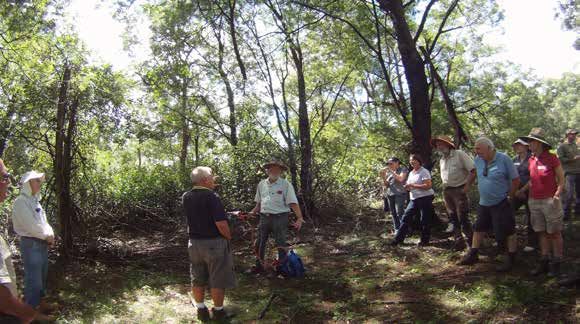
Formal monitoring programs must therefore be carefully designed, consider landscape
    factors, make choices as to what to monitor, and allocate resources for the long haul. Even a
    constrained program can be expensive. This helps to explain why many monitoring projects
    fizzle out or come to an abrupt halt before having found any answers. While this means that
    the kind of monitoring that’s feasible for most landholders will be unable to systematically
    answer complex scientific questions about management effectiveness, this guide aligns to the
    principles of adaptive management to provide a rough indication and includes links to other
    resources. The steps outlined in this guide may also assist landholders to collect data that
    could be useful in a broader scale monitoring program.

     Step                 Description

     Site Assessment      Collect data which provide information relevant to your objectives

     Planning             Identify problems or trends which could significantly affect your
                          objectives as defined in your Fire Management Plan. Develop
                          management actions and monitoring techniques to assess the
                          effectiveness of these actions
     Actions              Implement actions

     Monitor              Collect data to compare with baseline and subsequent surveys

     Evaluate             Evaluate where these values are in relation to your objectives. Evaluate
                          the effectiveness of your actions. Are your objectives still relevant to
                          your overall goal?

     Adjust               Modify your management actions and objectives if necessary

6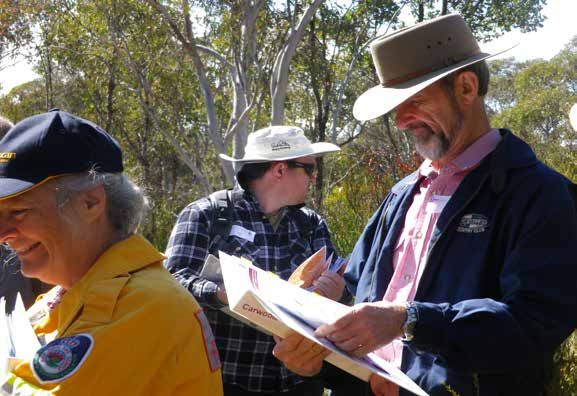
3. How to Use This Guide
During the Hotspots workshop, you prepared a Fire Management Plan for your property which
identified high, medium and low priority fire management actions. You were encouraged to
review your plan on a regular basis and update it as you gain new information and insights.
You can use your plan to keep a record of when fire occurs (planned and unplanned) and
observe what happens to the vegetation on your property following a fire. Recording details of
the weather conditions at the time of the fire and the intensity of the fire, including what layers
of vegetation were burnt as well as whether unburnt areas remain within the fire perimeter, will
allow you to identify the effects of different types of fire on the vegetation.
The practical tools in this guide are designed to help you assess an area; to measure values
and record observations at a particular site, taking a snapshot at a particular time. Monitoring
and evaluating is the act of comparing these snapshots over time, deciding what it means
and coming up with actions to meet management objectives. The records will also enable
you to update your fire management plan and to share your observations with co-managers,
neighbours, your local NSW Rural Fire Service Office or brigade.
Reflection and discussion with others can assist you to interpret the changes you are observing
and draw on that knowledge to inform your decisions about the use of fire in the future.

This guide is divided into 2 main sections:
     • Setting objectives and monitoring effectiveness of your actions (3.1 - 3.3).
     • Site assessment and monitoring techniques for:
           •     Site location including photo points & fire history (4.1 - 4.3)
           •     Vegetation including native vegetation, weeds and fuel (4.4 – 4.6)
           •     Fauna (6.1-6.4).

Additional information including examples are provided for each step.

3.1. Setting your goals, management objectives and actions
Establishing goals: The goals for your property are your overall desired results. These will
guide your objectives and actions to achieve these.
For example:
     • Overall goal: Bush fire risk is mitigated to life and property
     • Overall goal: Biodiversity is protected and enhanced.

                                                                                                      7
Setting objectives: What is it you want to achieve? These may be the objectives you identified
    in your Hotspots Fire Management Plan for your property or management area or you may
    wish to set new objectives. Aim for at least one objective per management area.
    For example:
         • Objective to achieve asset protection: Reduce bush fire risk to life and property in Asset
           Protection Zones (APZ)
         • Objective to protect and enhance biodiversity: Manage for conservation within fire
           thresholds.
    Identifying actions: Setting some measurable and achievable actions will enable you to reach
    your objectives – these can be fixed points or rates, For example:
    Actions to increase asset protection:
         • Develop Bush Fire Survival Plan
         • Establish and maintain APZ using mechanical methods
         • Undertake home maintenance such as clearing gutters
         • Reduce fuel to less than 10 t/ha using mechanical methods or prescribed fire.

    Actions to protect and enhance biodiversity:
         • Assess fire intervals and manage for more appropriate fire regimes (interval, extent,
           patchiness, season)
         • Undertake biodiversity assessment
         • Undertake weed management
         • Reduce lantana - no clumps larger than 1m2.			.

    For a more detailed list of Objectives and Actions refer to the Supplementary Materials section
    of the ‘Workshop 1 - Preparing a fire management plan’.
    Undertake actions: before implementing your actions make sure you do the following:
         • Prioritise and plan your actions to ensure they are as effective as possible
         • Record any necessary observations prior to undertaking planned actions
         • Determine what approvals are required for undertaking mechanical works or
           prescribed burning to achieve your management objectives (see Section 5).

8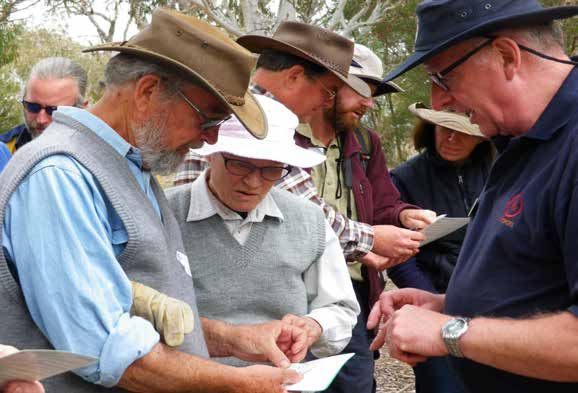
3.2. Monitoring the effectiveness of your actions in reaching
objectives
After you implement a planned fire management action, the next stage is to monitor the
effectiveness of your management actions against your objectives, re-assess objectives, adapt
your management action if necessary and keep monitoring. Refer to Table 1 for examples
of two objectives: 1) Reduce bush fire risk to life and property in APZ, and 2) Maintain or
increase diversity of native plant vegetation.

Table 1. Monitoring objectives

 Objective         Action            Treatment          Measurement             Revised
                                     methods                                    Action

 1) Reduce         Reduce and        Combination        Site assessment:        Monitor - once
 bush fire risk    maintain fuel     of mechanical                              per year
 to life and       load at less      removal or         1/5/2010
 property          than 10 t/ha.     prescribed         Fuel load is 18 t/ha.
 in APZ            in asset          fire (following
 (Management       protection zone   recommended        Initial treatment:
 Area 1)           (Management       fire interval)
                                                        7/6/2010
                   Area 1)
                                                        Fuel load is 5 t/ha.

                                                        2nd assessment:
                                                        Fuel load is 5 t/ha.

                                                        3rd assessment:
                                                        Fuel load is 6 t/ha.

                                                        4th assesment:          Increase
                                                        1/5/2013                frequency of
                                                                                monitoring
                                                        Fuel load is 8 t/ha.    and begin to
                                                                                plan for action
                                                                                to reduce level
                                                                                of fuel

                                                                                                  9
Objective      Action          Treatment        Measurement        Revised Action
                                    methods

     2) Maintain    Manage          Mechanical       Initial            Continue monitoring
     or increase    lantana in      removal and      assessment:
     diversity of   Management      herbicide        No thickets are
     native plant   Area 2 to no    application      present along
     vegetation     clumps larger                    monitoring
                    than 1m2        Consider         transect
                                    use of fire if
                                    appropriate      2nd assessment:    Continue monitoring –
                                                     Individual         spot spray or mechanical
                                                     plants present     removal of plants across
                                                     on transect        site as resources allow

                                                     3rd assessment:    Implement management
                                                                        actions across whole site
                                                     Thickets present   – mechanical removal,
                                                                        spot spray or splatter
                                                                        gun, consider use of fire
                                                                        if appropriate

                                                                        Carwoola workshop © K. McShea

10
3.3 Features and processes to monitor
Below are examples of features and processes to measure and monitor. Establishing baseline
data on these features can then identify processes e.g. dieback. This information then feeds into
your management actions and enables you to assess if the trend is in the direction you need to
achieve objectives.
Feature or Description Assessment and monitoring
Process techniques
(these will be based on
objective and scale)
Vegetation Different fire regimes can result in changes in • Photo points
change: species presence and structure of vegetation
• Vegetation plot monitoring
Are there any Threatened Ecological
Communities (TECs) or threatened flora? • Weed monitoring
Establish baseline values
Observe which species are present and
structure of the vegetation (the vertical and
horizontal distribution of vegetation: its
growth, height, cover, and strata)
Monitor any changes before and after fire
for example. This will assist in assessing
what any changes you may observe mean for
conservation values of the site or fuel hazard
Weed Observe presence and abundance of weed • Photo points
invasion: species
• Vegetation plot
Changes in the ratios and abundance of monitoring
weeds to native species can have an influence
on biosecurity and in some instances fuel • Weed monitoring
hazard
Overall Fuel This guide refers to the detailed method for • Fuel assessment using
Hazard: measuring fuel load and fuel hazard taken ‘Overall Fuel Hazard
from the ‘Overall Fuel Hazard Guide. Third Guide’
edition (1999)’. The approach measures
overall fuel hazard of an area based on
the sum of the influence of bark hazard
+ elevated fuel hazard + surface fine fuel
hazard. The average of values produced using
this method is then added to the recording
sheets.
11Fire Identify the history of fire, both planned • Photo points
Management: or unplanned (wildfire). Recording • Vegetation plot monitoring
the time since fire, intensity, extent,
season and evidence of multiple fires.
Information can come from maps,
written reports, NSW RFS, other
agencies, media, neighbours, oral
histories.
Wildlife Identify the habitat and species values. Simple techniques:
Values: A range of survey techniques are
• Visual assessment of
introduced in this guide including vegetation, habitat, scats &
observation, camera trapping, scat scratches
collection, nocturnal surveys and
trapping. These are divided into simple More detailed techniques &/or
training required:
techniques which require little or no
training and more specialist techniques • Fauna surveys
requiring more training and equipment. • Motion sensing camera
traps
• Pit fall traps etc.
Hollow- Identify hollow-bearing trees. • Photo points
bearing trees: • Vegetation plot monitoring
Feral pest Identify species present and start to • Visual assessment of
species: assess density from scats and signs. vegetation, habitat, scats
This guide introduces techniques for • Fauna surveys
identifying feral species.
• Motion sensing camera traps
Grazing Identify previous or existing pressure on • Visual assessment of
pressures: vegetation and surrounding areas. vegetation, habitat, scats
• Vegetation plot monitoring
• Motion sensing camera traps
Dieback: Identify various forms of dieback • Photo points
including canopy, Bell Miner Associated • Vegetation plot monitoring
Dieback (BMAD), psyllid, drought
induced, exotic rust fungus or other.
‘ I knew a lot already about my property but following the
Hotspots workshop I was surprised just how much I learned
through regular monitoring and recording what I’m seeing.
’
- Workshop participant
124. Using Site Assessment and
Monitoring Techniques
The next steps walk you through the ‘Hotspots Site Assessment and Monitoring Sheet*’. This
can be used to establish baseline data e.g. pre-burn and for follow-up monitoring.
A blank recording sheet for your use is provided in Appendix 1. A description of
each of the steps is below. This document is also available on the Hotspots website:
http://hotspotsfireproject.org.au/ecological-resources.
4.1. Site location
It is important to record as precisely as possible the location and date when you are assessing
an area. The property or street address should be recorded as well as mapping co-ordinates
from a topographic map, a Global Positioning System (GPS) device or smart phone.
The location of your sites should assist you in answering your monitoring question(s). To
limit bias it is important to select sites which are representative of the whole location and
homogenous i.e. attempt to minimise the variation within each of your locations. By selecting
multiple sites and being systematic in your monitoring you can limit any bias in your site
selection.
Property details: start by adding you name, address and any information you can about the
landscape you are assessing.
PROPERTY DETAILS:
Property Owner/
John Citizen
Recorder
Location Street address 100 Waterfall Way, Fernbrook
Information
Lot/DP 25/7561123
Landscape Local Government Association, Bioregion, catchment etc.
Bellingen Shire Council, Bellinger River, North Coast Bioregion
Site details: add the Management Area identified in your Hotspots property fire management
plan, and the details of the plot. There is space to add information on photo-point records (ID,
location stored and how the spot is identified), see next section for details.
*Based on vegetation condition survey proforma in Eco Logical Australia (2009) Riverine Vegetation in the Namoi
Catchment. An Assessment of type and condition Final Report prepared for: Cotton Catchment Communities CRC
Namoi Catchment Management Authority. Eco logical Coffs Harbour.
13SITE DETAILS:
Management Area Area 1 – Asset Protection Date 01/01/2018
Plot Location GPS/ map co-ordinates: Decimal Degrees Lat -33.8 Long
151.2 or UTM 56 H 334202 625018
Aspect 90 Slope 8 Soil/geology Sandy loam over Silurian aged
metasediments
Photo ID and IMG 207 8.30 am 1/1/18 Fire management plan folder on Johns
where stored laptop
Record details if site is permanently marked e.g. (post or stump etc.) Star picket at
track intersection
4.2. Photo points
Photos can provide a visual representation of vegetation changes over time, especially when
photos taken from the same location are compared across time. This comparison should
be one of the first steps in establishing a point of
reference to detect trends, identify threats, plan and
guide management actions and design a monitoring Useful equipment
and evaluation regime.
Photos can be used prior to and following a burn • Stake or star pickets to
to assess site biodiversity, changes in vegetation permanently identify each
structure, the presence and extent of weeds and photo point
also changes in fuel loads over time. Photo points • Camera
can be used in conjunction with other monitoring • Compass
techniques such as vegetation transect plot data (see • GPS
next section). • Notebook or recording sheet
The important thing about photo points is
consistency. By writing down exactly what you do
for the first photo and doing the same thing for any subsequent photos, you can easily compare
the differences and similarities between them. By having clear instructions and using the same
data sheet, different people can take an accurate photo even if they didn’t take the original
photo.
Selecting locations
Here are a few tips to help select the location for your photo point:
• Choose a site that is easy to get to in wet or dry conditions and which looks over a
wide area of your site
14• You will get a better result if the photo faces south as the sun is usually behind you,
however this is not always possible. Overcast days are best as this reduces the shadows
and contrast and allows the best image
• Permanently mark the exact spot where you are standing with a post or star picket
so you or someone else can take the next photo from that exact spot or include the
post in the photo as a reference point for future comparisons. Attaching a small sign
with the plot number, compass bearing and date for each photo is helpful. Repaint the
star picket after fire to prevent rusting. A fluorescence colour is useful for relocating
the post as vegetation grows
• Try to select some identifying features in the image that will remain consistent over
time such as fence lines, rocks or logs, and include these in the image each time
• Try not to pick a location where plants will grow and obscure the camera.
Other photo options
You may wish to take more than one photo at each photo point. Additional photos should
reflect what it is you want to know about your plot. For example you might take photos of
the ground, shrub and tree layer. Or you may wish to take photos facing in more than one
direction. If you do this, ensure you record the multiple locations (compass bearings/GPS).
Recommended intervals for photo records
Intervals may vary depending on the situation and the vegetation type but the aim is
to capture changes as they occur. It is recommended that you take photos before and
immediately after a burn, then one, three, six and twelve months after the burn, and then
annually for four to seven years. Keep in mind that taking photos in August and September
can help make a number of species visible because of flowering.
An example photo point recording sheet is provided in Appendix 3.
Example Grassy Woodland with fire frequency too high, too low and within thresholds © P. Watson, Hotspots Fire Project
15Vegetation: add as much detail as you can on the Keith Formation and Class if known, the
canopy species in order of dominance and the condition of the vegetation.
Keith Formation and Class if known: At the Hotspots workshops you were assisted with
identifying the vegetation types on your property. If you need further assistance the following
may be helpful:
• Local Landcare officer
• Council environment staff
• Local Land Services
• Local vegetation expert
• David Keith book: ‘Ocean Shores to Desert Dunes: The Native Vegetation of New
South Wales and the ACT’ (2004).
A summarised description of each formation can be found in your landholder booklet or you
can access the booklets via the Hotspots website: www.hotspotsfireproject.org.au/ecological-
resources.
Canopy Species in order of dominance: Refer to Ocean Shores to Desert Dunes and further
resources in Section 7.
Condition: How is the site looking? Record any current or past impacts of disturbance, visual
evidence of dieback, weeds or signs of condition. More details can be recorded for disturbance
below.
Vegetation Keith Formation and Class if known North Coast shrubby Wet
Sclerophyll Forest, North Coast Wet Sclerophyll Forest
Canopy Species in order of dominance
Spotted gum, brush box, tallowwood
4.3 Disturbance history
The history of the site including fire, grazing, weeds etc. is important in understanding the
condition of the site and how the site might respond to your management actions.
Fire: The fire history for your property is important information for guiding decisions
regarding planned burns as well as how you might respond to unplanned fire (wildfire).
Are there signs which may tell you about the fire history of the site? These include the
presence or absence of the following:
• Height and amount of charring on rough-barked tree trunks,
16• Hollows in tree trunks or branches
• Woody debris on the ground
• Secondary growth (resprouting around the base or along branches and trunks of trees
or shrubs)
• Shrub layer (in some vegetation types presence or absence of a shrub layer may
indicate a lack of fire and senescing vegetation)
• Ground layer vegetation dominated by fire tolerant species such as bracken or blady
grass may be an indication of frequent fire.
DISTURBANCE HISTORY:
Fire Severity, date of last event, evidence (known or estimated)
Hot fire – canopy burnt – charring – Estimated 10 years
Logging/ Clearing Numerous stumps – over 10 years old
Grazing Stock, native, feral, severity, time
Heavily grazed - sheep present, kangaroo/wombat scats
common throughout site
Significant Weeds
(WONS or Blackberry in small thickets around 2m wide
Biosecurity listed)
Other e.g. Bell Miner Associated Dieback (BMAD)
Other disturbance:
Logging/Clearing: Is there evidence of clearing for example tree stands all the same age,
stumps, gaps in the canopy or logging tracks etc.
Grazing: Is there evidence of grazed vegetation, stock manure or soil compaction? Is there
evidence of soil erosion?
There is also a distinction between grazing by stock and grazing by native herbivores - new
growth in a small burn area with a large edge effect will have the potential to be heavily grazed
by wallabies, rabbits, possums etc. Depending on how fragmented the patch is, it could be a
significant management consideration.
Are there other scats present? More details on fauna monitoring is provided in Section 6.
Invasive Weeds - Does the site contain, or is it under threat from any Weeds of National
Significance (WONS) or listed on the NSW Biosecurity Act 2015. Depending on your
monitoring objective you can list all weed species present or just the dominant/ target weed
species, you can record weeds collectively (presence/absence) or weed groups (e.g. forbs, vines,
grasses, succulent, woody).
17Other? Is there dieback? Is there evidence of bell miners or Bell Miner Associated Dieback
(BMAD)? Are there other forms of dieback including drought-induced dieback, myrtle-rust
(Puccinia psidii) or root-rot fungus (Phytophthora cinnamomi)?
For a case study on managing fire and weeds in a BMAD affected landscape, refer to
Appendix 5.
Refer to Section 7 for resources which may be helpful in identification and possible treatments.
It is recommended you consult your Local Land Services for additional support: www.dpi.nsw.
gov.au/biosecurity/plant.
4.4 Establishing a Hotspots monitoring plot
The next section walks you through the Hotspots data sheet for site assessments, the process of
creating a monitoring plot, as used by the Hotspots team, undertaking a fuel assessment and
recording habitat values.
Monitoring can help to answer questions about Useful equipment
the responses of vegetation, particular plant
species and individual plants to fire. We can look • Compass
at whether or not the management objectives are • GPS
being met, be alerted to responses that were not • 50m measuring tape
expected, and track vegetation changes over time. • 1m x 1m square quadrat
Scientists and land managers have come up with • Plant identification guide books
many ways to record vegetation characteristics. • Notebook or recording sheet
The simplest, and most commonly used are:
• Presence/absence – whether or not particular species are present;
• Abundance (or density) – the number of plants individuals in the given area; and
• Cover – the degree to which vegetation shades or covers the ground.
There are a number of field guides and resources available which may assist you in identifying
the plants on your property, see Section 7.
4.4.1 Vegetation monitoring
Often it is not possible to record vegetation characteristics and other information for an entire
site, so one or more representative samples (plots) are chosen.
Whether you complete all of the steps and the level of detail you add will depend on the
monitoring objectives and management actions you have set. For example if you are assessing
the regeneration responses to a controlled burn, or the diversity of species on your property,
you may find it useful to complete all the assessment steps. If however, you are focusing on the
response of a particular weed infestation to your management actions, then you may not need
to complete all the steps.
18Vegetation Structure Some types of forests have several layers or strata. These are generalised as the canopy, understorey and ground (see Figure 1). These three strata are not always present and sometimes there are several mid strata and canopies may have emergent trees. Tallest stratum - Canopy: The cover of vegetation which would be seen from the air. Mid stratum - Midstorey: Cover of shrubs and small trees > 1m. Lower stratum - Ground cover: Normally comprises low shrubs, grasses, forbs, rushes and sedges,
BASE PLOT (20 X 50):
      No of canopy    Mature    Regrowth
      species         5 mature canopy species, 3 are regenerating
     No of trees with        10 trees with hollows
     hollows
     Length of dead          Diameter > 10cm and length >50cm
     fallen timber           210 meters (total length of fallen timber)

     No. of canopy species: Within your plot record the number of different species in the canopy
     and if the vegetation is mature and regenerating.

     No. of trees with hollows: Record how many of the trees have hollows. You can also record
     more detail on the size and opening in the habitat section.

     Length of dead fallen timber: Record the combined length.

     Establish your subplots

     Subplot (20 x 20 m): this is a smaller plot within your base plot. Run the tape measure to
     establish your subplot and record the following:

     SUBPLOT (20 X 20):
      No of native shrubs and small trees >1m                            7

     No of native ground cover species                                   23

     Record the Foliage Projective Cover (FPC)

     2.5 m radius around points along transect: record the foliage cover (percentage of the
     sample site occupied by the vertical projection of foliage) at a 2.5 m radius around points
     along the transect at 5 m intervals (For smaller sites a lower number of points could be used to
     calculate an average). Use Figures 2 & 3 to assist.

     Native canopy: record the projected foliage cover (%) for native species in the canopy (tallest
     stratum).

     Native midstorey: record the projected foliage cover (%) for native species in the midstorey

     Weeds canopy & midstorey: record the projected foliage cover (%) for weeds in the canopy
     and midstorey.

20
Figure. 2. Crown types (Walker & Hopkins, 1984)
2.5 M RADIUS AROUND POINTS ALONG TRANSECT:
Projected Foliage Cover (%) P1 P2 P3 P4 P5 P6 P7 P8 P9 P10
Native Canopy 35 40 15 10 5 20 15 25 25 40
Native midstorey 10 5 20 60 40 10 10 10 30 5
Weeds canopy & midstorey 5 10 5 10 5 0 0 10 0 10
Percentage foliage cover (FPC) of tallest plant layer
Life form and Dense Mid-dense Sparse Very sparse
height of tallest
stratum (70-100%) (30-70%) (10-30%) ( 30 m Tall closed-forest Tall open-forest Tall woodland Tall open-
woodland
Trees 10-30 m Closed-forest Open -forest Woodland Open-woodland
Trees 5-10 m Low closed- Low open-forest Low woodland Low open-
forest woodland
Shrubs 2-8 m Closed -scrub Open-scrub Tall shrubland Tall open-
shrubland
Shrubs 0-2 m Closed -heath Open-heath Low shrubland Low open-
shrubland
Firgure 3. Structural forms of vegetation in Australia (based on Specht, 1970)
21Ground Cover
Quadrats (1 x 1 m) along transect: Record the percentage cover of the following within ten
1x1 m quadrats, along the length of the transect expressed as a percentage to the nearest 5%.
The five individual scores should add up to 100%.
You may find it helpful to make a square frame (1m x 1m quadrat) to record the ground cover
results.
QUADRATS (1 X 1 M) ALONG TRANSECT:
Ground Cover % Q1 Q2 Q3 Q4 Q5 Q6 Q7 Q8 Q9 Q10
Native ground 20 10 50 50 60 30 60 20 40 10
cover
Weeds 5 5 10 0 0 10 0 5 0 60
Moss & lichens 0 0 5 5 10 0 5 0 5 0
Organic litter 70 80 35 35 30 30 35 75 55 30
Rock/ bare ground 5 5 0 10 0 30 0 0 0 0
Total (%) 100 100 100 100 100 100 100 100 100 100
Figure 4. Example image of ground cover © K. Taylor.
224.2. Weed monitoring
The recording sheet can be used to monitor weeds by recording abundance scores for either:
• Individual weed species (i.e. list all weed species present – or just dominant or target
weed species);
• Weeds collectively (i.e. instead of listing weed species, just record ‘weeds’); and
• Weed groups (i.e. instead of listing weed species, record group type e.g. forbs, vines,
grasses, succulent, woody).
If your objective is undertaking long term weed control you can assess your actions over time
by using weed mapping and comparing photos over time.
Refer to your relevant Regional Strategic Weed Management Plan to identify if any actions are
required under the NSW Biosecurity Act 2015 and if listed priority species are found:
www.lls.nsw.gov.au/biosecurity/weed-control.
Section 7 has some additional resources which may be helpful.
4.5. Assessing fuel and monitoring accumulation
Vegetation, both live and dead provides fuel for fire. In a fire prone landscape it is important to
be aware of the amount and arrangement of available fuel that contributes to different effects
of fire behaviour including the flame height and depth, intensity, rate of spread, and embers
which can produce spot fires. In the workshops you practiced assessing fuel using the Overall
Fuel Hazard Guide (cite 3rd Ed, Vic).
By using the techniques presented in the Overall Fuel Hazard Guide and observing the fuel
characteristics, you can learn to recognise changes in fuel loads and reduce the risk of a high
intensity fire through a controlled burn, or other means.
To assess fuel load you will need to look at the following components:
• Fuel types
• Fuel Characteristics
• Fuel layers
Fuel types
Generally fuels can be described as fine or coarse.
• Fine fuels (generallyDifferences in forest and grass fuel types:
The Overall Fuel Hazard Guide assists the user to identify and assess fuel hazards in forested
areas. Grassland is assessed differently to forest fires as these fires behave differently. Grass
fires can spread three times faster than a bush fire and their spread is more influenced by
wind. A key element of monitoring grassland fire danger and potential fire behaviour is to
estimate the level of drying or curing. The percentage of grassland cured can be observed
based on colour and other physiological characteristics such as the growth, maturation and
seed dropping stages. The level of curing can significantly affect the ignition potential and
spreading characteristic of a fire.
Refer to the ‘Country Fire Authority Grassland Curing Guide (1999)’ for more information.
Fuel characteristics
There are many fuel characteristics that contribute to fire behaviour. These include:
• fuel load (amount)
• the size, shape and density of the foliage within the plant
• arrangement of fuel both horizontally and vertically (separation between plants and
between the ground and branches)
• the moisture content (of the foliage, litter, soil and surrounding area)
• other chemical properties such as oil content
When planning your prescribed burn, observe the fuel characteristics at your site and consider
how they could contribute to the available fuel load and how this could influence the way a
fire might burn.
If the fine fuels are continuous from the ground to the canopy then there may be a greater risk
that any fire may reach the canopy.
Where there is good physical vertical separation between elevated shrubs and surface or low
shrub/grass understorey vegetation then the chances of flames reaching the canopy will be
reduced.
If the understorey vegetation is sparse, it may not sustain flames readily and a fire will
have difficulty moving through a landscape in both a vertical or horizontal capacity under
controlled conditions.
Similarly, broad and fleshy foliage will unlikely carry a fire as readly as fine, dry or oil rich
foliage.
Remember that other factors can have an effect on your fuels and fire behaviour. For
example the weather, site characteristics such as slope and aspect, or presence of weeds
can influence the flammability of vegetation.
24Fuel layers
The key components of vegetation contributing to the overall fuel hazard include:
• surface fuel (including grasses, other vegetation, and some dead material low to the
ground as well as leaves and twigs on the ground)
• elevated fuel (shrubs and small trees which may be under a main canopy)
• bark fuel (rough, stringy or ribbon bark on tree trunks and branches).
Tips for assessing fuel hazard
• Use the methods described in the Overall Fuel Hazard Guide, which was provided
to you in your workshop. Record the fuel hazard levels for each vegetation layer,
at surface, elevated shrub layer, and bark using the fuel assessment form provided in
Appendix 2. A completed example fuel assessment sheet follows.
• Fuel should be assessed and measured both before and after a fire where possible. It
is recommended that you take more than one fuel measurement across the site. You
can use your photo point sites or quadrat locations for consistency. If the site you
propose to burn is on a slope, aim to take fuel measurements from the top, middle
and bottom of the slope.
• As described during your workshops, having some knowledge of the fire history and
the type of fire (planned or wildfire) may help you verify your observatios and
determine the time since the last fire.
• Avoid taking fuel measurements on the edges of your area such as tracks or trails, and
immediately after rainy conditions.
XXXX Desctiption
© K. Taylor, Hotspots Fire Project.
Measuring fuel at Nerriga Hotspots Workshop © K. McShea
25Management Area: Management Area 1 Date of sample: 1/5/2010
Burn Name/ ID: Oaky Gully burn
Sample location details: plot location -33.8, 151.2 Easterly aspect,Fuel load: Record the fuel load on your recording sheet.
FUEL LOAD:
Overall Fuel Hazard t/ha. 18 Comments: fairly uniform across site.
4.6. Habitat values
Habitat values: record the features in the plot which provide specific habitat including:
• Record the feeding and sheltering resources which are available for birds and other
wildlife, for example hollows, mistletoe, fruiting shrubs, trees and grass.
• Logs are also an important habitat in a healthy environment. They provide shelter
for some animals as well as food for fungi and insects. This, in turn, provides food for
other animals.
Identify hollow-bearing and mature trees including den and feed trees. You can also include
additional details regarding the types of hollows such as size, if the entrance is exposed to rain
or wind, or if they are susceptible to fire, and include potential fire entry points.
This information may lead you to record specific actions to protect the tree or log e.g. rake
away leaf litter from base.
HABITAT VALUES:
Feed trees, hollow logs, rock outcrops, nests etc. Large mature yellow box – nectar
resource; large hollow log, rocky overhang; 3 hollow
Refer to the Monitoring to Protect Hollow-Bearing Trees case study in Appendix 7 for
more details.
Logs and woody debris are important
habitat and studies have shown that
wildlife prefer unburnt logs to burnt
ones (Croft et al., 2010). Cool burns
which remove the fine surface fuels
and avoid burning larger material is
recommended.
Habitat values © K. Taylor
275. Approvals
Fire can be a useful management tool for reducing bush fire hazards, assisting in the
regeneration of some plants or conducting agricultural activities. However, the inappropriate
use of fire can endanger lives, property and the environment. Your observational skills
may help you decide where and when it may be appropriate to apply fire. You may need
an environmental approval and a Fire Permit before you undertake any works. The type of
environmental approval will depend on the purpose of your burn.
The NSW Rural Fire Service have produced a guide titled Before you light that fire which
outlines steps you need to take before lighting a fire. View online at:
www.rfs.nsw.gov.au/__data/assets/pdf_file/0013/12451/BeforeYouLightThatFire.pdf.
If your burn is for bush fire hazard reduction or has the dual purpose of achieving bush fire
hazard reduction and ecological outcomes, then a bush fire hazard reduction certificate may
be issued for the environmental approval of the works. These are issued free of charge by staff
at your local NSW RFS Fire Control Centre.
Contact your local NSW RFS Office to apply for a Hazard Reduction Certificate or for further
advice on measurement options and appropriate burn prescriptions.
Using the McArthur Meter to predict fire behaviour, Cawoola Workshop © J. Cramp
286. Monitoring fauna
6.1. Assessments
There are a number of methods that can be used to assess and monitor native fauna at a
particular site. Spotlighting, hair tubes, pit fall traps and harp traps are just a few of the
techniques used to identify a species presence and population conditions. However many
tend to be invasive and/or modify the behaviour of the target species. Two commonly used
non-invasive visual survey methods include wildlife surveillance with a torch at dusk/night
(spotlighting) and cameras that detect motion under a range of conditions (camera traps).
Both of these are discussed in more detail below.
The appropriateness of each of these will depend on your monitoring objective and/or specific
questions you want to answer. Fauna monitoring can be used to assess and monitor changes in
biodiversity, habitat use/preference for specific trees etc. and response to management actions
e.g. feral animal control.
There are two broad levels of fauna assessment:
• Simple visual assessments: This includes opportunistic sightings and searching for
scats, scratches, diggings, feathers or other evidence of fauna species. This can be done
whenever you are in the field and doesn’t require a lot of training or licencing.
• Fauna surveys: This includes wildlife surveillance using cameras, sound recording,
trapping animals using Elliott and pit fall traps etc. This is more complicated but
will yield more comprehensive results. Specific training and licensing is often involved
if the techniques used involve: regularly catching or handling wildlife, have the
potential to impact on Threatened species, or are carried out in a systematic basis
which could affect behaviour. Approval may be required under the NSW Biodiversity
Conservation Act 2016 or the NSW Animal Research Act 1985.
If you do not have the skills or approvals for the level of monitoring you wish to use you
may be able to get assistance from your local University, Local Land Services or Office of
Environment and Heritage. Refer to the OEH website for information on licencing.
http://www.environment.nsw.gov.au/licences-and-permits/scientific-licences.
Simple visual assessments*
Useful equipment
Taking the opportunistic sighting of fauna while going
about your day to day a step further can provide more
• Binoculars
detailed knowledge on the activity of species as well as
• Spotlight
assist in detecting more elusive and/or nocturnal fauna.
• Notebook or recording sheet
Sitting quietly on your property, perhaps by a creek or • Headtorch
waterhole allows birds, mammals and invertebrates • Camera
to get used to your presence and resume their normal • Self-sealing bag for
activities. droppings, hair, feathers etc.
• Identification guide books
*Adapted from the Office of Environment and Heritage Watching and Surveying Wildlife document, see Section 8.
29Scats and trails
The footprints and markings left in a soft surface as an animal moves over it can be used to
identify which species are in the area. This can be particularly useful for reptiles or small
nocturnal or secretive animals as well as feral species such as cats and foxes.
Clean, soft, damp, sandy areas such as near creeks or water can often yield the best tracks and
trails as the imprints are clean and will last. You can also create your own ‘sand pad’ with fine-
grained material such as yellow brick-layers sand, directly to an area likely to be used by fauna.
Ensure the sand is certified free of weeds, lightly water to create a firm, damp consistency and
smooth over the surface.
A single sand pad may get some footprints, but a number of pads will provide more coverage.
For a more comprehensive survey, the distance between sand pads will depend on the species
targeted and the size of the area being surveyed. For small lizards and small mammals (e.g.
phascogales, dunnarts or rodents), sand plots can be as close as 50 metres. For medium-sized
mammals (e.g. quolls, bandicoots, bettongs), and as a general purpose survey, 200 metres is a
better distance (Watching & surveying wildlife, Office of Environment and Heritage).
Scratches: the distinct scratching or feeding scars on trees indicates the presence of possums,
gliders or koalas.
Scats: the faecal pellets of carnivores can reveal the identity of the animal and its diet including
prey. Droppings of herbivores are generally characteristic for a particular species. Possum and
koala pellets smell strongly of eucalyptus leaves when broken, and can be differentiated by
size, shape and colour.
Tips for finding fauna
Birds: Most birds are active during the day particularly morning and evening and have
distinctive calls. It can take time to learn the calls of particular species but there are many
guide books and audio resources available to assist. Nests can often be seen in trees and
shrubs, and ‘whitewash’ is often seen under branches where birds roost at night. Small bundles
of fur and bones around the base of large trees signal that owls are roosting above.
Mammals: Most native mammals are elusive
and nocturnal, so direct observation requires
after-hours work. However, kangaroos, wallabies
and echidnas are often seen during the day.
Microbats, with their rapid darting flight, are
easy to spot against the sky at dusk or around an
outside light. An area with a reasonable amount
of natural habitat may support many species,
but, without capture or specialised equipment
to analyse their calls, most are impossible to
identify. However, some species, such as the
white-striped free tailed bat (Austronomus
australis), have calls which are audible to the
human ear. White-eared honeyeater © J. Cramp
30Reptiles, amphibians and invertebrates: Reptiles and invertebrates (such as insects, spiders
and snails) can be found by carefully turning over rocks, fallen timber or litter on the ground.
Timber and rocks should always be replaced as they were.
Reptiles can be observed in the heat of the day, often basking in the sun on logs and rocks.
Goannas are often seen during hot weather running up a nearby tree when disturbed.
Frogs are most active at night after rain, though can be difficult to see. They are often identified
by calls, but can also be seen while spotlighting.
Insects are about in greater number and variety in the warmer months, and are often
associated with the flowering of plants. Increased insect numbers also increase the chance of
seeing the insectivorous birds and mammals which feed on them.
Rain after a dry spell will often bring wildlife out of hiding, so this is a good time to look.
6.2. Spotlighting
The activity of searching for nocturnal wildlife, such as owls, possums, gliders and
invertebrates using a torch, called ‘spotlighting’ is a simple and inexpensive way of having a
look at what is on your property. An occasional search should not impact on wildlife but if
you wish to do more regular searches refer to the OEH website for information on licencing.
https://www.environment.nsw.gov.au/licences-and-permits/scientific-licences.
Spotlighting at night can be done from a
vehicle or on foot and involves holding a torch
or spotlight at eye height and looking along
the beam. The beam is moved slowly over the
ground, shrubs and trees, looking for eye-shine.
This is the reflection of light from the animal’s
retina and can be easily picked up with practice.
Binoculars can be used to identify an animal
once its eye-shine is detected. It is also important
to occasionally turn off the lights and motor, and
to listen to the night sounds, such as those of
frogs, possums or owls.
Although a lot of it is down to luck, being quiet Powerful Owl © K. Taylor
and patient is critical.
Stag watching is a technique that can also be useful which involves watching and listening for
nocturnal wildlife which are leaving their den or roost sites. Target trees with hollows for 30
minutes before and after sunset.
Refer to Section 7 for a list of additional resources and field guides which may be useful.
316.3 Motion sensing camera traps
Camera types:
Remote motion sensing cameras are an effective and efficient survey tool that can provide
largely non-invasive visual and auditory records of species and natural behaviours. Data can
be collected over a long period of time with minimal labour requirements.
There are many types of wildlife monitoring cameras available. Determining the correct one
for your needs can be difficult as they all have a range of pros and cons that might make them
more or less suitable for particular species or survey outcomes. Consideration must be given
to unit cost, maintenance needs, battery life, USB connectivity, image quality, still photograph
or continuous recording and other features.
In some cases, models are designed to be left active without the need for maintenance for very
long periods of time (many months to a year). Some of these have solar panels as options to
minimise or replace the need for batteries, and immediate wireless image transfer to a central
location so that physical interaction with each camera is not required to download images.
Some can also stream live continuous recording via a webcam to a chosen website.
As many of the more interesting or rarer species are small, fast-moving nocturnal animals,
the cameras need to have a fast trigger, hidden flash (fully covert), and possibly the ability to
capture images in bursts.
The ability to record footage and even sound can be an advantage. Many are economical
enough that their batteries may last for a year before needing to be changed or recharged.
Other benefits
Wildlife cameras have practical benefits for farm management and planning, especially in
pest animal control methods and targeting. Use of predator sightings (i.e. foxes) will inform
vermin control, fox baiting programs, den fumigation, ripping, spot lighting and other
eradication methods to assist in determining effectiveness of current controls.
Equipment
For a simple set up, you will need:
• Motion-sensing camera (there are many models and prices range fromCamera trap Image from NCC Upper Coldstream Biodiversity Project © RECONYX
Cameras should be left for at least one week to allow animals to become accustomed to them.
Try to identify an area that animals travel through by looking for tunnels or animal tracks
through the undergrowth. Position the camera so that it has a clear view of this area.
Viewing images
After the camera has been on site for at least a week (2-3 weeks is preferable), it can be taken
down and the SD card removed. Instructions for this will vary depending on the type of
camera used. The SD card can be inserted into a computer with an SD card slot, or a portable
card reader, in the same way any digital image can be viewed.
Image identification
Many of the images on the camera may be easy to identify as they will be common animals
such as possums, foxes or wallabies. If you find an image that you can’t identify, you can
contact the Australian Museum, Office of Environment and Heritage, Local Council office,
Local Land Services or there are a range of web based groups and online identification keys
(see Section 7).
There will be a number of images where no animal appears. This is normal, and is because of
a false trigger (something activating the motion sensor such as on a windy day), or the animal
that triggered the motion sensor was particularly fast and already moved out of sight before the
image was taken.
An example fauna camera data recording sheet is provided in Appendix 4.
Refer to the Adaptive Management case study which looks at management actions where
Wildlife Monitoring Techniques have detecting threatened species in Appendix 8.
336.4. Trapping
Any surveys which include trapping to target native wildlife require approval under the NSW
Biodiversity Conservation Act 2016 and the NSW Animal Research Act 1985.
SCIENTIFIC LICENCE AND ANIMAL ETHICS CONSIDERATIONS
Extensive use of cameras, particularly if using bait, has the potential to affect
the behaviour of wildlife and may require approval under the NSW Biodiversity
Conservation Act 2016 or the NSW Animal Research Act 1985.
7. Digital Information, Monitoring Tools
& Resources
The skills you develop in observational and photo point monitoring will be valuable to you in
other aspects of property management. For example you may wish to exclude fire from your
property if you only have rainforest but still need to manage other threats such as feral animals
or weeds. You may also apply for grants that require some form of monitoring to record the
progress and success of your project.
You may have wildlife conservation objectives for your property and wish to build your
knowledge of the wildlife on your property. Below are a number of programs and resources
designed to assist community members build their skills and at the same time contribute to
publicly available records of bird and animal populations.
Survey Techniques for Citizen Scientists
The National Parks Association of NSW has produced the manual, Survey Techniques for
Citizen Scientists (2015) to provide information in a user friendly way to assist community
groups or individuals to gather data. The manual contains general information on monitoring
as well as specific survey methods for vegetation as well as terrestrial mammals, bats, reptiles,
frogs, birds, invertebrates and underwater survey methods. Visit www.npansw.org.au/ to find
out how to order this manual.
Atlas of Living Australia
Records from citizen science projects or general opportunistic observations can be added
to the Atlas of Living Australia or searches done by location or species. www.ala.org.au/get-
involved/citizen-science/. Records can also be uploaded through its phone application OzAtlas
www.ala.org.au/blogs-news/new-version-of-ozatlas-app-available-now-for-download-on-
android-phones-2/.
34You can also read