Economic and Social Council - United Nations - UNECE
←
→
Page content transcription
If your browser does not render page correctly, please read the page content below
United Nations                                                           ECE/ENERGY/GE.3/2021/9
             Economic and Social Council                                            Distr.: General
                                                                                    9 April 2021

                                                                                    English only

Economic Commission for Europe
Committee on Sustainable Energy
Expert Group on Resource Management
Twelfth session
Geneva, 26-30 April 2021
Item 8(i) of the provisional agenda
Development, maintenance and implementation of the United Nations
Framework Classification for Resources:
Commercial aspects and financial reporting

            The United Nations Framework Classification for Resources
            applied to commercial assessments – Update and
            achievements.

            Prepared by the Expert Group on Resource Management Commercial
            Applications Working Group

  Summary
                    This document supplements the three previous parliamentary documents issued by
            the Expert Group on Resource Management Commercial Applications Working Group in
            2019, 2020 and 2021 and the United Nations Economic Commission for Europe webinar
            “How the United Nations Framework Classification for Resources (UNFC) can help channel
            investments into energy and resource projects for sustainable development” held on 11
            March 2021. It proposes that success in achieving the Sustainable Development Goals will
            be higher if the parties collaborate in an enhanced dynamic and integrative public-private
            partnership, where the public side (the United Nations and governments) set policies and
            operate framework conditions that allows industry to deploy its best capabilities in ways that
            the capital market can finance. The document illustrates this through the example of the
            response of the Norwegian Government to the 2020 COVID-19 pandemic-related drop in oil
            prices. An example that illustrates how policies and private decisions interact and how they
            can be better aligned.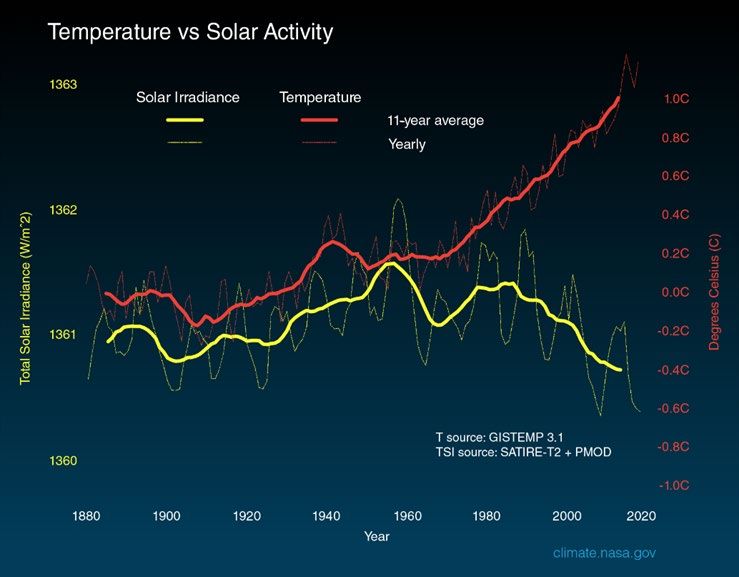
ECE/ENERGY/GE.3/2021/9

           Acknowledgements
           This paper is produced by the Commercial Applications Working Group of the United
           Nations Economic Commission for Europe (ECE) Expert Group on Resource Management
           with input provided by Mr. Erik Reiso of Rystad Energy AS and Mr. Per Blystad of the ECE
           Expert Group on Resource Management Communications Working Group and Petronavit
           a.s..
           Mr. Erik Reiso, Mr. Per Blystad and the members of the Commercial Applications Working
           Group have shown exemplary cooperation in shaping this paper which deals with
           exceptionally complex issues. The members of the Working Group are:
               • Ms. Kathryn Campbell (Attorney)
               • Ms. Carolina Coll (CGG)
               • Mr. David Elliott, Member Emeritus after his retirement (Consultant)
               • Mr. King Lee (World Nuclear Association)
               • Mr. Matthias Hartung (Executive Consultant Data & Digital)
               • Mr. Sigurd Heiberg, (Chair) Petronavit a.s.
               • Mr. Julian Hilton (Aleff Group)
               • Mr. Donald Lessard (Professor Emeritus, Massachusetts Institute of Technology)
               • Mr. Michal Lynch-Bell (KAZ Minerals)
               • Mr. Dominique Salacz (Abu Dhabi National Oil Company (ADNOC))
               • Mr. Nick Stansbury (Legal & General Investment Management)
               • Mr. Danny Trotman (EY)
               • Mr. Claudio Virues (Alberta Energy Regulator, Canada)
               • Mr. Jeremy Webb (UNDP).
           The Working Group agreed to submit the paper for publication as a parliamentary document
           for the twelfth session of the ECE Expert Group on Resource Management.
           The document has been reviewed and accepted by the Technical Advisory Group. Alistair
           Jones, Catherine Witt and Jean-Marc Dumas are thanked for their dedicated interest and
           constructive comments. The paper has also been reviewed and accepted by the Bureau of the
           ECE Expert Group on Resource Management.
           It would not have been possible to complete this document without the continued dedication,
           inspiration and support of Ms. Charlotte Griffiths and Mr. Harikrishnan Tulsidas of the ECE
           Sustainable Energy Division.

2
ECE/ENERGY/GE.3/2021/9
I. Introduction
1. This document supplements the three previous parliamentary documents issued by the
Commercial Applications Working Group (1) (2) (3) and the ECE webinar “How the United
Nations Framework Classification for Resources (UNFC) can help channel investments into
energy and resource projects for sustainable development” held on 11 March 2021 (4). It
proposes that success in achieving the UN Sustainable Development Goals (SDGs) will be
higher if the parties collaborate in an enhanced public-private partnership, where the public
side (the United Nations and governments) set policies and operate framework conditions
that allows industry to deploy its best capabilities in ways that the capital market can finance.
It illustrates this through the example of the response of the Norwegian Government to the
2020 COVID-19 pandemic-related drop in oil prices. The purpose of this example is not to
pass judgment on this particular response, but to illustrate how policies and private decisions
interact and how they can be better aligned.
2. Previous efforts recognized the following reliable premises:
(a) There is an urgent need for change in the energy system, as well as in the raw
materials and anthropogenic material systems, to stem the global temperature rise. Figure I
shows that temperatures are rising rapidly, and cannot be explained by changes in solar
activity. The need to stem the temperature rise must be met while also meeting the need to
secure sustainable and affordable energy and material services for a large and growing global
population coming out of poverty and aspiring to meet the SDGs;
Figure I
Temperature versus solar activity 1
Source: NASA 2
1 The rate at which energy from the sun reaches the top of the earth's atmosphere is called total solar
irradiance (TSI).
2 https://climate.nasa.gov/climate_resources/189/graphic-temperature-vs-solar-activity/
3ECE/ENERGY/GE.3/2021/9
(b) It is likely that large energy and raw materials producing projects will face new
requirements and restrictions in order to achieve the reduction in global temperature, and they
will see continued policy changes during the decades in which they will operate. This will
affect their commercial environments. Potential policy changes represent both risks and
opportunities to be managed;
(c) If the UN, governments, industry and finance operate independently, the risks
associated with potential policy changes will be larger than they need to be. The chance of
success in achieving the goals will be higher if, as mentioned previously the parties
collaborate in an enhanced public-private partnership, where the public side (UN and
governments) set policies and operate framework conditions that allows the industry to
deploy its best capabilities in ways that can be financed (wholly or partly) in the capital
markets. Clearly, the capabilities of all parties need to be dynamic as consecutive changes
will be material. They also need to be integrative in the sense that the parties need to recognise
and respect the positions and constraints of all the stakeholders in shaping the partnership. In
summary, all parties need to develop integrative dynamic capabilities (IDCs). 3
II. Applying the United Nations Framework Classification for
Resources to see the effects of policy changes
3. The effect of policy changes on UNFC-based project inventories can be observed as
explained below. More importantly, the potential effects of future changes may be predicted
and studied. To do so requires identifying and quantifying the effects of potential changes
calibrated by relevant observed effects of past policy changes. Thus, the backward- and
forward-looking applications of UNFC go hand in hand.
4. The Commercial Applications Working Group’s 2021 parliamentary document (3)
and the ECE Webinar (4) focused on abating greenhouse gas (GHG) emissions from burning
fossil fuels. This is a natural priority since it affects 70-80% of the energy that drives the
world’s economies. The ECE scenario study “Pathways to Sustainable Energy” (5), like
many other similar studies, finds that the climate ambitions cannot be reached without capture
and storage of greenhouse gases (in the case of CO2 referred to as carbon capture and storage
(CCS) or carbon capture use and storage (CCUS)). A fair assumption is therefore that policy
changes encouraging or requiring CCS will be introduced in the lifetime of projects so as to
achieve the goal of net zero GHG emissions. In the absence of subsidies, the CCS cost will
directly or indirectly be charged to the burning of fossil fuels.
5. The combustion of oil releases about 0.4-0.5 tonnes of CO2 per barrel 4 of crude oil,
depending on its composition, and less for refined oil and for an energy equivalent of gas.
The cost of capturing and storing thus will vary over geographies and circumstances but
should not exceed the cost of capturing and storing CO2 from the air where conditions for
that are most favourable, irrespective of where the emissions occur. The issues around this
are studied in the ECE project “Enhancing the understanding of the implications and
opportunities of moving to carbon neutrality in the ECE region across the power and energy
intensive industries by 2050” (Carbon Neutrality project) (6).
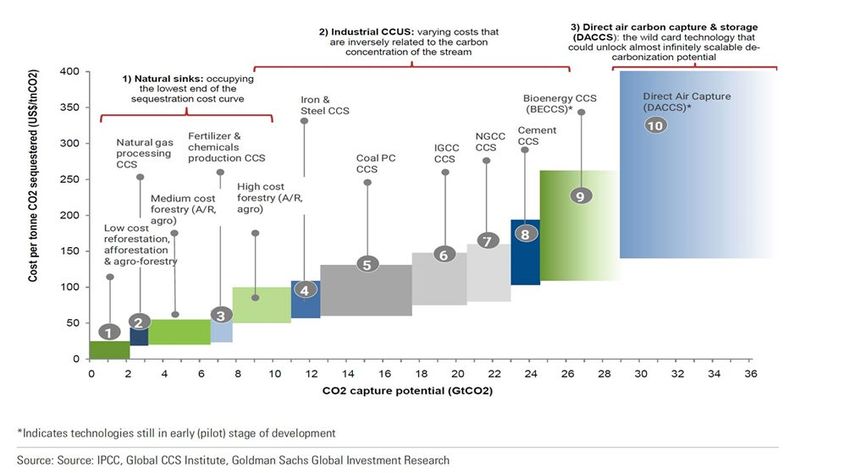
6. The technology brief produced under this project shows the costs of CCS in Figure II.
3 Dynamic capabilities are those required to sense and seize opportunities for change and to transform
the relevant systems accordingly, integrative refers to the ability to apply these capabilities at a
system as well as component level. Teece et al (9) introduce the concept of dynamic capabilities,
Garcia et al (Garcia, Lessard, & Singh, 2014) apply it to partnering in oil and gas.
4 The value varies quite a bit with the carbon density in the fuel mixture that correlates with the density
of oil and gas.
4ECE/ENERGY/GE.3/2021/9
Figure II
Carbon sequestration cost curve (USD/tonne CO2equivalent) and the GHG emissions
abatement potential (GtCO2eq)
Note: For further details see the ECE Technology Brief on Carbon Capture, Use and Storage 5
7. CCUS may be expensive, but it is an affordable option for an economy that aspires to
be carbon neutral. Figure II gives the broad estimated costs of the main CCUS technologies.
In order to appreciate how these costs affect the cost of using fossil fuels in a transition period,
a cost of CCUS of USD150 per tonne of CO2 may for instance be considered. That implies a
doubling of energy costs, assuming an oil price of USD60/barrel and approximately 0.4
tonnes of CO2 emitted per barrel used. Even a doubling of energy costs is still within the
historical high oil price range.
8. Notably, some consumers of oil and gas products may experience much smaller levies
in fuel costs even at a CO2 tax of USD150/tonne, as certain jurisdictions already tax refined
oil and gas products by up to 300%. In contrast, some governments currently subsidize energy
products to make them affordable. These countries may particularly face a dilemma between
affordable or clean energy and require tools to assess and test potential changes in their
policies on the socio-economic and environmental aspects. An example is provided in Figure
III.
9. Rystad Energy AS has analysed the effect of a carbon price charged on the emissions
occurring during the production of oil and gas. This amounts to about 0.018 tonnes of CO2
per produced barrel with minimal effects on recoverable quantities within a reasonable range
of CO2 costs. By contrast, adding a cost of about 0.5 tonnes of CO2 per barrel for full
combustion to the price of oil will significantly impact commercial conditions, including
reducing the value of oil and gas at the point of production. This is discussed in the
Commercial Applications Working Group parliamentary document of 2021 (3).
5 https://unece.org/sites/default/files/2021-03/CCUS%20brochure_EN_final.pdf
5ECE/ENERGY/GE.3/2021/9
Figure III
Testing the economic viability of an example hydrocarbon production project against
CO2 taxes of zero, 30, 50 and USD 100 per tonne CO2 equivalent
Note: the cumulative After-Tax Cash Flow (ACTF) of the Net Present Value of the project
is shown – for USD100/tCO2, the project is impaired (line on the x-axis) and cannot become
economically viable.
10. Although the effects of such policies have not been seen yet, reductions in the
wellhead values of oil have occurred often. The example below shows how the Norwegian
Government, industry and finance reacted to mitigate the negative effects of the oil price drop
that occurred during the COVID-19 pandemic in the spring of 2020. The oil price movement
is shown schematically in Figure IV. The fall in price represented a risk that projects would
not be initiated or would be cancelled during the pandemic. This would impose a significant
adverse impact on jobs and industries. The Norwegian Government responded by adjusting
the fiscal system temporarily (7). The main elements of the temporary fiscal system are
shown in the Table. It applies to projects where plans for development and operation are
submitted to the Government before 1 January 2023 and approved before 1 January 2024.
Figure IV
Oil price movements in the spring of 2020
Source: Macrotrends 6
6 https://www.macrotrends.net/1369/crude-oil-price-history-chart
6ECE/ENERGY/GE.3/2021/9
The main elements of the ordinary and temporary fiscal system of 19 June 2020
applicable to petroleum investments on the Norwegian Continental Shelf
Measure Ordinary fiscal system Temporary fiscal system
Corporate tax 22% 22%
Special petroleum tax 56% 56%
Uplift on investments before calculating 5.2% 24%
the special petroleum tax.
Depreciation rate 16 2/3% per year 100% in the year of
with adjustments investment
for some areas
11. To allow 100% depreciation in the year investments are made is efficient as it aligns
the public and private economic incentives for the affected investment. This is discussed in
the text developed on page 13 and 14 of the Commercial Applications Working Group’s 2019
parliamentary document (1) and on pages 4 and 5 of its 2020 parliamentary document (2).
12. The alignment is not perfect for the corporate tax as the government contribution to
investments is delayed as specified by the depreciation schedule. This represents an
advantage for governments and a disadvantage for industry. The uplifts work in the opposite
direction as an advantage for industry and a disadvantage for the government. Both parties
are often better off realizing a development project than by not doing so.
13. The changes in the UNFC classification of Norwegian oil/gas projects to this
temporary change of the fiscal system is indicated in the publicly available petroleum
accounts of the Norwegian Petroleum Directorate in 2020, although changes not related to
the policy change mask the effect in the public information. Petronavit a.s. has provided an
unofficial representation of the changes in the classification of about 100 of the projects that
were active in 2020. The results are shown in Figures V and VI. This is an input-output or
Design Structure Matrix (DSM) (1) type table format which is fully explained in the 2021
parliamentary document of the Working Group (3). The response to the temporary changes
in the fiscal system could not be verified for all projects in this preliminary study. Some
changes that occurred immediately after the fiscal system was changed affected mature
projects that were impaired by the oil price drop. Information is not publicly available on the
effects of the change on these projects. These projects are therefore not included in the sub-
inventory studied. Most of the effects on the projects in the sub-inventory are expected to
occur after 2020 (8).
14. This study should be followed up with a more comprehensive study of the project
details by those who have access to this information, and it should be carried out year by
year.
15. Figures V and VI show the projects that remained in their initial class during the year
along the diagonal. The projects that improved their classification are found below the
diagonal and those impaired are plotted above it. Revisions during the year are shown in the
column to the right.
16. The information about most of the viable projects (On production, Approved for
Development, Justified for Development) and Potentially Viable Projects (Development
Pending, Development on Hold), as well as Non-Viable Projects (Development Unclarified)
that are connected to the viable projects, is not publicly available or defined in enough detail
to populate the DSM matrix and to show the effects of the policy change. These are therefore
not included in the sub-inventory.
17. Clearly, it would be useful to see not only recoverable quantities, but also the
investments, jobs, emissions etc. This information is carried by the projects and could be
easily harvested by the owners of the information.
7ECE/ENERGY/GE.3/2021/9
Figure V
Sub-inventory of petroleum projects on the Norwegian Continental Shelf showing the
number of projects that changed classification in 2020 and what the changes were.
Closing balance RNB2021 Revision
Number Produced
UNFC Sub- Sold or
UNFC Sub-class of and not 1.1;1.1 1.1;1.2 1.1;1.3 1.1;2.1 2;2.1 2;2.2 3.2;2.2 3.2;3
class used
Projects used
1 3 2 24 10 28 33 -10
Sales
Opening balance RNB2020
production
Non-sales
production
On production 1.1;1.1
Approved for Development 1.1;1.2 2 2 0
Justified for Development 1.1;1.3 1 1 0
Development Pending 1.1;2.1 17 2 15 0
Development Pending 2;2.1 10 1 9 1 1
Development on-hold 2;2.2 36 8 1 25 1 -1
Development Unclarified 3.2;2.2 32 1 2 19 -10
Prospective Resources 3.2;3 13
Figure VI
Sub-inventory of petroleum projects on the Norwegian Continental Shelf showing the
recoverable quantities of projects that changed classification in 2020 and what the
changes were.
Closing balance RNB2021 Revision
Total Produce
Sold or
UNFC Sub-class UNFC Sub-class mill Sm3 d and 1.1;1.1 1.1;1.2 1.1;1.3 1.1;2.1 2;2.1 2;2.2 3.2;2.2 3.2;3
used
o.e not used
7776 0,2 8,1 30,4 286,2 139,2 125,9 155,1 3834,8 -42,5
Opening balance RNB2020
Sales
production 7550
Non-sales
production
On production 1.1;1.1 226
Approved for Development 1.1;1.2 0,7 0,7 0,0
Justified for Development 1.1;1.3 0,9 0,2 -0,7
Development Pending 1.1;2.1 219,2 30,4 201,6 12,9
Development Pending 2;2.1 148,1 7,9 138,8 3,8 2,4
Development on-hold 2;2.2 209,1 76,7 0,4 108,9 5,7 -17,4
Development Unclarified 3.2;2.2 126,2 7,4 13,2 74,2 -39,6
Prospective Resources 3.2;3 3910 75,2 3834,8 0,0
18. The projects of greatest interest when designing policies and frameworks are primarily
the ones with a potential in the environmental, social and economic domain and the ones
where development has not yet started but could be. These classes are shown in dark grey.
19. This Norwegian Continental Shelf example illustrates how an innovative public-
private partnership can mitigate critical risks associated with oil price volatility in the midst
of the COVID-19 pandemic. In this case, policies were adopted to help make projects remain
viable when the oil price reduced. However, it illustrates how policies could be used for other
purposes e.g. to steer whether or not projects are undertaken in order to address rising
greenhouse gas emissions. Going forward, it is expected that climate change goals and the
needs for development will together force implementation of changes in policy and
frameworks that will both impair and favour projects.
20. An example of the need for policies to favour projects was exposed at the EU Industry
Week 2021 online event “How the European Arctic secures the European Green Deal and
industrial leadership with sustainable raw materials and batteries” held on 17 March 2021. 7
The event was organized by European Commission in cooperation with SveMin, FinnMin,
the Västerbotten region and the North Sweden European Office. During the discussions, it
was widely recognised that permitting processes were hampering progress in applying the
advanced mining technologies now available. It is quite likely that UNFC could be applied
7 https://www.svemin.se/aktuellt/kalender/eu-industry-days-2021/
8ECE/ENERGY/GE.3/2021/9
to expose the mining projects on the Fennoscandian Shield that may be positively affected
by policy changes. Success in achieving the SDGs will be higher if the parties collaborate in
an enhanced dynamic and integrative public-private partnership, where the public side (the
United Nations and governments) set policies and operate framework conditions that allows
industry to deploy its best capabilities in ways that the capital market can finance.
21. In summary, UNFC is ideal for analysing the effects of alternative policies. It also can
be used to measure past performance to allow proper calibration of the policy instruments.
22. The global information base is vast. To reap the benefits in the form of better decisions
on policies, capability strategies and finance will require standardised but distributed efforts
in data capture and the generation of information and decision support from it. This applies
to all the commodities for which UNFC has been developed and involves the full range of
information that the projects carry, not only recoverable quantities.
References
1. Eppinger, Stephen D. and Browning, Tyson R. Design Structure Matrix Methods and
Applications. Cambridge, Massachusetts; London, England : The MIT Press, 2012. ISBN
978-262-01752-7.
2. The United Nations Framework Classification for Resources Applied to Commercial
Assessments - Update. UNECE. Geneva : UNECE, 2020. p. 25.
ECE/ENERGY/GE.3/2020/5.
3. UNECE. The United Framework Classification for Resources Applied to Commercial
Assessments - Draft considerations. Geneva : UNECE Expert Group on Resource
Management, 2019. p. 27. ECE/ENERGY/GE.3/2019/7.
4. Government of Norway, Ministry of Finance. PROP.113L (2019-2020) Temporary
amendments to the Petroleum Taxation Act. Preliminary edition. Oslo : Governemnt of
Norway, Ministry of Finance, 2020.
5. The United Nations Framework Classification for Resources applied to Commercial
Assssments - Introductory guidance. UNECE. Geneva : UNECE, 2021.
ECE/Energy/GE.3/2021/8.
6. UNECE. Pathways to Sustainable Energy - Accelerating Energy Transition in the UNECE
Region. Geneva : United Nations, 2020. p. 47. Energy Series No. 67.
7. Technology Brief - Carbon Capure, Use and Storage (CCUS). Geneva : UNECE, 19 03
2021.
8. Webinar: How the United Nations Framework Classification for Resources (UNFC) can
help channel investments into energy and resource projects for sustainable development.
[Online] 2021. [Cited: 18 03 2021.] https://unece.org/sustainable-energy/events/webinar-
how-united-nations-framework-classification-resources-unfc-can.
9. Norwegian Petroleum Directorate. Resource Accounts as of 31 December 2020.
https://www.npd.no/en/facts/resource-accounts-and-analysis/resource-accounts-as-of-31-
december-2020/. [Online] Norwegian Petroleum Directorate, 19 02 2021. [Cited: 19 03
2021.] https://www.npd.no/en/facts/resource-accounts-and-analysis/resource-accounts-as-
of-31-december-2020/.
10. Teece, David J, Gary Pisano, and Amy Shuen. “Dynamic Capabilities and Strategic
Management.” Strategic Management Journal. 1971, Vol. 18, 7 pp 509-33.
11. Garcia, Rodrigo, Donald R. Lessard, and Aditya Singh. 2014. “Strategic Partnering
in Oil and Gas: A capabilities Perspective. [ed.] Heiberg ,S and Lessard, D. Energy Strategy
Reviews. September 2014, Vol. 3 , pp. 21-29.
9You can also read