Economic scenarios for the COVID-19 recovery Guiding strategic, financial and operational decisions - Deloitte
←
→
Page content transcription
If your browser does not render page correctly, please read the page content below
Economic scenarios
for the COVID-19 recovery
Guiding strategic, financial
and operational decisions
May 2020
Preparedness over prediction
Scenarios are stories about what the future may be like, created through
a structured process to stretch thinking, challenge conventional wisdom,
and drive better decisions today.

Scenarios are not predictions about what will happen. They are
hypotheses about what could happen, designed to open our eyes to new
opportunities or hidden risks.

Source: Deloitte, The world remade by COVID-19: Scenarios for resilient leaders | 3-5 years

Economic scenarios for the COVID-19 recovery Guiding strategic, financial and operational decisions   2
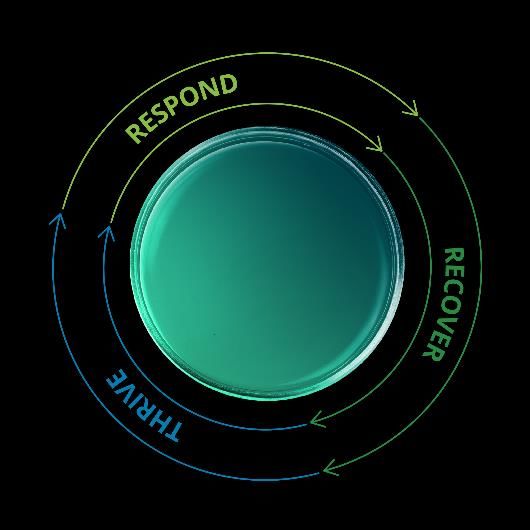
Deloitte’s Resilient Leadership framework defines three timeframes for the COVID-19 crisis

                                                                                As governments begin to lift restrictions, it would be folly to think linearly about a switch from health to economy. The two are so
In the midst of the greatest                                                    intertwined that this interconnection is going to remain with us over the coming years. This is a mindset shift we need to make.
economic crisis since the                                                       Our recovery will thus be in ‘waves’ not an alphabet. Indeed, we may need to shift out thinking from a post-COVID world to a
                                                                                world where we learn to live with COVID. Such thinking means that we need to be prepared for and manage expectations that
Great Depression,                                                               the recovery may not be smooth or comfortable.

prediction as we know it, is                                                    Each of the scenarios in this document posits a potential future state — including trends in epidemiology, society, technology
                                                                                and policy — leading to corresponding economic implications.
rendered problematic. In                                                        These economic scenarios are not predictions about what will happen; they are hypotheses about what could happen, designed
the face of uncertainty, the                                                    to frame strategic decisions and planning discussions.

best approach is to                                                             This document is an extension to the global Recovery Scenarios previously published by Deloitte and serves to provide an
                                                                                Australian perspective on the COVID-19 crisis.
consider a series of
scenarios – of plausible
and relevant futures – to
understand the signposts
                                                                                            RESPOND                                      RECOVER                                         THRIVE
and transmission
                                                                                           Manage continuity                      Learn and emerge stronger                     Prepare for the next normal
mechanisms which can
guide decision making.

Economic scenarios for the COVID-19 recovery Guiding strategic, financial and operational decisions                                                                                                                3
4

5
6

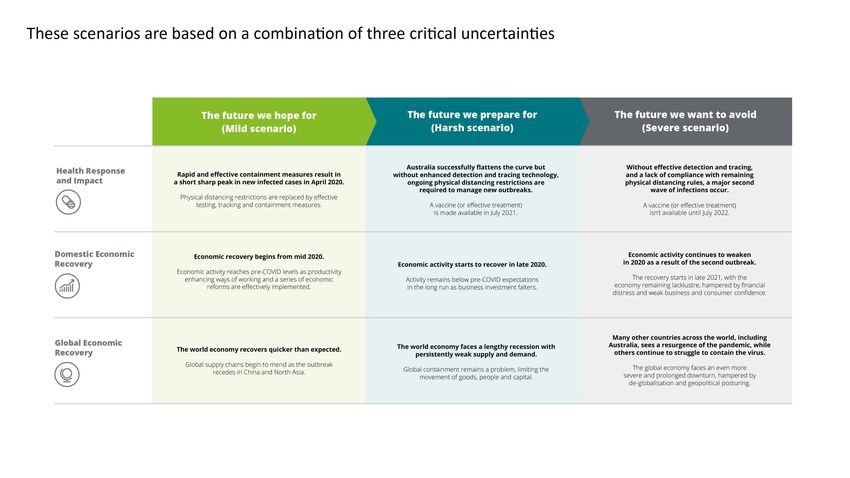
The future we hope for – a Mild scenario

What if the pandemic is resolved sooner than we                                                       Key assumptions
anticipate? Globally, the world economy recovers quicker than                                         • A technological leap in virus testing enables many countries across the world, including
expected, with varying degrees of virus containment. Both                                               Australia, to keep the effective reproduction rate of the virus below one, despite lifting
demand and supply recover: global supply chains begin to mend                                           most social distancing restrictions.
as the outbreak recedes in China and North Asia and as                                                • A vaccine (or effective treatment in the form of anti-virals) is made readily available to
confidence increasingly returns for families and businesses.                                            everyone by April 2021.
                                                                                                      • Government survival support enables organisations to keep people employed and
Rapid and effective containment under this scenario plays out in                                        maintain ownership of key assets so they’re able to rapidly restart operations.
a short and sharp peak. Growth rates then steadily fall until the
                                                                                                      • Government fiscal stimulus supports the re-ignition of the economy in the second half
virus is successfully managed using widespread and effective                                            of 2020.
testing and tracing. A vaccine (or effective treatment) is made                                       • Society learns from the crisis and enjoys productivity enhancing technological solutions;
available in April 2021 and prevents or notably eases the damage                                        and a wave of economic reforms, including tax and regulatory reforms, are put in place
from further outbreaks.                                                                                 to improve economic growth and wellbeing.

The short-term economic impact of the outbreak is material.
Activity plummets during the period of shutdown and the
unemployment rate rises. But the government introduces a
series of well-designed fiscal packages to mitigate the effect of
this shutdown and avoid persistent unemployment and
deflationarypressure in the longer term.

Economic scenarios for the COVID-19 recovery Guiding strategic, financial and operational decisions                                                                                                  7
The future we prepare for – a Harsh scenario
What if ongoing physical distancing measures are the only way for Key assumptions
us to control the pandemic? Globally, the world faces a lengthy • Some countries across the world, including Australia, manage to keep the effective
recession with persistently weak supply and demand. reproduction rate of the virus below one. However, without effective and widespread
surveillance, ongoing physical distancing measures are required to be in place –
Australia successfully flattens the curve, but without enhanced meaning flattening the curve comes at a considerable and ongoing cost to the
detection and tracing technology we need ongoing physical economy.
distancing restrictions in place to curb future virus outbreaks. • A vaccine (or effective treatment in the form of anti-virals) is made readily available to
These restrictions remain in place until a vaccine or effective everyone by July 2021.
treatment is made available in July 2021. • Government survival support enables organisations to keep some people employed
and maintain ownership of most key assets.
Government support cushions the impact of physical distancing
restrictions however the recovery is delayed as deflation sets in • Yet there’s insufficient government fiscal stimulus to avoid ongoing high
unemployment and falling prices (deflation). The subsequent rise in real interest rates
(with falling prices meaning even low interest rates are costly to hurts investment related sectors and delays the economic recovery.
borrowers) and investment decisions are deferred amid ongoing • We revert to pre-COVID ways of working once medical treatment (a vaccine or anti-
economic weakness and widespread uncertainty. Eventually the virals) has been rolled out and are unable to push through major reforms.
economy finds a ‘new normal’ level of activity and growth
resumes, but a persistent gap remains between our economic
expectations before the crisis and what we’ve now settled for –
wealth, incomes and confidence are all badly damaged.
Economic scenarios for the COVID-19 recovery Guiding strategic, financial and operational decisions 8The future we do everything to avoid
– a Severe scenario
What if we get hit by a second outbreak? Countries that today Key assumptions
seem to have controlled the outbreak face a return of the virus, • Similar to many other countries across the world, Australia sees a resurgence of the
while those still struggling find the pandemic outruns every effort pandemic. Without effective case detection and tracing and a high level of physical
of containment. Health outcomes are devastating and the global distancing fatigue among the population, the number of infected cases rise. The
effective reproduction rate of the virus is > 1 during the second outbreak.
economy faces an even more severe and prolonged downturn.
• Number of critical cases on any one day exceeds ICU capacity for a short period during
In Australia, without effective detection and tracing, we the second outbreak.
experience a second outbreak of the pandemic as a result of • A vaccine (or effective treatment in the form of anti-virals) is made readily available to
lifting restrictions too early and a lack of compliance with everyone by July 2022.
remaining physical distancing rules. What’s more, a vaccine or • A large number of businesses are lost as the second outbreak prolongs the period of
other effective treatment isn’t available until July 2022 as efforts disruption.
to fast-track it proves futile. • Rising bad debts sees our lending institutions under increased pressure. Credit ratings
drop, the cost of funding rises and availability of credit becomes curtailed.
In this scenario we enjoy a rapid recovery in the later part of 2020,
but it comes at a devastating cost. Our eagerness to restart the • Consumers rapidly reduce spending and increase their savings, generating a
downward spiral by putting further pressure on the viability of remaining businesses.
economy instigates a second wave of infections and the resulting
physical distancing measures has a devastating impact on the • An extended period of deflation sees us caught in a liquidity trap, leaving real interest
rates to rise despite very high unemployment, further slowing the economic recovery.
economy from 2021 onwards. A greater number of businesses
• We eventually revert to pre-COVID ways of working once the vaccine has been rolled
close as uncertainty rises, higher levels of unemployment out and are unable to push through major economic reforms.
becomes persistent and financial stress escalates as the duration
of the crisis extends and we battle a liquidity trap.
Global economic recovery is slow, hampered by de-globalisation
and geopolitical posturing.
Economic scenarios for the COVID-19 recovery Guiding strategic, financial and operational decisions 9COVID-19 is first and foremost a public health crisis
The effectiveness of our health response is critical to our future welfare
Public health response Impact The effectiveness of the COVID-19 health response will
be integral to Australia’s future. The way we enforce and
Scenario Physical Testing and Compliance Vaccine / Effective Critical cases > ICU comply with social distancing measures is essential to
distancing tracing capability with measures anti-virals reproduction capacity the successful containment of the current outbreak, and our
measures availability number (Re) ability to test, trace and isolate future cases will determine our
Mild Initial period At-scale High Early 2021 Remains 1 to create Yes, during second experience a devastating second outbreak of the
two severe improvement on second peak peak virus challenging ICU capacity for a critical period of time.
shutdowns current levels
Economic scenarios for the COVID-19 recovery Guiding strategic, financial and operational decisions 10Australia has fared relatively well to date
But what could the future hold?
Cumulative number of confirmed cases Future we hope for (mild) scenario
As a result of effective and targeted containment measures,
45,000 Australia sees a short and sharp peak in new infected cases
and deaths by end of April 2020. After a period of decline, no
40,000 new cases are observed from July 2020 onwards.
35,000
Future we prepare for (harsh) scenario
Second wave While we manage to contain the initial outbreak by May 2020,
30,000 new cases/outbreaks continue to appear as we try to balance
the need for physical distancing with the desire to re-open the
25,000 economy. Following the release of a vaccine in July 2021,
infected cases will decline rapidly until the virus is managed
20,000 Small rate of by August 2021.
sustained transmission
15,000
Future we want to avoid (severe) scenario
As we lift social distancing measures, COVID cases escalate
10,000 rapidly from September 2020. We eventually overcome this
second outbreak through a renewed period of severe physical
5,000 distancing regulations but the healthcare system struggles
under the surge in demand for ICU places.
0
2020 2020 2020 2020 2021 2021 2021 2021
Qtr1 Qtr2 Qtr3 Qtr4 Qtr1 Qtr2 Qtr3 Qtr4
Mild Harsh Severe
Economic scenarios for the COVID-19 recovery Guiding strategic, financial and operational decisions 11The sheer speed of economic disruption is unprecedented
We know COVID-19 has had a massive impact on economic activity, but what could the
recovery look like?
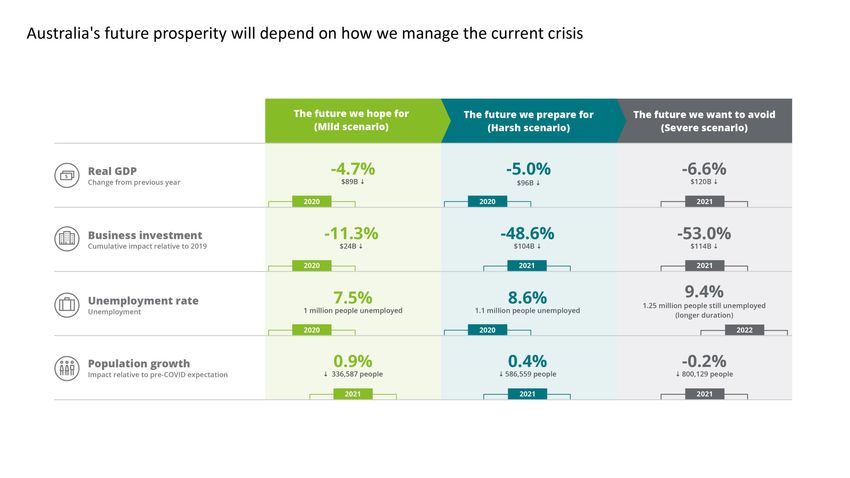
Real GDP impact relative to Pre-COVID expectations Future we hope for (mild) scenario
115
Economic activity rebounds from mid 2020 as the virus dissipates.
The initial recovery is fast as businesses are able to reopen quickly because
they’ve retained their workforce and assets. The recovery reaches pre-COVID
110
activity levels as we implement productivity enhancing ways of working and
implement a range of reforms.
Index, 2019Q4 = 100
105
100
95 Future we prepare for (harsh) scenario
Economic activity starts to recover in late 2020 as the virus comes under
90 control. However the recovery is slow as ongoing physical distancing restrictions
remain in place until a vaccine arrives in mid-2021. Economic activity remains
85 below pre-COVID levels as we fail to integrate new ways of working or
implement productivity enhancing reforms.
80
2019 2019 2020 2020 2021 2021 2022 2022 2023 2023
Qtr2 Qtr4 Qtr2 Qtr4 Qtr2 Qtr4 Qtr2 Qtr4 Qtr2 Qtr4
Future we want to avoid (severe) scenario
Pre-COVID Mild Harsh Severe Activity continues to weaken as the second outbreak occurs in late 2020.
Many businesses are lost and the recovery is hampered by weak consumer
2020 2021 2022 2023
and business confidence, financial sector stress, a rising pool of long term
GDP growth Pre-COVID 2.1 2.7 2.9 2.9 unemployed, and a prolonged period of deflation.
year average, Mild -4.7 6.5 4.8 4.6
percent Harsh -5.0 1.6 4.2 3.2
Severe -4.4 -6.6 6.9 2.8
Economic scenarios for the COVID-19 recovery Guiding strategic, financial and operational decisions 12Businesses have halted any plans for investment …
Leaving a lasting impact on future productivity
Business investment impact relative to Pre-COVID expectations Future we hope for (mild) scenario
With most physical distancing restrictions lifted after the initial containment, the
130
economy rebounds and businesses start regaining confidence. As credit
Index, 2019Q4 = 100
110 recovers and the government implements a series of well-designed fiscal
packages, business investment eventually recovers close to pre-COVID
90 investment levels.
70
50
Future we prepare for (harsh) scenario
30 Business investment is the most affected part of the economy as it’s hurt both
2019 2019 2020 2020 2021 2021 2022 2022 2023 2023 by expected future sales and by the unwillingness of businesses to take a risk. As
Qtr2 Qtr4 Qtr2 Qtr4 Qtr2 Qtr4 Qtr2 Qtr4 Qtr2 Qtr4 such the worse the health and economic outcomes of the pandemic, the worse
the outlook is for business investment. Capital spending remains on pause,
Pre-COVID Mild Harsh Severe particularly affecting the non-mining sectors. With the implementation of a
vaccine (or effective treatment) in mid 2021, businesses investment starts to
2020 2021 2022 2023 recover slowly but settle at a level significantly lower than pre-COVID
Pre-COVID 1.3 9.1 5.8 5.5 investment levels.
Growth year
average, percent ($3B) ($20B) ($14B) ($14B)
Change in Mild -11.3 9.3 10.8 9.4 Future we want to avoid (severe) scenario
$ amount (-$24B) ($18B) ($22B) ($22B) The two consecutive outbreaks of the virus results in business and consumer
of business Harsh -32.3 -24.1 2.2 20.8 confidence hitting an all time low. Many businesses are lost by the time a
investment from (-$69B) (-$35B) ($2B) ($23B) vaccine (or effective treatment) is implemented in mid 2022. As financial stress
the previous year escalates, credit becomes scarce and investment stagnates at a level much
in italics Severe -31.6 -31.3 4.3 19.3
(-$68B) (-$46B) ($4B) ($20B) lower than pre-COVID investment levels.
Economic scenarios for the COVID-19 recovery Guiding strategic, financial and operational decisions 13This is personal…
Thousands of jobs have already been lost. How many of these can we recover?
Unemployment rate impact relative to pre-COVID expectations Future we hope for (mild) scenario
The unemployment rate reaches 8.4% in the third quarter of 2020 before
12.0%
beginning a steady decline towards levels of unemployment seen pre-COVID.
10.0% The initial unemployment surge is muted by the successful health response
enabling businesses to re-open before losing their staff. In the medium term, a
8.0%
fiscal stimulus package and effective re-training programs enable workers to
6.0% return to work or find new work as businesses and shops re-open.
4.0%
2.0%
Future we prepare for (harsh) scenario
0.0%
Despite the introduction of numerous government economic survival measures
2019 2019 2020 2020 2021 2021 2022 2022 2023 2023
the unemployment rate reaches 10% in mid-2020. While the unemployment
Qtr2 Qtr4 Qtr2 Qtr4 Qtr2 Qtr4 Qtr2 Qtr4 Qtr2 Qtr4
rate starts to drop relatively quickly, this is as much a reflection of the economy
Pre-COVID Mild Harsh Severe
restarting as it is a reflection of a relatively smaller labour force due to a drop in
inbound migration.
2020 2021 2022 2023
Unemployment Pre-COVID 5.3 5.3 5.1 5.0
rate, percent (28) (20) (-10) (-7) Future we want to avoid (severe) scenario
Change in Mild 7.5 6.9 6.3 5.3 Despite the promise of a quick recovery seeing the unemployment rate dip
unemployment (‘000) (320) (-61) (-63) (-119) below the Harsh and Mild scenarios in late 2020, a second outbreak and
from the previous Harsh 8.6 7.4 6.6 5.9 subsequent restrictions sees the unemployment reach 10% for a second time in
year in italics (463) (-192) (-70) (-96) early 2022. And even as the economy starts to recover after a vaccine (or
Severe 8.1 9.1 9.4 9.0 equivalent treatment) is introduced in mid-2022 we struggle to lower
(394) (69) (89) (-49) unemployment as skills deteriorate and become obsolete for the long term
unemployed.
Economic scenarios for the COVID-19 recovery Guiding strategic, financial and operational decisions 14COVID-19 will change our demographic outlook
Australia’s population growth will shift gears as migration patterns are disrupted
Net overseas migration relative to pre-COVID expectations Future we hope for (mild) scenario
Strong border controls over the next 12 months cause total population growth
300,000 to drop to a low of 0.8% for 2020. An easing of restrictions through 2021 sees
migration return to pre-COVID levels by 2023. The total fertility rate temporarily
250,000 falls as some families shift family planning beyond the height of pandemic.
200,000
150,000
100,000 Future we prepare for (harsh) scenario
Border controls remain in place for longer, and people remain reluctant to
50,000 relocate internationally, leaving the downshift in migration deeper and wider.
Total population growth falls to a low of just 0.3% in 2020, recovering to 1.4% by
0
2023. The extended period of economic disruption causes the birth rate to dip
to 1.6 babies per woman before recovering to 1.65 by 2024.
-50,000
-100,000 Future we want to avoid (severe) scenario
A second outbreak sees extended disruptions to international movements, with
-150,000 the number of people departing Australia exceeding new arrivals through 2020
to 2022 as many migrants on temporary visas return home. The total population
-200,000 growth is –0.2% over 2020; remaining below 1% for several years. The
2018 2019 2020 2021 2022 2023 economic turmoil sees families delay or forego family planning decisions and the
total fertility rate falls to 1.5 babies per woman by 2023.
Pre-COVID Mild Harsh Severe
Economic scenarios for the COVID-19 recovery Guiding strategic, financial and operational decisions 15COVID-19 is affecting sectors differently
Some sectors face shorter or less severe impacts than others
COVID-19 industry impact and timing of recovery Every sector is experiencing COVID-19 differently. While the direction of
impact is clear for most sectors, the extent of the disruption and the timing
of the recovery remains uncertain.
Consumer
Business The Consumer Business sector is most affected. The hospitality and retail sectors suffer from
shutdowns enforced as part of the physical distancing restrictions while much of the
Financial manufacturing industry faces lower demand as well as input shortages due to ongoing global
Services supply chain disruptions. Finally, construction is severely affected as heightened uncertainty
causes households and businesses to postpone or cancel planned investments – scared
Technology Media businesses batten down rather than spend on expanding their capacity.
and Telecommunications
Financial Services is similarly disrupted as businesses and households curb demand for
Energy and new loans and as defaults rise on existing loans. Ongoing low interest rates crimp net
Resources interest margins. The effect on this sector grows rapidly as the severity of the economic
disruption worsens from the future we hope for to the future we’re doing everything to avoid.
Public Sector and
Health Care The disruption in Energy and Resources is more muted. While low oil prices mean profit
pressures for the gas sector, underlying demand is unlikely to change materially. Similarly,
there’s a risk that iron ore and coal demand will drop due to a protracted global recession, but
2020 2020 2020 2020 2021 2021 this is largely avoided in the Mild scenario.
Qtr1 Qtr2 Qtr3 Qtr4 Qtr1 Qtr2
Finally, there may be opportunities in Technology Media and Telecommunications and the
Public Sector. Specifically, in the Harsh and Severe scenarios, demand for online services rises as
Mild Harsh Severe
people shift to working, learning and seeking entertainment from home. Similarly, in these latter
Notes scenarios the growing demand for public sector and health services to manage the crisis
• The position of the circle represents the starting time of the sector’s recovery. The size of the circle indicates the magnitude of dominates the detrimental impact experienced in international education and elective surgery.
the COVID-19 disruption on the sector.
• Dotted lines surrounding the scenario circles represent increased sector demand. Harsh Severe
Economic scenarios for the COVID-19 recovery Guiding strategic, financial and operational decisions 16Consumer business and the financial sectors will be worst hit
Will a rapid recovery avoid persistent impacts on these industries?
Consumer Business sector output relative to Pre-COVID expectations Financial Services sector output relative to Pre-COVID expectations
110 110
Index, 2019Q4 = 100
Index, 2019Q4 = 100
90 90
70 70
50 50
2019 2019 2020 2020 2021 2021 2022 2022 2023 2023 2019 2019 2020 2020 2021 2021 2022 2022 2023 2023
Qtr2 Qtr4 Qtr2 Qtr4 Qtr2 Qtr4 Qtr2 Qtr4 Qtr2 Qtr4 Qtr2 Qtr4 Qtr2 Qtr4 Qtr2 Qtr4 Qtr2 Qtr4 Qtr2 Qtr4
Pre-COVID Mild Harsh Severe Pre-COVID Mild Harsh Severe
The industries in this sector are highly dependent on consumer and business sentiment and the The financial services sector is playing an important role to smooth the income shock for
willingness to spend. In the Mild scenario, this sector starts recovering in late 2020, and returns businesses and households during the crisis. But that role comes at a cost as bad debts rise and
to pre-COVID expectations by late 2023. The impact of COVID is persistent in the Harsh and demand for new loans drop in the face of high levels of uncertainty facing investors. In addition
Severe scenarios as consumer and business behaviour changes to permanently reduced levels to these changes, lenders face a prolonged period of net interest margin pressure as the cash
of spending relative to pre-COVID expectations. rate remains at the effective lower bound.
There will be pockets of opportunity. Farmers are enjoying a long sought after period of rain and Having said that, there could be a rise in mergers and acquisition activity as industries
demand for the local manufacture of a number of items is likely to rise as we reduce our reliance consolidate and we might see a shift back towards active wealth management services as
on global supply chains. Similarly, parts of the wholesale and transport sectors are experiencing households place greater value on active financial risk management to protect their wealth.
sustained gains from the rise in online retail.
Economic scenarios for the COVID-19 recovery Guiding strategic, financial and operational decisions 17There are pockets of opportunity for the technology sector
Energy and resources sectors must stay wary of longer term impacts
Technology Media and Telecommunications sector output Energy and Resources sector output relative to Pre-COVID expectations
relative to Pre-COVID expectations
120
130
Index, 2019Q4 = 100
Index, 2019Q4 = 100
110
120
110 100
100 90
90 80
2019 2019 2020 2020 2021 2021 2022 2022 2023 2023 2019 2019 2020 2020 2021 2021 2022 2022 2023 2023
Qtr2 Qtr4 Qtr2 Qtr4 Qtr2 Qtr4 Qtr2 Qtr4 Qtr2 Qtr4 Qtr2 Qtr4 Qtr2 Qtr4 Qtr2 Qtr4 Qtr2 Qtr4 Qtr2 Qtr4
Pre-COVID Mild Harsh Severe
Pre-COVID Mild Harsh Severe
In the Mild scenario, where the physical restrictions are temporary, the constraints in household Energy and resource demand experiences a small fall in the Mild scenario as a period of relative
consumer spending and business investment results in reduced activity in this sector. On the mild economic disruption reduces demand and investment in this sector. However, if the
other hand, in the Harsh and Severe scenarios a prolonged period of physical distancing disruption was to escalate we could see a short period of increased activity as the global
measures encourages greater investment in technology as we change the way we work, learn economy lurches towards greater levels of infrastructure spending to overcome weakness in
and play. other parts of the economy. Unfortunately, the demand surge will be short lived as a slowdown
would follow once the global economy switches back to normal and excess infrastructure capital
is sweated to help repair fiscal balance sheets.
Economic scenarios for the COVID-19 recovery Guiding strategic, financial and operational decisions 18We rely on the health care sector to keep us safe…
And the public sector to guide us through the crisis
Public sector and Health Care sector output relative to Pre-COVID expectations
120
Index, 2019Q4 = 100
110
100
90
2019 2019 2020 2020 2021 2021 2022 2022 2023 2023
Qtr2 Qtr4 Qtr2 Qtr4 Qtr2 Qtr4 Qtr2 Qtr4 Qtr2 Qtr4
Pre-COVID Mild Harsh Severe
In the Mild scenario, this sector experiences a small fall in demand as the drop in international
education and disruption to elective surgeries dominate the increased activity from government
agencies supporting the COVID response. On the other hand, if the crisis intensifies then we’ll see
a sharp rise in activity as the required health response grows and greater levels of government
oversight is required to manage the economic recovery. That surge period is only temporary,
however, and once the crisis subsides the government shifts its focus to budget repair.
Economic scenarios for the COVID-19 recovery Guiding strategic, financial and operational decisions 19Contacts These economic scenarios represent a range of possible economic circumstances as the COVID-19 crisis evolves. It is too soon to tell which of these or other scenarios will emerge, but resilient leaders are preparing now for what the future may hold. For more information, or to explore the implications of these economic cases on the future of your organization, please contact us: Chris Richardson Chief Economist Contact: chrichardson@deloitte.com.au Dr Pradeep Philip Head of Deloitte Access Economics Contact: pphilip@deloitte.com.au Kristian Kolding Lead Partner, Macroeconomic Forecasting and Policy Contact: kkolding@deloitte.com.au Natasha Doherty Lead Partner, Health and Social Policy Contact: ndoherty@deloitte.com.au Acknowledgement Thank you to Peter Downes, Director Outlook Economics, for his contribution, advice and support in creating these scenarios. Economic scenarios for the COVID-19 recovery Guiding strategic, financial and operational decisions 20
Deloitte Access Economics is Australia’s pre-eminent economics advisory practice and a member of Deloitte's global economics group. For more information, please visit our website:
www.deloitte.com/au/deloitte-access-economics
This publication contains general information only, and none of Deloitte Touche Tohmatsu Limited, its member firms, or their related entities (collectively the “Deloitte Network”) is,
by means of this publication, rendering professional advice or services. Before making any decision or taking any action that may affect your finances or your business, you should
consult a qualified professional adviser. No entity in the Deloitte Network shall be responsible for any loss whatsoever sustained by any person who relies on this publication.
Deloitte refers to one or more of Deloitte Touche Tohmatsu Limited (“DTTL”), its global network of member firms, and their related entities. DTTL (also referred to as “Deloitte Global”)
and each of its member firms and their affiliated entities are legally separate and independent entities. DTTL does not provide services to clients. Please see www.deloitte.com/about
to learn more.
About Deloitte
Deloitte is a leading global provider of audit and assurance, consulting, financial advisory, risk advisory, tax and related services. Our network of member firms in more than 150
countries and territories serves four out of five Fortune Global 500®companies. Learn how Deloitte’s approximately 286,000 people make an impact that matters at www.deloitte.com.
About Deloitte Asia Pacific
Deloitte Asia Pacific Limited is a company limited by guarantee and a member firm of DTTL. Members of Deloitte Asia Pacific Limited and their related entities provide services in
Australia, Brunei Darussalam, Cambodia, East Timor, Federated States of Micronesia, Guam, Indonesia, Japan, Laos, Malaysia, Mongolia, Myanmar, New Zealand, Palau, Papua New
Guinea, Singapore, Thailand, The Marshall Islands, The Northern Mariana Islands, The People’s Republic of China (incl. Hong Kong SAR and Macau SAR), The Philippines and Vietnam, in
each of which operations are conducted by separate and independent legal entities.
About Deloitte Australia
In Australia, the Deloitte Network member is the Australian partnership of Deloitte Touche Tohmatsu. As one of Australia’s leading professional services firms. Deloitte Touche
Tohmatsu and its affiliates provide audit, tax, consulting, and financial advisory services through approximately 8,000 people across the country. Focused on the creation of value and
growth, and known as an employer of choice for innovative human resources programs, we are dedicated to helping our clients and our people excel. For more information, please
visit our web site at www.deloitte.com.au
Liability limited by a scheme approved under Professional Standards Legislation.
Member of Deloitte Asia Pacific Limited and the Deloitte Network.
© 2020 Deloitte Touche Tohmatsu.
Designed by CoRe Creative Services. RITM0462442
You can also read


