IMPACT OF FASTER FREIGHT TRAINS ON RAILWAY CAPACITY AND OPERATIONAL QUALITY - DLR
←
→
Page content transcription
If your browser does not render page correctly, please read the page content below
IMPACT OF FASTER FREIGHT TRAINS ON RAILWAY
         CAPACITY AND OPERATIONAL QUALITY
                           JAKOB GEISCHBERGER, MICHAEL MOENSTERS
        German Aerospace Center (DLR), Institute of Transportation Systems (TS), Braunschweig, Germany

                                               ABSTRACT
In view of the transition towards climate-friendly transportation, mobility and freight traffic
demand are both expected to grow in Europe´s already heavily occupied railway networks.
To accommodate the increasing traffic volume, capacity-optimised traffic planning is a
requirement. One key factor in this context is the heterogeneity of train speeds on heavily
used mixed-traffic railway lines. In this paper, we study the effects of train speed
harmonisation based on the increase of freight train velocities. Two planning scenarios are
addressed: In the first case, freight trains have a conventional speed profile but can
occasionally make use of their higher allowed speed level when needed. This can be used in
operations to recover from delays or blend in with passenger traffic. In the second case,
freight trains are scheduled to so-called “express train paths” – reaching a more
homogeneous timetable profile. The two planning concepts are analysed and compared in a
microscopic simulation approach. It is shown that scenarios based on the first planning
concept tend to have positive effects on operational quality and capacity, whereas scenarios
using “express freight train paths” are less promising in this respect.
Keywords: express freight trains, railway capacity, punctuality, microscopic simulation

                                  1 INTRODUCTION
The importance of rail freight for the transport sector is expected to continue growing
within the next years [1]. Not least the discussion about climate-friendliness of different
modes of transport attracts public attention and discussion to rail transport. The constantly
growing rail passenger traffic volumes confirm this trend [2].
    This higher demand leads to a higher occupation of railway infrastructure and
consequently results in the question whether the existing track capacity is sufficient in this
respect. Especially some of the heavily occupied corridors of nationwide importance are
overloaded and hence capacity is not sufficient there [3]. For this reason the European
Union has formulated objectives within the Shift2Rail framework that include, amongst
others, doubling railway capacity [4].
    Existing railway capacity can be increased by different measures. Suggestions include
technical innovations of both infrastructure and trains, the expansion of infrastructure or
changes in operations. In the context of the latter, the harmonisation of timetables and thus
speeds is discussed [5]. Thereby, the speed levels of different train categories are aligned in
order to make train operations as “smooth” as possible by reducing minimum headway
times and avoiding overtakings. This leads to a higher capacity in a certain line segment.
Ultimately, at mixed-traffic lines, harmonisation of speeds always means an acceleration or
deceleration of certain trains or train categories.
    Only few studies address the possibility of speeding up freight trains in order to
harmonise the speed of trains. Hence, this paper deals with the impact of faster freight
trains on operational quality and railway capacity. A distinction into two cases was made to
clarify the approach:

Preprint version
© 2020 WIT Press, www.witpress.com
ISSN: 2058-8305 (paper format), ISSN: 2058-8313 (online), http://www.witpress.com/journals
DOI: 10.2495/TDI-V4-N3-274-285
Final version see https://www.witpress.com/elibrary/tdi-volumes/4/3/2688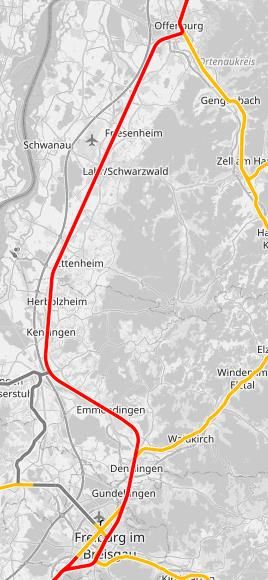
A) Freight trains can occasionally make use of their allowed higher speed level only
        when needed. This leads to higher recovery margins. The resulting higher
        flexibility can be used in operations to recover from delays or blend in with
        passenger traffic. Apart from this, they operate with conventional timetables and
        speed profiles.
     B) Freight trains are scheduled to so-called “express train paths” – reaching a more
        homogeneous timetable profile. This means they are strictly obliged to run faster
        than with conventional timetables.

    This distinction results from a different motivation behind the cases respectively: While
in case A) the focus lays on “smooth” operations with a high flexibility in order to recover
from delays or avoid overtakings, case B) strongly focuses on the harmonisation of speeds
and both transport time and speed. So while case A) ultimately results in significantly
higher recovery margins of the trains, these stay the same in case B). It must be examined
as to whether positive effects (such as harmonisation of speeds with long distance
passenger trains) or negative effects (conflicts with regional passenger trains) outweigh one
another in terms of resulting capacity.
    The impact on operational quality as well as capacity of the described cases will be
examined further in this paper. For this purpose, basic terms of railway capacity are
defined. Moreover, the operation of faster freight trains is addressed in a literature review.
This is followed by an explanation of the methodical approach. Afterwards, the results of a
performed use case study are presented and discussed in chapter 4 and 5.

                                   2 LITERATURE
Theoretical capacity can be referred to as the number of trains that could run over a route
during a specific time interval. It defines the upper limit for line capacity [6]. This is
complemented by the term of practical capacity, which can be defined, according to UIC
code 406, as the number of train paths that can be scheduled with market-oriented quality
[7]. Thus practical capacity is influenced by a desired operational quality, often referred to
as “level of service” [8]. A comparison of further definitions of capacity can be found in
[9].
    Several different methods exist to measure and evaluate railway capacity. This includes
constructive methods, concatenation according to UIC code 406, as well as simulations and
analytical approaches. These methods all have both advantages and disadvantages with
respect to output parameters, processing efforts, independence from timetables or how close
the models are to real-life train operations. It is not uncommon to pursue an approach with
multiple methods, as for example in [10] or [11], because the different methods can lead to
different results. Therefore a comparison between two or more methods can be helpful [11].
    In addition to the number of trains or traffic load, the heterogeneity of trains and train
categories has a strong influence on capacity as well [12]. Different train categories (and
thus speed levels) are referred to as mixed-traffic. Mixed-traffic results in longer headway
times and thus has negative effects on capacity. This contrasts to homogenous train
operations typical for commuter rail systems, where a strong harmonisation of speeds is
observed, such that small minimum headway times and dense train sequences can be
accomplished. Unmixing of trains in both a spatial and temporal dimension can lead to
stronger harmonisation and have been introduced in [12] as means to increase capacity. In
addition, it is argued that the alignment of speed levels is of special importance in
bottleneck segments. Further confirmation in this respect can be found for example in [13].

Preprint version
© 2020 WIT Press, www.witpress.com
ISSN: 2058-8305 (paper format), ISSN: 2058-8313 (online), http://www.witpress.com/journals
DOI: 10.2495/TDI-V4-N3-274-285
Final version see https://www.witpress.com/elibrary/tdi-volumes/4/3/2688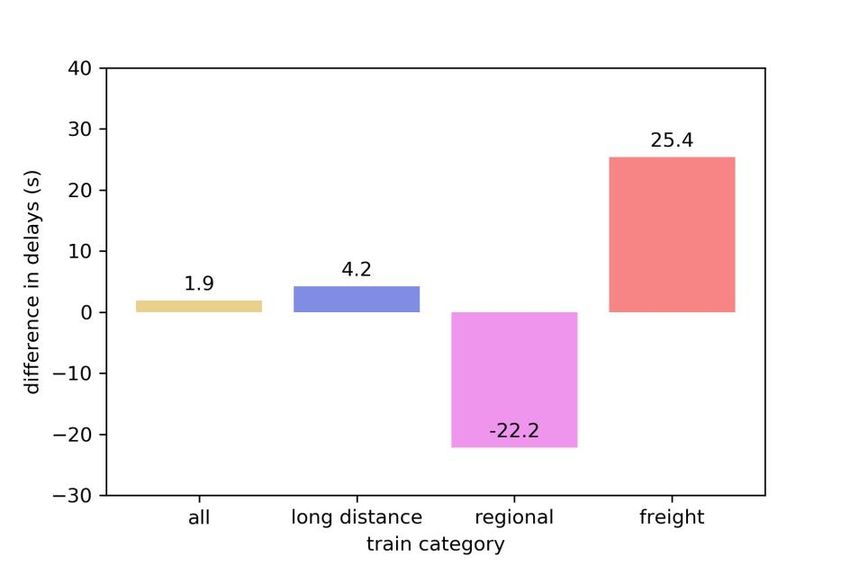
Moreover, several studies and publications deal with this topic, as in [5], [11] or [14].
Corresponding studies for the German rail system can be found in [15], [16] or [17].
    Faster freight trains were part of several former and current operational concepts.
However, many of these have been discontinued, mostly due to the lack of profitability or
demand. Moreover, some of the concepts could not avoid conventional freight trains being
further disadvantaged. A list can be found in [18]. Faster freight trains were also analysed
in [19], where the focus is on potential markets for faster freight trains. However, the
potential conflicts with other, slower trains are mentioned.
    Higher speed levels entail rising requirements in terms of both equipment and driving
dynamics of the trains and especially their wagons. Current freight train wagons with a
maximum speed of up to 120 km/h need additional equipment to raise this level above 140
km/h and up to 160 km/h. This includes, amongst others, disc brakes, electro-pneumatic
brakes, a self-adjusting load-proportional braking system, a brake pipe accelerator, wheel
slide protection and a higher braking regime. This, of course, means significant investments
in order to reach higher speed levels. The operation of faster freight trains up to 140 km/h,
however, seems to go along with comparably small investments [18, 20, 21]. This paper
focusses, however, rather on operational implications than technical feasibility.

                            3    METHODICAL APPROACH
In this paper we deal with a research question that has a strong link to real-life train
operations, especially with respect to case A) which focusses on operational flexibility. To
analyse the effect of a permitted, but not necessarily actualised higher allowed speed, a
microscopic simulation is chosen and performed. Unlike asynchronous methods it can
model and analyse performance of a rail corridor in an operational setting. Hence, it is
highly suitable to model railway operations closely linked to real circumstances and a
specific timetable in order to measure the change of delays within a certain line. The
detailed implementation of particular trains, infrastructure as well as control-command and
signalling can be pointed out as another reason.
    Thus, a microscopic simulation model was created using the railway operations
simulation software RailSys ®. A heavily occupied mixed-traffic line with a high number
of freight trains was chosen to be implemented, as the analysis should evaluate the effects
in circumstances where demand of additional trains is high. The model is based on nodes
and edges and includes several other layers of infrastructure including control-command
and signalling. Operating locations including major junction stations were implemented on
the detail level of tracks and switches. Timetables for both freight and passenger trains were
imported from publicly accessible sources for a time span of 24 hours (simulation period).
The evaluation period was defined from 6 am to 10 pm (in order to allow the simulation to
settle before evaluation starts). It can be justified by higher line occupation during the
daytime. A distribution of entry delays was applied to all trains entering the system: while
long distance trains have an average delay of 5 minutes with a probability of 0.5, regional
trains have an average delay of 4.5 minutes with a probability of 0.6. Freight trains delay by
an average 10 minutes with a probability of 0.6. These parameters were chosen according
to Deutsche Bahn Guideline 405 [22].
    As mentioned in chapter 1, the recovery margin has significant influence on operational
quality, because the parameter represents the ability of a delayed train to reduce its delay
while running through the system (independently of its maximum speed). Recovery
margins were defined according to Deutsche Bahn Guideline 402 [23].

Preprint version
© 2020 WIT Press, www.witpress.com
ISSN: 2058-8305 (paper format), ISSN: 2058-8313 (online), http://www.witpress.com/journals
DOI: 10.2495/TDI-V4-N3-274-285
Final version see https://www.witpress.com/elibrary/tdi-volumes/4/3/2688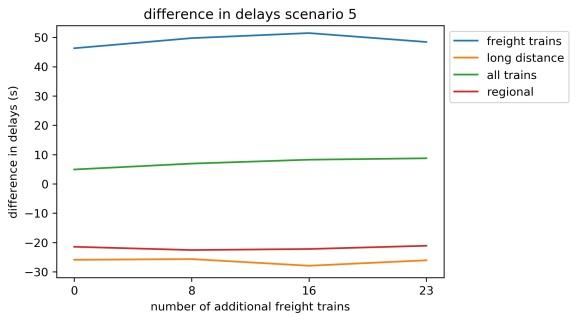
The difference in delays was chosen as evaluation parameter. It is an indicator of
operational quality [24]. It can be calculated by the difference between exit and entry delay
and therefore represents the behaviour of delay of a certain train within a system. In this
context, Heister [25] differentiates between three possible states of the evaluation parameter
(as shown in table 1):

            Table 1: States of the difference in delays (according to Heister [25]).

 Behaviour                      Difference in delays        Conclusion
 The delay of a train           positive                    The system is overloaded. In order to
 increases when running                                     improve defective operational quality, the
 through the system                                         number of trains may have to be reduced
 The delay of a train does      0                           The operational quality is „satisfactory“
 neither increase nor
 decrease when running
 through the system
 The delay of a train           negative                    The system allows reduction of delays while
 decreases when running                                     maintaining good operational quality. Under
 through the system                                         some circumstances, additional trains could
                                                            be added

    Both entry and exit delay were measured at the stop board of the first and last stop of a
train respectively. This has to be distinguished from measuring at the entry and exit point
directly. The latter might lead to falsified results due to entry dispatching algorithms in
RailSys. Moreover, the behaviour of the trains within the junction stations should be
included in the analysis as well.
    The dispatching routine and configuration in an operational simulation model affects
results considerably. It is bound to several parameters, one of them being the dispatching
priority. In case of a conflict of trains, this value decides which train to prioritise and which
one to hold back or stop. In real-life operations, normally higher priority is given to
passenger trains than to freight trains, as in many countries passenger traffic operates in
tight, aligned intervals in order to enable comfortable and quick interchanges. This was not
changed in the context of this study.
    The correlation between operational quality and the capacity of a line was methodically
implemented as follows: a reference timetable was systematically enriched with additional
freight train paths. This was performed by the enrichment function according to UIC code
406, which is part of the RailSys functionality. Enriching a timetable with additional paths
leads to a higher number of freight trains. Therefore, operational quality deteriorates. The
enrichment process was continued as long as there was still space for additional paths in the
analysed time table (hereby, a rather theoretical buffer time of 30 seconds is upheld). When
enriching timetables according to UIC code 406 the stop criterion must be that no more free
space for additional paths is left within the timetable (other stop criteria exist and might be
reached even though free space is still available). For this reason the enrichment process as
used in this paper is rather about determining a system´s theoretical load maximum than
calculating practically performable timetables. For both the reference and the fully enriched
timetable, the difference in delays was measured via simulation. Afterwards, starting with
the fully enriched timetable, additional trains were step by step removed again while
constantly measuring the difference in delays for each step. This was conducted until the
removal process ends with the reference timetable again. This results in a curve where

Preprint version
© 2020 WIT Press, www.witpress.com
ISSN: 2058-8305 (paper format), ISSN: 2058-8313 (online), http://www.witpress.com/journals
DOI: 10.2495/TDI-V4-N3-274-285
Final version see https://www.witpress.com/elibrary/tdi-volumes/4/3/2688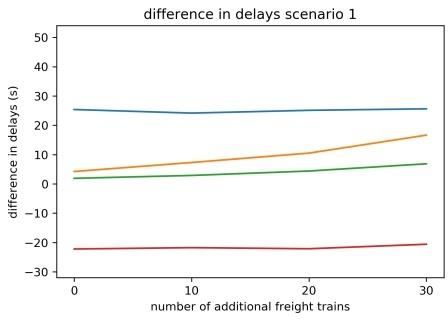
differences in delays can be plotted over the number of additional trains. The difference in
delays is expected to rise when raising the number of additional trains.
    The described methodical approach is now applied to several scenarios as shown in
table 2:

                                           Table 2: Scenarios.

 Scenario       Name                             Allowed maximum speed of              Case
                                                 freight trains (km/h)                 (cf. chapter 1)
 Scenario 1     Reference timetable (RTT)        conventional (100)                    Reference case
 Scenario 2     RTT vmax 120                     120                                   Case A)
 Scenario 3     RTT vmax 140                     140                                   Case A)
 Scenario 4     RTT vmax 160                     160                                   Case A)
 Scenario 5     Express timetable vmax 160       160                                   Case B)

    We choose five scenarios: scenario 1 is the reference timetable that represents current
real-life operations. Scenarios 2, 3 and 4 signify case A) with its higher flexibility. Scenario
5 contains “express freight train paths” as in case B). The choice of speed levels was
motivated as follows: 160 km/h is assumed as the maximum speed of the freight trains and
hence defines the maximum speed of both analysed cases (represented by scenarios 4 and
5). For one thing, this is the allowed maximum speed of passenger trains with conventional
signalling (e.g. German intermittent automatic train-running control). For another thing,
this maximum speed level was also given in former faster freight train concepts (see
chapter 2). Moreover, a speed level of 160 km/h exhausts the technical and physical
possibilities (see also chapter 2). Two more gradations (120 km/h and 140 km/h) are added
to case A) which might entail significantly lower investments (cf. chapter 2). (Case B is not
diversified accordingly, as there the harmonisation of speeds should be as high as possible).
    All three of the scenarios 2, 3 and 4 keep their original reference timetables when
simulated. The only simulation parameter that is changed is the allowed maximum speed of
freight trains. Scenarios 2 and 3 do explicitly refrain from improved physical attributes as
well as better equipment as needed for operation above 140 km/h (cf. chapter 2). Only
scenario 4 with a maximum speed of 160 km/h might mean larger investments are needed
(see chapter 2).
    In contrast, in scenario 5 new express timetables are created for freight trains at an
operating speed of 160 km/h. In addition, improved physical attributes are assumed as
follows: the train has a significantly better braking deceleration than conventional trains
(upgrade to 0.5 m/s²) and is equipped with ep-brakes. Hence, it shows attributes similar to
those of a long distance passenger train like the German ICE train. The driving dynamics
were improved in order to reduce the deceleration phases of the train so it can keep its
higher speed path more easily.
    As a next step, an evaluation criterion is identified to compare the results of different
scenarios. The following hypothesis is therefore formulated: A timetable with faster freight
trains and hence potentially better operational quality can be enriched with additional train
paths as long as the operational quality does not exceed that of the reference scenario. The
number of possible additional train paths identified will be an indicator of free usable
capacity caused by faster freight trains.

                                 4 CASE STUDY
To analyse the impact of faster freight trains on operational quality and capacity the line
segment between the German cities of Offenburg and Freiburg was studied as a use case.

Preprint version
© 2020 WIT Press, www.witpress.com
ISSN: 2058-8305 (paper format), ISSN: 2058-8313 (online), http://www.witpress.com/journals
DOI: 10.2495/TDI-V4-N3-274-285
Final version see https://www.witpress.com/elibrary/tdi-volumes/4/3/2688
This densely operated corridor has a maximum speed level of 160 km/h and is part of the
European TEN corridor Rhine-Alps between Rotterdam and Genua, which is of special
importance to the trans-European rail freight transport [26]. Moreover, it represents the
only double-tracked bottleneck between Karlsruhe and Basel (the rest for the most part has
four parallel tracks).
Figure 1: Line segment between Offenburg and Freiburg (Source: Open Railway Map ©
OpenStreetMap-Contributors [27]).
For the traffic scenarios and train types publicly accessible freight train data from the so
called noise-monitoring initiative in Germany, introduced by the Federal Railway Authority
[28], was taken for a representative day. The respective train numbers were implemented
into the reference timetable in the simulation model. Freight trains were classified into four
model train categories: container trains, trains with bulk goods, block trains and trains with
mixed goods. These vary in length and total mass. As a result, train operation was modelled
more realistically than with only one freight train category. Passenger trains were divided
into the German categories ICE (high-speed long distance train), IC (inter-regional long
distance train), RE (regional express train), RB (regional train) and S-Bahn (commuter
train). Timetables were imported from the digital timetable book of Deutsche Bahn [29].
The stations of Offenburg (including its large freight yard) and Gundelfingen were
defined as measuring points for the difference in delays. Gundelfingen has a major junction
Preprint version
© 2020 WIT Press, www.witpress.com
ISSN: 2058-8305 (paper format), ISSN: 2058-8313 (online), http://www.witpress.com/journals
DOI: 10.2495/TDI-V4-N3-274-285
Final version see https://www.witpress.com/elibrary/tdi-volumes/4/3/2688where many freight trains leave the main track and turn to the Freiburg freight train
circumvention, while passenger trains stay on the tracks to Freiburg Central Station. For
this reason, the total amount of trains in the system significantly changes in Gundelfinden,
which is consequently defined as the other border of the system. Fig. 1 shows the analysed
corridor (in red).
For different scenarios, 100 simulation runs each were performed. This number stems
from a trade-off between acceptable running times and at the same time statistically reliable
results. However, a slight dispersion of results cannot be ruled out; for this reason they are
plotted within a confidence interval.
The reference timetable (i.e. current real-life operations) was simulated by 100 runs and
both the recovery margins and distribution of entry delays were implemented as described
in chapter 3. The resulting differences in delays are calculated by the difference between
exit and entry delay (cf. chapter 3) and are shown by train categories in Fig. 2:
Figure 2: difference in delays, scenario 1: reference timetable.
Fig. 2 shows that the difference in delays over all trains is 1.9 seconds and thus delay
slightly increases. This confirms the high occupation of the analysed line segment. The
parameters are average values of both north and south direction. Due to the different flow
of goods, amongst others, the total amount of trains can vary between the two directions.
This results in slightly different values for the difference in delay when analysing them
separately. But because trains of different directions interact with one another – especially
at junctions – a joint analysis of both directions seems plausible. Fig. 2 also reflects the
dispatching routine of the model: Regional trains, for example, are allowed to reduce their
hold time at smaller stops in case of delays. This leads to a negative difference in delays:
Regional trains can reduce their delay. Moreover, passenger trains (often with tight
intervals) are prioritised in the dispatching. This is in accordance with real-time train
operations. As a result, delays of freight trains rise when running through the system.
Preprint version
© 2020 WIT Press, www.witpress.com
ISSN: 2058-8305 (paper format), ISSN: 2058-8313 (online), http://www.witpress.com/journals
DOI: 10.2495/TDI-V4-N3-274-285
Final version see https://www.witpress.com/elibrary/tdi-volumes/4/3/2688Generally, the values are averages of several hundred trains and therefore within the small
digits of seconds. This does explicitly not exclude single trains being hindered or overtaken
and therefore collecting several minutes of additional delay.
The five scenarios consist of a reference timetable, scenarios 2, 3 and 4 which represent
case A) (where trains have significantly higher recovery margins and thus flexibility) and
scenario 5 which represents case B) where freight trains are scheduled to “express paths”
(cf. chapters 1 and 3). Fig. 3 depicts the results of the simulation of the respective scenarios:
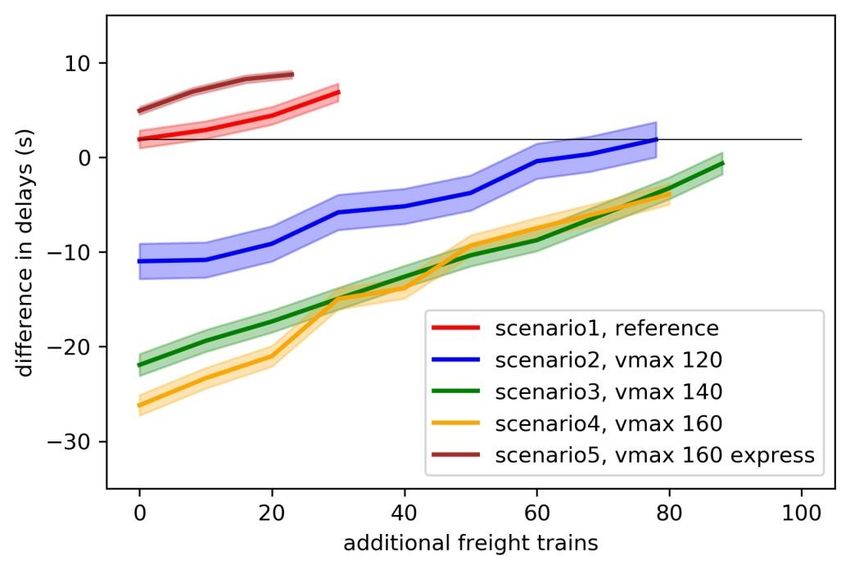
Figure 3: difference in delays, comparison of scenarios.
Fig. 3 shows the difference in delays of all trains in the respective scenarios on the y-
axis. The x-axis shows the amount of additional freight trains, which were inserted into the
respective timetables by the enrichment process described in chapter 3. Hence, the x-axis
represents different timetables where freight trains were inserted step by step (reading from
left to right). As described in chapter 3, the results were plotted within a confidence interval
which is dependent on the standard deviation σ. A factor of 2σ around the data mean value
was chosen to determine the width of the shaded area.
We can observe that all curves climb when inserting additional trains. However, only
scenarios 2, 3 and 4 (case A)) show a negative difference in delays for most part. Scenario 5
shows an increase in delays – even above the level of scenario 1. The black horizontal line
represents the level of the difference in delays of the reference timetable.
For all scenarios, the rise of difference in delays (and hence deterioration of operational
quality) while increasing the number of additional freight trains can be assessed as plausible
and represents the expected behaviour. For example, the value of the reference timetable
rises by around 5 seconds when inserting the maximum number of 30 additional trains.
For scenarios 2, 3 and 4 a significant decrease of delays is observed. This behaviour can
be possibly explained by the fact that freight trains are permitted to make use of their higher
Preprint version
© 2020 WIT Press, www.witpress.com
ISSN: 2058-8305 (paper format), ISSN: 2058-8313 (online), http://www.witpress.com/journals
DOI: 10.2495/TDI-V4-N3-274-285
Final version see https://www.witpress.com/elibrary/tdi-volumes/4/3/2688maximum speed and hence significantly higher recovery margins in order to reduce their
delays or avoid being overtaken respectively – their difference in delays decreases.
Moreover, long distance trains benefit in the mentioned scenarios, because they are
hindered less by preceding freight trains. These effects intensify with higher allowed
maximum speed levels of freight trains. All three curves climb when inserting additional
trains. It can be observed, that the only curve that reaches the level of operational quality
from the reference timetable, is the one of scenario 2 (by intersecting with the horizontal
black line). The operational quality of scenarios 3 and 4 does not even reach this level but
constantly stays below the described level of the black line – even if the maximum possible
amount of additional trains is inserted.
This is in contrast with the behaviour of the curve of scenario 5: There, the level of
difference in delays is above the curve of the reference timetable. It slightly climbs when
inserting additional trains. It seems that operational quality deteriorates when using express
freight train paths under the given circumstances of this case study. The improved driving
dynamics do not seem to change this either.
To further analyse the different behaviour of the two traffic planning variants with
(Scen. 5) and without (Scens. 1-4) increased scheduled speed the train-specific delay
differences are presented in Fig. 4. It shows the difference in delays for both the reference
scenario (left) and the express freight train scenario 5 (right). It differentiates between the
train categories.
Figure 4: difference in delays, comparison of scenario 1 (left) and 5 (right).
Here the curve of the long distance trains (orange) is of special importance: While the
difference in delays of the long distance trains is only slightly above the average of all
trains in scenario 1, it decreases massively in scenario 5 (by approx. 30 to 40 seconds). This
means that the long distance trains benefit from the faster freight trains and are able to
reduce their delay. This is understandable, because in case of a preceding freight train the
same will not transfer as much delay to the long distance train behind, as it is running faster
itself. The exact opposite can be observed with the freight trains: Paradoxically, they have a
disadvantage by their higher allowed maximum speed: Their difference in delays rises by
approx. 25 seconds (see blue line, comparing from left to right). This can be explained as
follows: In case of a preceding slower regional train, a higher amount of additional delay is
transferred to the freight train behind than in the reference scenario, because the speed
differences are much higher: The set point and actual value of delay differ more strongly.
The average over all trains (green line) of scenario 5 is slightly higher than in the reference
scenario. This is due to the distribution of train categories: While approx. half of all trains
are freight trains, a much smaller part are long distance trains (even smaller than the share
Preprint version
© 2020 WIT Press, www.witpress.com
ISSN: 2058-8305 (paper format), ISSN: 2058-8313 (online), http://www.witpress.com/journals
DOI: 10.2495/TDI-V4-N3-274-285
Final version see https://www.witpress.com/elibrary/tdi-volumes/4/3/2688of regional trains). For this reason, the case “long distance train succeeds freight train” will
occur more rarely than the case “freight train succeeds regional train”. Hence, the negative
influence explained above outweighs the positive.
5 DISCUSSION AND FURTHER RESEARCH
As a result of our study we conclude that on the one hand, it seems that overall operational
quality can be enhanced by allowing freight trains a higher maximum speed in case of
delay. Hence, the concept described in case A) seems promising. According to the
difference in delays of scenario 2, for example, 60 to 80 additional freight trains could be
inserted into both directions between 6 am and 10 pm (see Fig. 3). This would mean
approx. two additional freight trains per hour and direction. These values are even higher in
scenarios 3 and 4 respectively.
Thus, it can be stated that speed homogeneity and the speed of freight trains does indeed
have a significant influence on the capacity of mixed-traffic rail corridors. With respect to
the seemingly high number of additional freight trains it should, however, be noted that the
microscopic simulation performed in this study concentrated on a freight corridor segment
of approx. 64 km length between Offenburg and Freiburg. In reality, the observed capacity
could be lower given network-intrinsic constraints arising from the harmonisation of train
paths with adjacent line segments. These so-called network effects (see [30]) are not
considered in the present study.
Moreover, full migration is assumed (see below) and free capacity might not only be
used to insert freight trains. Additionally, better operational quality does not necessarily
mean enhanced capacity. Free capacity can also be used to reduce overall delays (see also
[4]). Nevertheless, a positive tendency can be observed. Interestingly, the difference
between scenarios 2, 3 and 4 is comparably small. This requires further analysis of
investments and operational costs that go along with the particular scenarios. Possibly, the
scenario with the highest allowed speed level is not necessarily the optimal choice.
On the other hand, faster freight train operations do not seem to bring advantages per se,
as the results from scenario 5 show. Accordingly, a strictly raised obligatory maximum
speed on express freight train paths slightly deteriorates operational quality. Here the focus
of this paper on heavily occupied mixed-traffic lines is of importance. It can be assumed,
that express freight trains could make use of their advantages significantly better during
night time or in a less occupied infrastructure. Against the background of raising capacity,
however, scenario 5 does not seem to be promising. In this context, further research is
needed. For example the question arises, in which way results would change if freight trains
were given a higher priority. One could argue that a freight train with driving dynamics
similar to an ICE train justifies a similar priority as well. It can be assumed that the
difference in delays of freight trains (and possibly on average over all trains) would be
lower if priorities were changed in this way. This would mean, however, significant
operational disadvantages for regional trains. This was not part of the analysis performed
here but shows that an isolated analysis of headway times is not sufficient for an overall
understanding of capacity.
In addition to the scenarios presented in this paper, a variation of the parameters of the
express freight train will be addressed in further research in form of corresponding
additional scenarios. It can be assumed that especially the parameter of braking deceleration
has significant influence on headway times and thus capacity.
All evaluated scenarios assumed full migration. This means that all freight trains had
the characteristics of the particular scenario. Mixed scenarios, where both faster and
conventional freight trains operate at the same time, were not analysed and therefore are
Preprint version
© 2020 WIT Press, www.witpress.com
ISSN: 2058-8305 (paper format), ISSN: 2058-8313 (online), http://www.witpress.com/journals
DOI: 10.2495/TDI-V4-N3-274-285
Final version see https://www.witpress.com/elibrary/tdi-volumes/4/3/2688part of further research to be done. It can be assumed that the positive effects observed in
case A) would be reduced. This aspect is closely linked to the demand for faster freight
train services. It is hardly conceivable that e.g. heavy-load bulk goods trains operate
according to one of the considered scenarios, as their overall mass is too high. Moreover,
these sorts of transport do not focus on duration but rather on reliability – the demand for
conventional freight trains will remain. It is necessary to rather identify the demand for
express freight, such as in the package delivery sector or with non-durable or chilled goods.
This, however, is not related to the analysis of capacity.
Lastly, additional freight trains do not necessarily mean higher overall transport
capacity. This results from both physical and regulatory restrictions concerning the
operation of faster freight trains. Ultimately, the aim is to raise the amount of goods that
can be transported on railway infrastructure and not per se the number of train paths (in this
case only short trains were operated). For this reason, further research on the transport
capacity of the presented scenarios is required in contrast to other suggestions (such as very
long trains).
ACKNOWLEDGEMENTS
The research performed in this work was part of the the
framework of the Fr8Hub project. This project has
received funding from the Shift2Rail Joint Undertaking
under the European Union´s Horizon 2020 research and innovation programme under grant
agreement No 777402.
REFERENCES
[1] Bundesministerium für Verkehr und digitale Infrastruktur: Masterplan
Schienengüterverkehr, 2017.
https://www.bmvi.de/SharedDocs/DE/Publikationen/StV/masterplan-
schienengueterverkehr.pdf?__blob=publicationFile, Accessed on: 6 May 2020
[2] European Comission: Report from the Commission to the European Parliament and
the Council. Sixth report on monitoring development of the rail market, 2019.
https://ec.europa.eu/transport/sites/transport/files/staff_working_document__6th_rmm
s_report.pdf, Accessed on: 14 May 2020
[3] European Comission: JRC technical reports. Capacity assessment of railway
infrastructure, 2016. doi:10.2791/037759, Accessed on: 14 May 2020
[4] Shift2Rail: Mission and Objectives. https://shift2rail.org/about-shift2rail/mission-and-
objectives/, Accessed on: 11 May 2020
[5] Vromans, M. J.: Reliability of railway systems. Trail thesis series, T2005/7. [Delft:
Netherlands Trail Research School] op. 2005
[6] Abril, M., Barber, F., Ingolotti, L., Salido, M. A., Tormos, P. u. Lova, A.: An
assessment of railway capacity. Transportation Research Part E: Logistics and
Transportation Review 44 (2008) 5, S. 774–806
[7] International Union of Railways: UIC Code 406. [Paris]: UIC, Union Internationale
des Chemins de Fer 2004
[8] Meirich, C.: Berechnung und Bewertung der Gesamtleistungsfähigkeit von
Eisenbahnnetzen. Veröffentlichungen des Verkehrswissenschaftlichen Institutes der
Rheinisch-Westfälischen Technischen Hochschule Aachen, Nr. 69. 2017
[9] Khadem Sameni, M., Landex, A. u. Preston, J.: Developing the UIC 406 Method for
Capacity Analysis. Proceedings for 4th International Seminar on Railway Operations
Research (2011)
Preprint version
© 2020 WIT Press, www.witpress.com
ISSN: 2058-8305 (paper format), ISSN: 2058-8313 (online), http://www.witpress.com/journals
DOI: 10.2495/TDI-V4-N3-274-285
Final version see https://www.witpress.com/elibrary/tdi-volumes/4/3/2688[10] UIC: Influence of ETCS on line capacity. Generic study. Paris: ETF,Editions
techniques ferroviaires 2008
[11] Kontaxi, E. u. Ricci, S.: Railway capacity analysis: methodological framework and
harmonization perspectives. 12th WCTR 2010
[12] Pachl, J.: Systemtechnik des Schienenverkehrs. Bahnbetrieb planen, steuern und
sichern ; mit zahlreichen Tabellen. 2013
[13] Schaer, T.: Anforderungen an eisenbahnbetriebswissenschaftliche Untersuchungen
(EBWU) im Rahmen der Planung und Genehmigung von
Eisenbahninfrastrukturprojekten, 2010. http://ifev.rz.tu-
bs.de/RailAutomation/RA2010/Internet/3_Schaer.pdf, Accessed on: 6 May 2020
[14] Vromans, Michiel J. C. M, Dekker, R. u. Kroon, L. G.: Reliability and heterogeneity
of railway services. ERIM report series research in management Business processes,
logistics and information systems, 2003-090. Rotterdam: ERIM
[15] Schumann, T. u. Mönsters, M.: Energieeinsparung durch Harmonisierung der
Geschwindigkeiten im Soll-Fahrplan. EIK (2016), S. 1–15
[16] Busche, H. u. Schlünß, M.: Takt schlägt Tempo – ICE und „Deutschlandtakt“ ein
Fehler!? Eisenbahntechnische Rundschau (2017) 11, S. 42–46
[17] Berschin, F.: Hamburg – Hannover. Mehrverkehr wäre schon heute möglich. Bahn-
Report (2009) 06, S. 76–78
[18] Shift2Rail Fr8Hub: WP3: Real time network management and simulation of
increasing speed for freight trains. Deliverable 3.1 State-of-the-art and specification of
innovations, demonstrations and simulations. 2018
[19] Troche, G.: High-speed rail freight. Sub-report in efficient train systems for freight
transport. Report / KTH Railway Group, Bd. 0512. Stockholm: Järnvägsgruppen,
Kungliga tekniska högskolan (KTH) 2005
[20] dybas: Güterwagen der DB AG. Drehgestell-Containertragwagen.
https://www.dybas.de/dybas/gw/gw_s_7/g703.html, Accessed on: 6 May 2020
[21] Forschungs-Informations-System: InterCargoExpress, 2012.
https://www.forschungsinformationssystem.de/servlet/is/402142/, Accessed on: 6 May
2020
[22] DB NETZ AG: Richtlinie 405 Fahrwegkapazität. (idF v. 13. 2. 2009)
[23] DB NETZ AG: Richtlinie 402 Trassenmanagement. (idF v. 1. 4. 2006)
[24] Martin, Ullrich. Li, Xiaojun. Nachtigall, Karlin: Anforderungsgerechte
Trassenstrukturen und deren Belegung im Netz von Schienenbahnen - Atrans. [S.l.]:
books in demand 2020
[25] Heister, G.: Eisenbahnbetriebstechnologie. DB-Fachbuch. Heidelberg u.a.: Eisenbahn-
Fachverl 2006
[26] Bundesministerium für Verkehr und digitale Infrastruktur: Korridormanagement.
Rhein - Alpen. https://www.bmvi.de/SharedDocs/DE/Artikel/G/transeuropaeische-
verkehrsnetze-korridormanagement.html, Accessed on: 5 May 2020
[27] OpenRailwayMap: map layout: OpenRailwayMap; map data: OpenStreetMap ©
OpenStreetMap-Contributors, www.openstreetmap.org/copyright.
https://www.openrailwaymap.org/, Accessed on: 11 May 2020
[28] Eisenbahn-Bundesamt: Lärm-Monitoring. Schallmessungen im Schienenverkehr. URL
https://www.laerm-monitoring.de/zug?mp=16, Accessed on: 5 May 2020
[29] Deutsche Bahn AG: Elektronisches Kursbuch.
http://kursbuch.bahn.de/hafas/kbview.exe, Accessed on: 5 May 2020
[30] Landex, A.: Network effects in railways. WIT Press 2012
Preprint version
© 2020 WIT Press, www.witpress.com
ISSN: 2058-8305 (paper format), ISSN: 2058-8313 (online), http://www.witpress.com/journals
DOI: 10.2495/TDI-V4-N3-274-285
Final version see https://www.witpress.com/elibrary/tdi-volumes/4/3/2688You can also read