Econophysics of cryptocurrency crashes: an overview - SHS Web of ...
←
→
Page content transcription
If your browser does not render page correctly, please read the page content below
SHS Web of Conferences 107, 03001 (2021)                                                                 https://doi.org/10.1051/shsconf/202110703001
M3E2 2021

      Econophysics of cryptocurrency crashes: an overview

      Andrii Bielinskyi1,∗ , Oleksandr Serdyuk2,∗∗ , Serhiy Semerikov1,3,4,5,∗∗∗ , and Vladimir Soloviev1,2,∗∗∗∗
      1
        Kryvyi Rih State Pedagogical University, 54 Gagarin Ave., Kryvyi Rih, 50086, Ukraine
      2
        The Bohdan Khmelnytsky National University of Cherkasy, 81 Shevchenko Blvd., Cherkasy, 18031, Ukraine
      3
        Kryvyi Rih National University, 11 Vitalii Matusevych Str., Kryvyi Rih, 50027, Ukraine
      4
        Institute of Information Technologies and Learning Tools of the NAES of Ukraine, 9 M. Berlynskoho Str., Kyiv, 04060, Ukraine
      5
        University of Educational Management, 52-A Sichovykh Striltsiv Str., Kyiv, 04053, Ukraine

                      Abstract. Cryptocurrencies refer to a type of digital asset that uses distributed ledger, or blockchain technology
                      to enable a secure transaction. Like other financial assets, they show signs of complex systems built from a large
                      number of nonlinearly interacting constituents, which exhibits collective behavior and, due to an exchange of
                      energy or information with the environment, can easily modify its internal structure and patterns of activity. We
                      review the econophysics analysis methods and models adopted in or invented for financial time series and their
                      subtle properties, which are applicable to time series in other disciplines. Quantitative measures of complexity
                      have been proposed, classified, and adapted to the cryptocurrency market. Their behavior in the face of critical
                      events and known cryptocurrency market crashes has been analyzed. It has been shown that most of these
                      measures behave characteristically in the periods preceding the critical event. Therefore, it is possible to build
                      indicators-precursors of crisis phenomena in the cryptocurrency market.

      1 Introduction                                                             work structure, or one way or another can be reduced to
                                                                                 the network. The theory of complex networks studies the
      The instability of global financial systems concerning nor-                characteristics of networks, taking into account not only
      mal and natural disturbances of the modern market and                      their topology but also statistical properties, the distribu-
      the presence of poorly foreseeable financial crashes indi-                 tion of weights of individual nodes and edges, the effects
      cate, first of all, the crisis of the methodology of modeling,             of dissemination of information, robustness, etc. [1–4, 24–
      forecasting, and interpretation of modern socio-economic                   26].
      realities. The doctrine of the unity of the scientific method
                                                                                     Complex systems consist of a plurality of interacting
      states that for the study of events in socio-economic sys-
                                                                                 agents possessing the ability to generate new qualities at
      tems, the same methods and criteria as those used in the
                                                                                 the level of macroscopic collective behavior, the manifes-
      study of natural phenomena are applicable. Rapidly evolv-
                                                                                 tation of which is the spontaneous formation of notice-
      ing coronavirus pandemic brings a devastating effect on
                                                                                 able temporal, spatial, or functional structures [27–32]. As
      the entire world and its economy as a whole [1–7]. Fur-
                                                                                 simulation processes, the application of quantitative meth-
      ther instability related to COVID-19 will negatively af-
                                                                                 ods involves measurement procedures, where importance
      fect not only on companies and financial markets, but also
                                                                                 is given to complexity measures. Prigogine notes that the
      on traders and investors that have been interested in sav-
                                                                                 concepts of simplicity and complexity are relativized in
      ing their investment, minimizing risks, and making deci-
                                                                                 the pluralism of the descriptions of languages, which also
      sions such as how to manage their resources, how much
                                                                                 determines the plurality of approaches to the quantitative
      to consume and save, when to buy or sell stocks, etc., and
                                                                                 description of the complexity phenomenon [5].
      these decisions depend on the expectation of when to ex-
      pect next critical change [8–21]. Despite the complexity of                    Financial markets have been attracting the attention
      the problem, the results of recent studies indicate that sig-              of many scientists like engineers, mathematicians, physi-
      nificant success has been achieved within the framework                    cists, and others for the last two decades. Such vast inter-
      of interdisciplinary approaches, and the theory of self-                   est transformed into a branch of statistical mechanics -–
      organization – synergetics [22, 23]. The modern paradigm                   econophysics [30–34]. Physics, economics, finance, so-
      of synergetics is a complex paradigm associated with the                   ciology, mathematics, engineering, and computer science
      possibility of direct numerical simulation of the processes                are fields which, as a result of cross-fertilization, have cre-
      of complex systems evolution, most of which have a net-                    ated the multi-, cross-, and interdisciplinary areas of sci-
          ∗ e-mail:
                                                                                 ence and research such as econophysics and sociophysics,
                      krivogame@gmail.com
         ∗∗ e-mail:   serdyuk@ukr.net
                                                                                 thriving in the last two and a half decades. These mixed re-
        ∗∗∗ e-mail:   semerikov@gmail.com                                        search fields use knowledge, methodologies, methods, and
       ∗∗∗∗ e-mail:   vnsoloviev2016@gmail.com                                   tools of physics for modeling, explaining and forecasting

© The Authors, published by EDP Sciences. This is an open access article distributed under the terms of the Creative Commons Attribution License 4.0
(http://creativecommons.org/licenses/by/4.0/).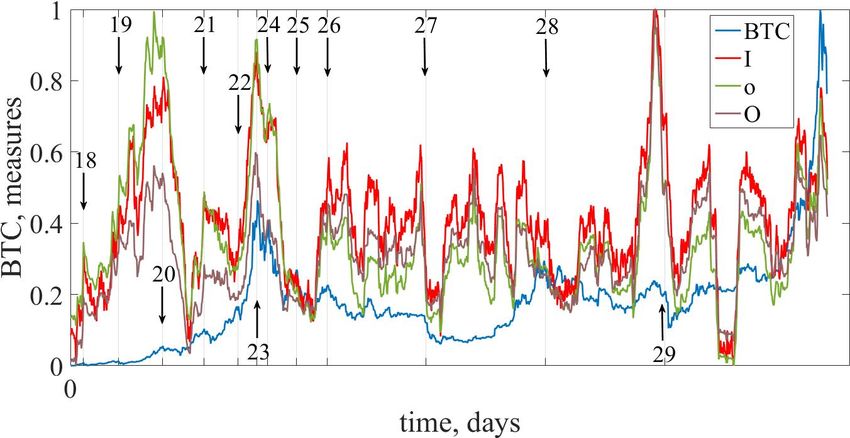
SHS Web of Conferences 107, 03001 (2021)                                                        https://doi.org/10.1051/shsconf/202110703001
M3E2 2021

     economic, social phenomena, and processes. Accordingly,             crashes must change. This should signal the correspond-
     econophysics is an interdisciplinary research field, apply-         ing degree of complexity if they are able to quantify cer-
     ing theories and methods originally developed by physi-             tain patterns of a complex system. A significant advantage
     cists to solve problems in economics, usually those includ-         of the introduced measures is their dynamism, that is, the
     ing uncertainty or stochastic processes, nonlinear dynam-           ability to monitor the change in time of the chosen measure
     ics, and evolutionary games.                                        and compare it with the corresponding dynamics of the
          There are deep relationships (as well as crucial differ-       output time series. This allowed us to compare the critical
     ences) between physics and finance [35] that have inspired          changes in the dynamics of the system, which is described
     generations of physicists as well as economists. In gen-            by the time series, with the characteristic changes of con-
     eral, physicists apprehend financial markets as complex             crete measures of complexity. It turned out that quantita-
     systems and, as such, they conducted numerous scientific            tive measures of complexity respond to critical changes in
     investigations [36].                                                the dynamics of a complex system, which allows them to
          Though statistical physics cannot get along without            be used in the diagnostic process and prediction of future
     quantum-mechanical ideas and notions in its fundamen-               changes.
     tals, the main sphere of its interest is the macroscopic                The cryptocurrency market is a complex, self-
     description of systems with a large number of particles,            organized system, which in most cases can be considered
     the dynamic behavior of which can’t be brought to mi-               either as a complex network of market agents or as an inte-
     croscopic dynamical equations of quantum mechanics fig-             grated output signal of this network – a time series, for ex-
     ured out for separate particles without the use of respective       ample, prices of individual cryptocurrency. The research
     statistical postulates [37]. During last years an increas-          on cryptocurrency price fluctuations being carried out in-
     ing flow of works was observed, in which detailed models            ternationally is complicated due to the interplay of many
     of market process participants interactions and quantum-            factors – including market supply and demand, the US
     mechanical analogies, notions, and terminology based on             dollar exchange rate, stock market state, the influence of
     methods of describing socio-economic systems are drawn              crime, shadow market, and fiat money regulator pressure
     to explain both particular peculiarities of modern market           that introduces a high level of noise into the cryptocur-
     dynamics and economic functioning in whole [38–40]. In              rency data. Moreover, in the cryptocurrency market, to
     papers [41, 42], Soloviev and Saptsin have suggested a              some extent, blockchain technology is tested in general.
     new paradigm of complex systems modeling based on the               Hence, the cryptocurrency prices exhibit such complex
     ideas of quantum as well as relativistic mechanics. It has          volatility characteristics as nonlinearity and uncertainty,
     been revealed that the use of quantum-mechanical analo-             which are difficult to forecast, and any obtained results are
     gies (such as the uncertainty principle, the notion of the          uncertain. Therefore, cryptocurrency price prediction re-
     operator, and quantum measurement interpretation) can be            mains a huge challenge [44–58].
     applied for describing socio-economic processes.                        As can be seen, markets have seen significant num-
          In this review, we will continue to study Prigogine’s          bers of investors selling off and rebalancing their portfolios
     manifestations of the system complexity, using the current          with less risky assets. That has been leading to large losses
     methods of quantitative analysis to determine the appro-            and high volatility, typical of crisis periods. The econ-
     priate measures of complexity. The proposed measures of             omy key for preventing such activity may lie in cryptocur-
     complexity, depending on the methodology and construc-              rency and constructing effective indicators of possible crit-
     tion methods, can be divided into the following classes:            ical states that will help investors and traders fill in safety.
                                                                         Bitcoin, which is associated with the whole crypto market,
     (1) informational,                                                  has such properties as detachment and independence from
     (2) (multi-)fractal,                                                the standard financial market and the proclaimed proper-
                                                                         ties that should make it serve as the digital gold [59]. As
     (3) chaos-dynamic,                                                  was shown by Kristoufek [60], Bitcoin promises to be a
                                                                         safe-haven asset with its low correlation with gold, S&P
     (4) recurrent,
                                                                         500, Dow Jones Industrial Average, and other authorita-
     (5) irreversible,                                                   tive stock indices even in the extreme events. But authors
                                                                         please not overestimate the cryptocurrency since accord-
     (6) based on complex networks,                                      ing to their calculations and, obviously, the current struc-
     (7) quantum.                                                        ture of the system, gold remains more significant. But for
                                                                         ten years, this token has been discussed by many people, it
          Econophysics, based on a rich arsenal of research on           has experienced a lot in such a short period, many people
     critical phenomena [43], very successfully copes with the           believe in it, and it has managed to form a fairly com-
     description of similar events in economics and finance.             plex and self-organized system. The integrated actions
     These are crises and crashes that are constantly shaking            from real-world merge in such dynamics and relevant in-
     the world economy. The introduced measures of complex-              formation that is encoded in Bitcoin’s time series can be
     ity should, to one degree or another, respond to such phe-          extracted [61–63]. In the context of volatile financial mar-
     nomena.                                                             kets, it is important to select such measures of complexity
          The key idea here is the hypothesis that the complexity        that will be able to notify us of upcoming abnormal events
     of the system before the crashes and the actual periods of          in the form of crises at an early stage.

                                                                     2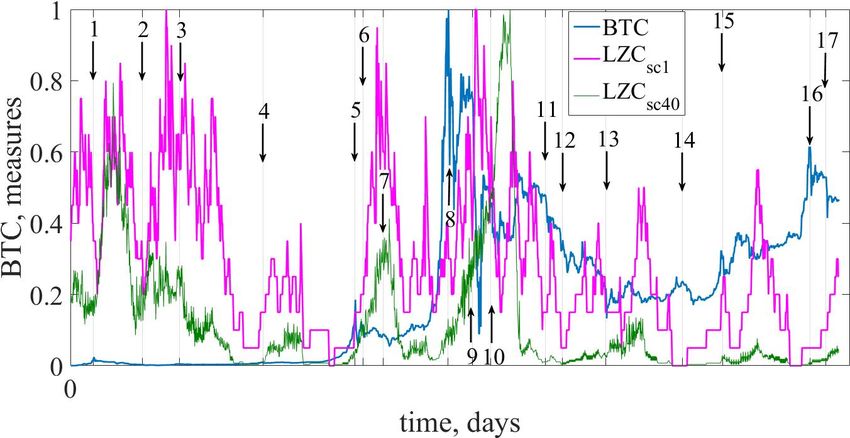
SHS Web of Conferences 107, 03001 (2021)                                                         https://doi.org/10.1051/shsconf/202110703001
M3E2 2021

         In this review we:
     • present such measures;
     • study critical and crash phenomena that have taken place
       in the cryptocurrency market;
     • try to understand whether crashes and critical events
       could be identified and predicted by such informative
       indicators or not.
         This review is dedicated to the construction of such in-
     dicators based on the theory of complexity. According to
     our goals and actions, the paper is structured as follows. In
     Section 2, we present our classification of Bitcoin’s crises          Figure 1: Bitcoin price development from July 16, 2010 to
     for the period from July 16, 2010 to January 21, 2021. In             January 21, 2021
     Section 3, we describe the information measures of com-
     plexity. In Section 4, we describe the multifractal analysis
     methodology and its results for the crypto market. Section
     5 defines what is chaos-based measures of complexity. In
                                                                           there are various research works on what crashes are and
     section 6, we deal with the recurrence quantification anal-
                                                                           how to classify such risk events in the market. The defini-
     ysis of critical and crisis phenomena in the cryptocurrency
                                                                           tion of these events still has been debatable. Nevertheless,
     market. Irreversible measure based on permutation pat-
                                                                           the proposals of most authors have common elements that
     terns is defined in Section 7. Section 8 presents the theory
                                                                           allow us to arrive at a consensus. Generally, the market
     and empirical results on network and multiplex measures
                                                                           crash is a sudden drastic decline in the prices of financial
     of complexity and their robustness for digital currencies.
                                                                           assets in a specific market [67]. Additionally, the applied
     Section 9 defines quantum complexity measures, the fea-
                                                                           model for a specific market takes an important place in
     tures of their manifestation on the crypto market are dis-
                                                                           the definition of “drastic decline”. For instance, Wang et
     cussed. Section 10 contains conclusions and some recom-
                                                                           al. [67] take into account events with a minimum one-day
     mendations for further research.
                                                                           decrease of 5% in the stock returns. These authors [26]
                                                                           identify financial crashes as a decrease of 25% or less of
     2 Data and classification                                             multi-year financial returns. Lleo and Ziembda [68] define
                                                                           a crash as a specific event of a day, which decreasing clos-
     Bitcoin, being the most capitalized cryptocurrency, as a              ing price exceeds a fall of 10% between the highest and the
     rule, sets and determines the main trends of the crypto               lowest value of the stock index in a year. Hong and Stein
     market as a whole. Therefore, except for the part of the              [69] postulate that the market crash is an unexpected event
     work where the study of collective processes in the mar-              in which appearance was not accompanied by any finan-
     ket is carried out, we will use the time series of Bitcoin            cial news. Moreover, the price change during this event
     [64]. From figure 1 it can be seen that at the beginning              is rather negative. Also, it is worth mentioning the study
     of its existence, Bitcoin’s dynamic was determined mainly             of Min Shu and Wei Zhu [70] where their classification
     by the processes of the formation of the market as a whole            of crashes included almost 50 crashes. It remains a lit-
     and characterized by high volatility, which, however, was             tle unclear which factors influence their choice of such an
     not associated with critical phenomena. Bariviera et al.              enormous amount of crashes in such a short period. Re-
     [65] find that the Hurt exponent changes significantly dur-           searchers emphasize these drops as such, with a fall of
     ing the first years of existence of Bitcoin, and now it is less       more than 15% and a duration of fewer than three weeks.
     unstable than before. Moreover, they detect more evidence             Nevertheless, regarding this classification, we are going to
     of information since 2014 [66].                                       emphasize the most relevant, where the complexity of the
          Being historically proven, popular, and widely used              index started to decrease and whose initial deviation from
     cryptocurrency for the whole existence of cryptocurren-               regular behavior was noticeable in advance. Nowadays
     cies in general, Bitcoin began to produce a lot of news and           some people proclaim Bitcoin as a “digital gold”. Gold
     speculation, which began to determine its future life. Sim-           as a material has served for jewelry and art as well as elec-
     ilar discussions began to lead to different kinds of crashes,         tronic or medical components. Limited supply and current
     critical events, and bubbles, which professional investors            acceptance of Bitcoin as a “digital gold” may erect it to
     and inexperienced users began to fear. Thus, we advanced              the same level as gold. While some people back up Bit-
     into action and set the tasks:                                        coin‘s advantage, demonstrating its similarities with those
     • classification of such critical events and crashes;                 of gold and silver [71], others argue that it is the new
                                                                           digital coin [72] due to its high volatility and unclear fu-
     • construction of such indicators that will predict crashes,          ture development. However, researchers find its potential
       critical events in order to allow investors and ordinary            benefits during extreme market periods and provide a set
       users to work in this market.                                       of stylized factors that claim to be successful long-short
        Accordingly, during this period in the Bitcoin market,             strategies that generate sizable and statistically significant
     many crashes and critical events shook it. At the moment,             excess returns [73]. Despite volatile swings and many crit-

                                                                       3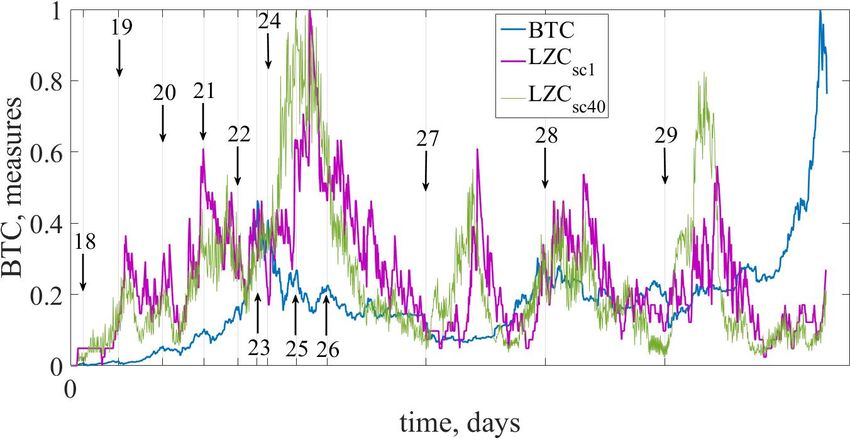
SHS Web of Conferences 107, 03001 (2021) https://doi.org/10.1051/shsconf/202110703001
M3E2 2021
ics, Bitcoin has emerged and attracted much more confi- foundation of our classification for crashes, as it has been
dence. These studies [74, 75] consider that measures of fi- mentioned already. All the rest events are critical. These
nancial and macroeconomic activity can be drivers of Bit- characteristics serve as indicators of crashes and critical
coin returns. Reviewing papers of the researches above, events as they react only at the moment of the above-
the experience of others and our own [76–85], we have re- mentioned phenomena and do not allow identifying the
vised our classification of such leaps and falls, relying on corresponding abnormal phenomena in advance. In con-
Bitcoin time series during the entire period (01.01.2011- trast, most of the indicators described below will respond
21.01.2021) of verifiable fixed daily values of the Bitcoin to critical changes and crashes in advance. It enables them
price (BTC) (https://finance.yahoo.com/cryptocurrencies). to be used as indicators – precursors of such phenomena.
We emphasize that Calculations were carried out within the framework
• crashes are short and time-localized drops that last ap- of the algorithm of a rolling (sliding, moving) window.
proximately two weeks, with the weighty losing of price For this purpose, the part of the time series (window), for
each day. Their volatility is high. In percentage term, which there were calculated measures of complexity, was
their decline exceeds 30 percent, and normalized returns selected, then the window was displaced along with the
proceed ±3σ or near to it; time series in a predefined value, and the procedure re-
peated until all the studied series had exhausted. Further,
• critical events are those falls that, during their existence,
comparing the dynamics of the actual time series and the
have not had such massive changes in price as crashes.
corresponding measures of complexity, we can judge the
Relying on these considerations, we emphasize 29 pe- characteristic changes in the dynamics of the behavior of
riods on Bitcoin time series, relying on normalized returns complexity with changes in the cryptocurrency. If this or
and volatility, where returns are calculated as that measure of complexity behaves in a definite way for
all periods of crashes, for example, decreases or increases
G(t) = ln x(t + ∆t) − ln x(t) [x(t + ∆t) − x(t)]/x(t) (1)
during the pre-crashes or pre-critical period, then it can
and normalized (standardized) returns as serve as their indicator or precursor.
Calculations of measures of complexity were carried
g(t) [G(t) − hGi] /σ, (2) out both for the entire time series, and for a fragment of
the time series localizing some of the emphasized crashes
where σ ≡ hG2 i − hGi2 is the standard deviation of G,
p
and critical events. In the latter case, fragments of time
∆t is time lag (in our case ∆t = 1), and h . . . i denotes the series of the same length with fixed points of the onset
average over the time period under study and volatility as of crashes or critical events were selected and the results
t+n−1
of calculations of complexity measures were compared to
1 X verify the universality of the indicators. Following some
VT (t) = g(t0 )
n t0 = t described below procedures such time localization as, ex-
ample, of length 100 or 200, either won‘t make any sense,
From the mentioned stylized facts on BTC dynamics, or won‘t be possible as some of them are sensitive to time
it was noticed how considerably it started to change near localization, or require a longer length of the time series
2014. To gain a deeper understanding of its existence in as it is required by the procedure for better accuracy of
the starting period, we divided the BTC time series into further calculations
two periods: (01.01.2011-31.08.2016) and (01.09.2016-
21.01.2021). More detailed information about crises,
crashes, and their classification under these definitions is
3 Informational measures of complexity
given in table 1 and table 2.
Therefore, according to our classification crisis periods
with numbers (1, 2, 4-6, 8, 9, 13, 18, 23-25, 27, 29) are Complexity is a multifaceted concept, related to the degree
crashes, all the rest – critical events. of organization of systems. Patterns of complex organi-
Figure 2 confirms the importance of dividing the BTC zation and behavior are identified in all kinds of systems
time series in order to observe its dynamics in more detail. in nature and technology. Essential for the characteriza-
However, as it can be seen, we could separate time series tion of complexity is its quantification, the introduction of
in much deeper time scales. complexity measures, or descriptors [86].
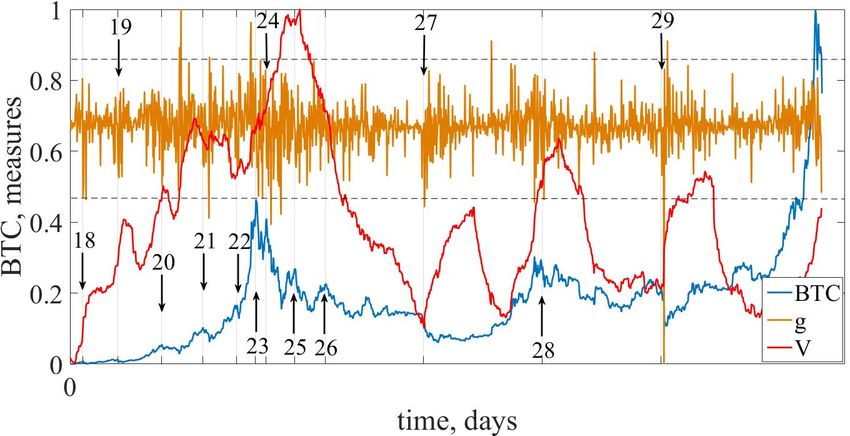
In figure 3 output Bitcoin time series for the first We may speak of the complexity of a structure, mean-
and the second periods, their normalized returns g(t), and ing the amount of information (number of bits) of the
volatility VT (t) calculated for the window of size 100 are structure; this is the minimum space we need to store
presented. enough information about the structure that allows us its
From figure 3 we can see that during periods of crashes reconstruction. We may also speak of the algorithmic
and critical events normalized returns g increases consid- complexity of a certain task: this is the minimum time
erably in some cases beyond the limits ±3σ. This indicates (or other computational resources) needed to carry out this
deviation from the normal law of distribution, the pres- task on a computer. And we may also speak of the com-
ence of the “heavy tails” in the distribution g, which are munication complexity of tasks involving more than one
characteristics of abnormal phenomena in the market. At processor: this is the number of bits that have to be trans-
the same time volatility also grows. Such qualities are the mitted in solving this task [87–89].
4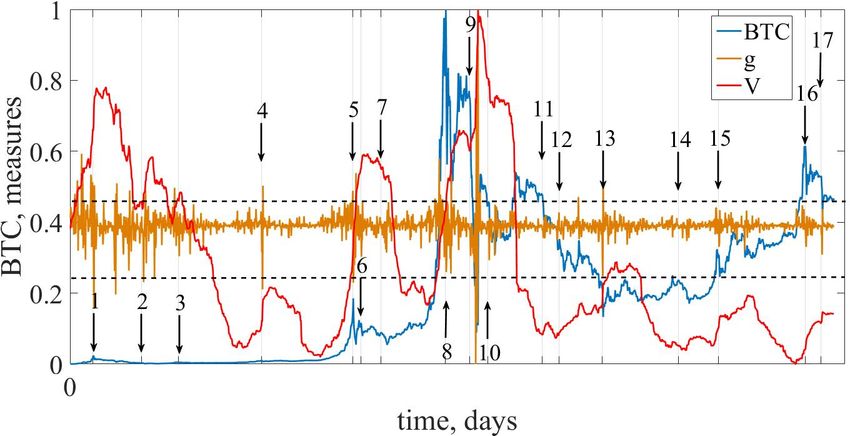
SHS Web of Conferences 107, 03001 (2021)                                                    https://doi.org/10.1051/shsconf/202110703001
M3E2 2021

                       Table 1: List of Bitcoin major crashes and critical events since June 2011 till July 2016

                                                   Days in      Bitcoin High     Bitcoin Low      Decline,    Decline,
                  №             Name
                                                  correction      Price, $         Price, $         %            $
                  1    07.06.2011-10.06.2011           3            29.60            14.65          50         14.95
                  2    11.10.2011-18.10.2011           7             4.15            2.27           45          1.88
                  3    15.01.2012-16.02.2012          32             7.00            4.27           39          2.73
                  4    15.08.2012-18.08.2012           3            13.50            8.00           40          5.50
                  5    08.04.2013-15.04.2013           7           230.00            68.36          70        161.64
                  6    28.04.2013-02.05.2013           4           144.00            98.09          32         45.91
                  7    19.06.2013-04.07.2013          15           111.29            68.50          38         42.79
                  8    04.12.2013-07.12.2013           3          1237.66           697.02          44        540.64
                  9    05.02.2014-21.02.2014          16           904.52           111.55          88        792.97
                  10   24.03.2014-09.04.2014          17           567.56           384.63          32        182.93
                  11   09.08.2014-17.08.2014           8           592.06           462.18          22        129.88
                  12   22.09.2014-04.10.2014          12           436.86           322.86          26        114.00
                  13   12.01.2015-14.01.2015           2           269.33           164.92          39        104.41
                  14   27.07.2015-23.08.2015          27           293.70           211.43          28         82.27
                  15   09.11.2015-11.11.2015           2           380.22           304.71          28         75.51
                  16   18.06.2016-21.06.2016           3           761.04           590.56          22        170.48
                  17   29.07.2016-01.08.2016           3           654.74           513.43          24        141.31

                   Table 2: List of Bitcoin major crashes and critical events since January 2017 till March 2020

                                                   Days in     Bitcoin High      Bitcoin Low     Decline,    Decline,
                 №              Name
                                                  correction     Price, $          Price, $        %             $
                 18    04.01.2017-11.01.2017          7          1135.41            785.42         30          349.99
                 19    15.03.2017-18.03.2017          3          1253.43            971.38         23          282.05
                 20    10.06.2017-15.07.2017          35         2973.44           1914.09         36         1059.35
                 21    31.08.2017-13.09.2017          13         4921.85           3243.08         34         1678.77
                 22    08.11.2017-12.11.2017          4          7444.36           5878.13         21         1566.23
                 23    16.12.2017-30.12.2017          14        19345.49          12531.52         35         6813.97
                 24    06.01.2018-05.02.2018          30        17172.30           6937.08         60        10235.22
                 25    04.03.2018-05.04.2018          33        11504.42           6634.86         42         4869.56
                 26    04.05.2018-27.05.2018          23         9845.90           7118.88         28         2727.02
                 27    18.11.2018-15.12.2018          27         5615.26           3232.51         42         2382.75
                 28    12.07.2019-16.07.2019          4         11797.37           9423.44         20         2373.93
                 29    06.03.2020-16.03.2020          10         9122.55           5014.48         45         4108.07

        Historically, the first attempt to quantify complexity         cursor of crisis phenomena in the cryptocurrency market
     was based on Shannon’s information theory [90] and Kol-           [2, 79, 95, 96].
     mogorov complexity [91].
                                                                           Historically, the first LZC measure system studies for
                                                                       financial time series were conducted by S Da Silva et al.
     3.1 Lempel-Ziv complexity                                         [96–99]. They considered the deviation of LZC from that
                                                                       value for a random time series as a measure of actual
     Lempel-Ziv complexity (LZC) is a classical measure that,          market efficiency in absolute [95, 96, 98, 99] or relative
     for ergodic sources, relates the concepts of complexity (in       [97] terms. Using this approach authors were able to de-
     the Kolmogorov-Chaitin sense), and entropy rate [92, 93].         tect decreases in efficiency rates of the major stocks listed
     For an ergodic dynamical process, the amount of new in-           on the Sao Paulo Stock Exchange in the aftermath of the
     formation gained per unit of time (entropy rate) can be           2008 financial crisis [98]. In [100], authors have surveyed
     estimated by measuring the capacity of this source to gen-        the principal applications of algorithmic (Kolmogorov)
     erate new patterns (LZC). Because of the simplicity of the        complexity to the problem of financial price motions and
     LZC method, the entropy rate can be estimated from a sin-         showed the relevance of the algorithmic framework to
     gle discrete sequence of measurements with a low compu-           structure tracking in finance. Some empirical results are
     tational cost [94].                                               also provided to illustrate the power of the proposed es-
         In this paper, we show that the LZC measure can be            timators to take into account patterns in stock returns. In
     just such a measure of complexity, which is an early pre-         paper [101] was proposed a generic methodology to esti-

                                                                   5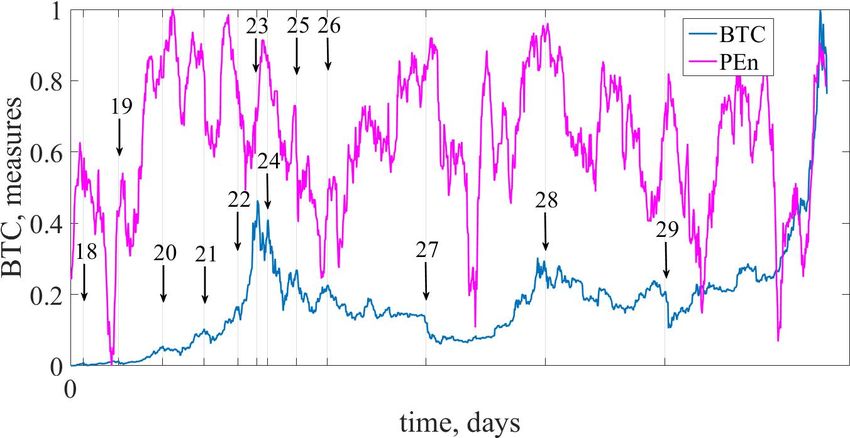
SHS Web of Conferences 107, 03001 (2021)                                                      https://doi.org/10.1051/shsconf/202110703001
M3E2 2021

        Figure 2: The dynamics of the daily values of the BTC price. The inset shows 1-4 crisis periods presented in table 1.

     mate the Kolmogorov complexity of financial returns. Ex-           plane is employed in order to explore disorder and com-
     amples are given with simulated data that illustrate the ad-       plexity in the space of cryptocurrencies [104]. They are
     vantages of our algorithmic method: among others, some             found to exist in distinct planar locations in the represen-
     regularities that cannot be detected with statistical meth-        tation space, ranging from structured to stochastic-like be-
     ods can be revealed by compression tools. Applying com-            havior.
     pression algorithms to daily returns of the Dow Jones In-              A brief analysis of the problem indicates that so far,
     dustrial Average (DJIA), the authors concluded on an ex-           the Lempel-Ziv informational measure of the complexity
     tremely high Kolmogorov complexity and by doing so,                has not been used to study the stability and behavior of
     proposed another empirical observation supporting the im-          the cryptocurrency market in a crisis. In this section, we
     possibility to outperform the market. The structural com-          use the Lempel-Ziv complexity measure to study the cryp-
     plexity of time series describing returns on New York’s            tocurrency market. Using the example of the most capital-
     and Warsaw’s stock exchanges was studied using two esti-           ized cryptocurrency – Bitcoin – we demonstrate the ability
     mates of the Shannon entropy rate based on the Lepel-Ziv           to identify the dynamics of varying complexity. Particu-
     and Context Tree Weighting algorithms [102]. Such struc-           larly relevant is the identification of the characteristic be-
     tural complexity of the time series can be used as a mea-          havior of Bitcoin during the crisis phases of market behav-
     sure of the internal (modelless) predictability of the main        ior. By observing the dynamics of the Lempel-Ziv mea-
     pricing processes and testing the hypothesis of an efficient       sure, precursors of crisis phenomena can be constructed
     market. Somewhat surprisingly, the results of [103], in            [105].
     which the authors computed the LZC from two compos-
     ite stock indices, the Shanghai stock exchange composite
                                                                        3.1.1 The concept of Kolmogorov complexity
     index (SSE) and the DJIA, for both low-frequency (daily)
     and high-frequency (minute-to-minute) stock index data.
                                                                        Let us begin with the well-known degree of complexity
     The calculation results indicate that that the US market           proposed by Kolmogorov [106]. The concept of Kol-
     is basically fully random and consistent with the efficient        mogorov complexity (or, as they say, algorithmic entropy)
     market hypothesis (EMH), irrespective of whether low- or           emerged in the 1960s at the intersection of algorithm the-
     high-frequency stock index data are used. The Chinese              ory, information theory, and probability theory. A. Kol-
     market is also largely consistent with the EMH when low-           mogorov’s idea was to measure the amount of informa-
     frequency data are used. However, a completely different
                                                                        tion contained in individual finite objects (rather than ran-
     picture emerges when the high-frequency stock index data           dom variables, as in the Shannon theory of information). It
     are used. H. Cao and Y. Li [104] presents a novel method           turned out to be possible (though only to a limited extent).
     for measuring the complexity of a time series by unravel-          A. Kolmogorov proposed to measure the amount of infor-
     ing a chaotic attractor modeled on complex networks. The           mation in finite objects using algorithm theory, defining
     complexity index, which can potentially be exploited for           the complexity of an object as the minimum length of the
     prediction, has a similar meaning to the LZC and is an ap-
                                                                        program that generates that object. This definition is the
     propriate measure of a series’ complexity. The proposed            basis of algorithmic information theory as well as algo-
     method is used to research the complexity of the world’s           rithmic probability theory: an object is considered random
     major capital markets. The almost absent sensitivity of the        if its complexity is close to maximum.
     LZC to fluctuations in the time series indicates most likely
                                                                             What is the Kolmogorov complexity and how to mea-
     errors in the calculation algorithm during the transforma-
                                                                        sure it? In practice, we often encounter programs that
     tion of the time series. The complexity–entropy causality
                                                                        compress files (to save space in the archive). The most

                                                                    6
SHS Web of Conferences 107, 03001 (2021)                                                         https://doi.org/10.1051/shsconf/202110703001
M3E2 2021

                                                                      (a)

                                                                      (b)

     Figure 3: The standardized dynamics, returns g(t), and volatility VT (t) of BTC/USD daily values for first (a) and second
     (b) periods. Horizontal dotted lines indicate the ±3σ borders. The arrows indicate the beginning of one of the crashes or
     the critical events

     common are called zip, gzip, compress, rar, arj, and oth-              description D:
     ers. Applying such a program to some file (with text, data,
     program), we get its compressed version (which is usually                            KS D (x) = min{l(y) | D(y) = x}
     shorter than the original file). After that, you can restore
     the original file using the paired program “decompressor”.             where l(y) denotes the length of the word. The index
     Therefore, approximately, the Kolmogorov complexity of                 D emphasizes that the definition depends on the chosen
     a file can be described as the length of its compressed ver-           method D. It can be shown that there are optimal meth-
     sion. Thus, a file that has a regular structure and is well            ods of description. The better the description method, the
     compressed has a small Kolmogorov complexity (com-                     shorter it is. Therefore, it is natural to make the following
     pared to its length). On the contrary, a badly compressed              definition: the method D1 is no worse than the method D2
     file has a complexity close to its length.                             if
                                                                                                KS D1 ≤ KS D2 (x) + c
                                                                            for some c and all x.
         Suppose we have a fixed method of description (de-                     Thus, according to Kolmogorov, the complexity of an
     compressor) D. For this word x, we consider all its de-                object (for example, the text is a sequence of characters) is
     scriptions, i.e., all words y for which D(y) it is defined and         the length of the minimum program that outputs the text,
     equal to x. The length of the shortest of them is called               and entropy is the complexity that is divided by the length
     the Kolmogorov complexity of the word x in this way of                 of the text. Unfortunately, this definition is purely spec-

                                                                      7
SHS Web of Conferences 107, 03001 (2021) https://doi.org/10.1051/shsconf/202110703001
M3E2 2021
ulative. There is no reliable way of identifying this pro- of structure. Such fragments are detected by calculating
gram uniquely, but there are algorithms that are actually local complexity within variable-length windows that slide
just trying to calculate the Kolmogorov complexity of text along a sequence. Curves of change of local complexity
and entropy. along a sequence are called complex profiles. A set of
A universal (in the sense of applicability to different profiles for different window sizes reveals the boundaries
language systems) measure of the complexity of the fi- of anomalous fragments and their relationship.
nite character sequence was suggested by Lempel and Ziv We will find the LZC complexity for the time series,
[100]. As part of their approach, the complexity of a se- which is, for example, the daily values of the cryptocur-
quence is estimated by the number of steps in the process rency price x(t). To investigate the dynamics of LZC and
that gives rise to it. compare it with cryptocurrency prices, we will find this
Acceptable (editorial) operations are: a) character gen- measure of complexity for a fixed length (window) con-
eration (required at least for the synthesis of alphabet el- tract. To do this, we calculate the logarithmic returns ac-
ements) and b) copying the “finished” fragment from the cordingly to equation (1) and turn them into a sequence of
prehistory (i.e. from the already synthesized part of the bits.
text). You can specify the number of states that are differen-
Let be Σ a complete alphabet, S – text (a sequence of tiated (calculus system). Yes, for two different states we
characters) composed of elements Σ; S [i] – ith text sym- have 0, 1, for three – 0, 1, 2, etc. In the case of three states,
bol; S [i : j] – a snippet of text from the ith to jth character unlike the binary coding system, a certain threshold σ is
inclusive (i < j); N = |S | – length of text S . Then the set and the states g are coded as follows [96, 98, 99]:
sequence synthesis scheme can be represented as a con-
catenation
0 if g < −σ,
g=
1 if −b ≤ g ≤ b,
H(S ) = S [1 : i1 ]S [i1 + 1 : i2 ] . . .
2 if g > b.
. . . S [ik−1 + 1 : ik ] . . . S [im−1 + 1 : N],
where S [ik−1 + 1 : ik ] is the fragment S generated at the The algorithm performs two operations: (1) adds a new
kth step, and m = mH (S ) is the number of process steps. bit to an already existing sequence; (2) copies the already
Of all the schemes of generation is chosen the minimum formed sequence. Algorithmic complexity is the number
number of steps. Thus, the Lempel-Ziv complexity of the of such operations required to form a given sequence.
sequence S is For a random sequence of lengths n, the algorithmic
complexity is calculated by expression LZCr = n/ log n.
cLZ (S ) = min{mH (S )}. Then, the relative algorithmic complexity is the ratio of
H
the obtained complexity to the complexity of the random
The minimum number of steps is provided by the sequence LZC = LZC/LZCr .
choice to copy at each step the longest prototype from the Obviously, the classical indicators of algorithmic com-
prehistory. If you mark by the position number j(k) from plexity are unacceptable and lead to erroneous conclu-
which the copying begins in step k the length of the copy sions. To overcome such difficulties, multiscale methods
fragment are used.
The idea of this group of methods includes two con-
l j(k) = ik − ik−1 − 1 = max {l j : S [ik−1 + 1 : ik−1 + l j ] = secutive procedures: 1) coarse-graining (“granulation”)
j≤ik−1
of the initial time series – the averaging of data on non-
= S [ j : j + l j − 1]} intersecting segments, the size of which (the window of
averaging) increased by one when switching to the next
and the kth component of these complex decomposition largest scale; 2) computing at each of the scales a defi-
can be written in the form nite (still mono scale) complexity indicator. The process
of “rough splitting” consists in the averaging of series se-
S [ j(k) : j(k) + l j(k) − 1] if j(k) , 0,
S [ik−1 + 1 : ik ] =
quences in a series of non-intersecting windows, and the
S [ik−1 + 1]
if j(k) = 0.
size of which – increases in the transition from scale to
scale [107]. Each element of the “granular” time series
The case j(k) = 0 corresponds to a situation where a
follows the expression:
symbol is in the position ik−1 + 1 that has not been encoun-
tered previously. In doing so, we use a character genera- jτ
1 X
tion operation. yτj = g(i), for 1 ≤ j ≤ N/τ, (3)
Complex text analysis can be performed in two τ i=( j−1)τ+1
regimes – segmentation and fragmentation. The first
regime is discussed above. It gives an integrated view of with corresponding scale factor τ. The length of each
the structure of the sequence as a whole and reduces it “granular” row depends on the length of the window and is
to disjoint but interconnected segments (without spaces). even N/τ. For a scale of 1, the “granular” series is exactly
The other regime is to search for individual fragments identical to the original one.
characterized by an abnormally low complexity which The coarse graining procedure for scales 2 and 3 is
means that they characterized by a sufficiently high degree shown in figure 4.
8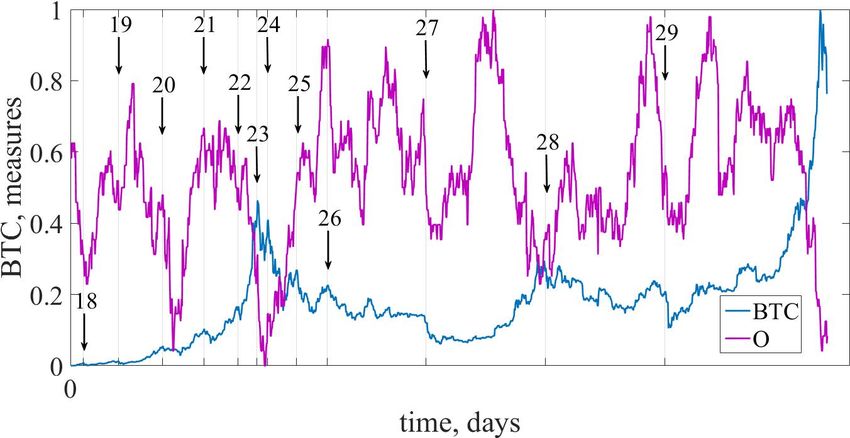
SHS Web of Conferences 107, 03001 (2021)                                                      https://doi.org/10.1051/shsconf/202110703001
M3E2 2021

                     Figure 4: Coarse-graining procedure diagram: (a) scale factor τ = 2; (b) scale factor τ = 3

        To find the LZC measure of the time series, the rolling
     time windows were considered; the index for every win-
     dow was calculated, and then the average was obtained.
         Obviously, the crisis in the cryptocurrency market re-
     sponds to noticeable fluctuations in standardized returns.
     Therefore, it is logical to choose σ as the value for the
     threshold value b.
         Figure 5 shows the dependence of the LZC on the
     scale. The absence of LZC fluctuations at scales exceed-
     ing 40 allows us to confine ourselves to this magnitude of
     the scale when calculating the multiscale measure.
                                                                                                     (a)
         Calculations of measures of complexity were carried
     for the two periods of BTC. Figure 6 presents the results
     of calculations of mono-(LZCm1 ) and multi-(LZCm40 ) scal-
     ing LZC measures. The calculations were performed for a
     rolling window of 100 days and an increment of 1 day.
         The data in figure 6 indicate that the LZC measure is
     noticeably reduced both in the case of mono-scale (m1 )
     and averaged over the scales from 1 to 40 (m40 ) for all 29
     crashes and critical events in the immediate vicinity of the
     crisis point.
         As the results of calculations showed, the choice of
     the size of a rolling window is important: in the case of                                       (b)
     large windows, points of crises of different times can fall
     into the window, distorting the influence of each of the
     crises. When choosing small windows, the results fluctu-            Figure 5: Scale-dependent LZC (a) and its version with
     ate greatly, which makes it difficult to determine the actual       the rolling window approach (b)
     point of the crisis. The used window length of 100 days
     turned out to be optimal for the separation of crises and
     fixing the LZC measure as an indicator.
                                                                         3.2 Entropy as a measure of complexity
          Since the LZC measure begins to decrease even be-
     fore the actual crisis point, it can be called an indicator-        Nowadays, the most important quantity that allows us to
     precursor of crisis phenomena in the cryptocurrency mar-            parameterize complexity in deterministic or random pro-
     ket.                                                                cesses is entropy. Originally, it was introduced by R. Clau-

                                                                     9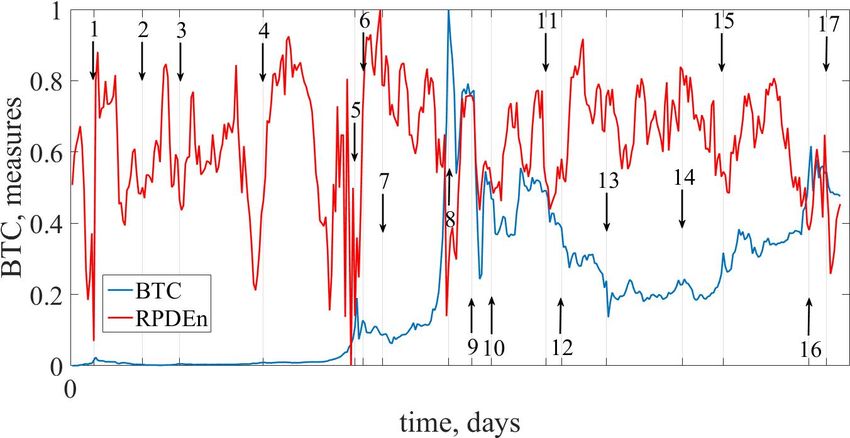
SHS Web of Conferences 107, 03001 (2021)                                                       https://doi.org/10.1051/shsconf/202110703001
M3E2 2021

                                                                    (a)

                                                                    (b)

     Figure 6: Comparative dynamics of BTC price fluctuations and mono- and multi-scaling LZC measures for first (a) and
     second (b) periods of the entire time series of Bitcoin

     sius [108], in the context of classical thermodynamics,              from various sources of nature, can be applied in our study.
     where according to his definition, entropy tends to increase         Such applications have been studied intensively for an eco-
     within an isolated system, forming the generalized second            nomic behavior system.
     law of thermodynamics. Then, the definition of entropy
     was extended by Boltzmann and Gibbs [109, 110], linking                  The existence of patterns within the series is the core
     it to molecular disorder and chaos to make it suitable for           in the definition of randomness, so it is appropriate to es-
     statistical mechanics, where they combined the notion of             tablish such methods that will be based on the different
     entropy and probability [111].                                       patterns and their repetition [116]. In this regard, Pincus
                                                                          described the methodology Approximate entropy (ApEn)
         After the fundamental paper of Shannon [90] in the
                                                                          [117] to gain more detail analysis of relatively short and
     context of information theory, where entropy denoted the
                                                                          noisy time series, particularly, of clinical and psycholog-
     average amount of information contained in the message,
                                                                          ical. Its development was motivated by the length con-
     its notion was significantly redefined. After this, it has
                                                                          straints of biological data. Since then it has been used
     been evolved along with different ways and successful
                                                                          in different fields such as psychology [118], psychiatry
     enough used for the research of economic systems [112–
                                                                          [119], and finance [120–124]. Pincus co-authored with
     115].
                                                                          Kalman [124], considering both empirical data and mod-
         A huge amount of different methods, as an example,               els, including composite indices, individual stock prices,
     from the theory of complexity, the purpose of which is               the random-walk hypothesis, Black-Sholes, and fractional
     to quantify the degree of complexity of systems obtained             Brownian motion models to demonstrate the benefits of

                                                                    10
SHS Web of Conferences 107, 03001 (2021) https://doi.org/10.1051/shsconf/202110703001
M3E2 2021
ApEn applied to the classical econometric modeling ap- cryptocurrency liquidity (volatility) had a significant posi-
paratus. This research the usefulness of ApEn on the ex- tive (negative) effect on the informational efficiency of its
ample of three major events of the stock market crash in price.
the US, Japan, and India. During the major crashes, there Also, Ayşe Metin Karakaş dedicated [134] both to Bit-
is significant evidence of a decline of ApEn during and coin and Ethereum. Here, the concept of entropy was
pre-crash periods. Based on the presented results, their re- applied for characterizing the nonlinear properties of the
search concludes that ApEn can serve as a base for a good cryptocurrencies. For her goal, Shannon, Tsallis, Rényi,
trading system. Duan and Stanley [125] showed that it and Approximate entropies were estimated. From her em-
is possible to effectively distinguish the real-world finan- pirical results, it was obtained that all entropies were pos-
cial time series from random-walk processes by examining itive. Of great interest was the results of ApEn which
changing patterns of volatility, approximate entropy, and demonstrated larger value for Ethereum than for Bitcoin.
the Hurst exponent. The empirical results prove that finan- In this case, it concluded that Ethereum had higher volatil-
cial time series are predictable to some extent and ApEn is ity.
a good indicator to characterize the predictable degree of Pele [135] investigated the ability of several econo-
financial time series. Alfonso Delgado-Bonal [126] gives metrical models to forecast value at risk for a sample of
evidence of the usefulness of ApEn. The researcher quan- daily time series of cryptocurrency returns. Using high-
tifies the existence of patterns in evolving data series. In frequency data for Bitcoin, they estimated the entropy of
general, his results present that degree of predictability in- the intraday distribution of log-returns through the sym-
creases in times of crisis. bolic time series analysis STSA, producing low-resolution
Permutation entropy (PEn), according to the previous data from high-resolution data. Their results showed that
approach, is a complexity measure that is related to the entropy had strong explanatory power for the quantiles of
original Shannon entropy (ShEn) that applied to the distri- the distribution of the daily returns. They confirmed the
bution of ordinal patterns in time series. Such a tool was hypothesis that there was a strong correlation between the
proposed by Bandt and Pompe [127], which is character- daily logarithmic price of Bitcoin and the entropy of in-
ized by its simplicity, computational speed that does not traday returns based on Christoffersen’s tests for Value at
require some prior knowledge about the system, strongly Risk (VaR) backtesting, they concluded that the VaR fore-
describes nonlinear chaotic regimes. Also, it is character- cast built upon the entropy of intraday returns was the
ized by its robustness to noise [128, 129] and invariance to best, compared to the forecasts provided by the classical
nonlinear monotonous transformations [130]. The combi- GARCH models.
nation of entropy and symbolic dynamics turned out to be
fruitful for analyzing the disorder for the time series of any
nature without losing their temporal information. 3.2.1 Time delay method
As an example, Henry and Judge [131] applied PEn
to the Dow Jones Industrial Average (DJIA) to extract in- The state of the system can be described by the set of vari-
formation from this complex economic system. The re- ables. Its observational state can be expressed through a
sult demonstrates the ability of the PEn method to detect d-dimensional vector or matrix, where each of its compo-
the degree of disorder and uncertainty for the specific time nents refers to a single variable that represents a property
that is explored. Higor et al. [132] applied PEn and statis- of the system. After a while, the variables change, result-
tical complexity over sliding time-window of daily clos- ing in different system states.
ing price log-returns to quantify the dynamic efficiency of Usually, not all relevant variables can be captured from
more than four hundred cryptocurrencies. Authors address our observations. Often, only a single variable may be ob-
to the efficient market hypothesis when the values of two served. Thakens’ theorem [136] that was mentioned in pre-
statistical measures within a time-window cannot be dis- vious sections ensures that it‘s possible to reconstruct the
tinguished from those obtained by chance. They found topological structure of the trajectory formed by the state
that 37% of the cryptocurrencies in their study stayed ef- vectors as the data collected for this single variable con-
ficient over 80% of the time, whereas 20% were informa- tains information about the dynamics of the whole system.
tionally inefficient in less than 20% of the time. Moreover, For an approximate reconstruction of the original dy-
the market capitalization was not correlated with their effi- namics of the observed system, we project the time series
ciency. Performed analysis of information efficiency over onto a Reconstructed Phase Space [130, 137, 138] with the
time reveals that different currencies with similar tempo- commonly used time delay method [130] which relied on
ral patterns formed four clusters, and it was seen that more the embedding dimension and time delay.
young currencies tend to follow the trend of the most lead- The embedding dimension is being the dimensionality
ing currencies. Sensoy [133] compared the time-varying of the reconstructed system (corresponds to the number
weak-form efficiency of Bitcoin prices in terms of US dol- of relevant variables that may differ from one system to
lars (BTC/USD) and euro (BTC/EUR) at a high-frequency another. The time delay parameter specifies the temporal
level by PEn. He noticed that BTC/USD and BTCEUR components of the vector components. As an example,
have become more informationally useful since the be- in recurrence analysis that will be described in section 6,
ginning of 2016, namely Bitcoin in the same period. Re- Webber and Zbilut [139] recommend setting the embed-
searcher also found that with higher frequency in the Bit- ding dimension between 10 and 20. Regarding the analy-
coin market, we had lower price efficiency. Moreover, sis of financial systems, values between 1 and 20 for the
11SHS Web of Conferences 107, 03001 (2021) https://doi.org/10.1051/shsconf/202110703001
M3E2 2021
embedding dimension are considered to be reasonable as and ApEn of a corresponding time series (for fixed dE and
well as the time delay. r) measures the logarithmic likelihood that patterns that
are close for dE adjacent observations remain close on the
next comparison:
3.2.2 Shannon entropy
ApEn(dE , r, N) = F dE (r) − F dE +1 (r), (6)
The general approach can be described as follows. For-
mally, we represent the underlying dynamic state of the i.e., equation (6) measures the logarithmic likelihood that
system in probability distribution form P and then the sequences of patterns that are close for dE observations
Shannon entropy S with an arbitrary base (i.e. 2, e, 10) will remain close after further comparisons. Therefore,
is defined as: if the patterns in the sequence remain close to each other
N
X (high regularity), the ApEn becomes small, and hence, the
S [P] = − pi log pi . (4) time series data has a lower degree of randomness. High
i=1 values of ApEn indicate randomness and unpredictability.
But it should be considered that ApEn results are not al-
Here, in equation 4, pi represents the probability that ways consistent, thus it depends on the value of r and the
price i occurs in the sample’s distribution of the Bitcoin length of the data series. However, it remains insensitive to
time series, and N is the total amount of data in our system. noise of magnitude if the values of r and dE are sufficiently
Dealing with continuous probability distributions with a good, and it is robust to artifacts and outliers. Although
density function f (x), we can define the entropy as: ApEn remains usable without any models, it also fits natu-
Z +∞ rally into a classical probability and statistics frameworks,
H( f ) = − f (x) log f (x)dx. (5) and, generally, despite its shortcomings, it is still the ap-
−∞ plicable indicator of system stability, which significantly
According to the approach, the negative log increases increased values may prognosticate the upcoming changes
with rarer events due to the information that is encoded in in the dynamics of the data.
them (i.e., they surprise when they occur). Thus, when all The empirical results for the corresponding measure
pi have the same value, i.e. where all values are equally of entropy along with two periods of BTC are presented in
probable, and S [P] reaches its minimum for more struc- figure 8.
tured time series (events that are more certain). Equation Long before the crisis, the value of this type of en-
5 is obeyed to the same rules as 4. In figure 7 are the em- tropy begins to decrease, the complexity of the system de-
pirical results for Shannon entropy and Bitcoin time series. creases. This measure, in our opinion, is one of the earliest
It can be seen from the figure that Shannon’s entropy precursors of the crisis.
is rapidly increasing at the very moment of the crisis itself
and is an excellent indicator of crisis phenomena. 3.2.4 Permutation entropy
PEn, according to the previous approach, is a complex-
3.2.3 Approximate entropy
ity measure that is related to the fundamental Information
To gain more detail analysis of the complex financial sys- theory and entropy proposed by Shannon. Such a tool was
tems, it is known other entropy methods have become proposed by Bandt and Pompe [127], which is character-
known, particularly, ApEn developed by Pincus [117] for ized by its simplicity, computational speed that does not
measuring regularity in a time series. require some prior knowledge about the system, strongly
When calculating it, given N data points describes nonlinear chaotic regimes. Also, it is character-
{x (i ) | i = 1, . . . , N} are transformed into subvec- ized by its robustness to noise [128, 129] and invariance to
tors X ~ (i) ∈SHS Web of Conferences 107, 03001 (2021) https://doi.org/10.1051/shsconf/202110703001
M3E2 2021
(a)
(b)
Figure 7: ShEn dynamics along with the first (a) and the second (b) periods of the entire time series of Bitcoin
is satisfied: Then, to get more convenient values, we calculate Nor-
malized permutation entropy as:
x(i + k0 ) ≤ x(i + k1 ) ≤ . . . ≤ x(i + kdE −1 ). S [P]
E s [P] = ,
S max
We will use ordinal pattern probability distribution as
whose S max = ln dE ! represents the maximum value of
a basis for entropy estimation. Further, let us denote f (πl )
ES [P] (a normalization constant), and normalized entropy
as the frequency of occurrence of the pattern πl . Then, the
has a range 0 ≤ PEn ≤ 1. Here, the maximal entropy
relative frequencies of permutations in the time series are
possible value is realized when all dE ! possible permuta-
defined as
tions have an equal probability of occurrence (more noise
f (πl )
p(πl ) = , and random data). With the much lower entropy value, we
N − (dE − 1)τ get a more predictable and regular sequence of the data.
Therefore, the PEn gives a measure of the departure of
where the ordinal pattern probability distribution is given
the time series from a complete noise and stochastic time
by P = {p(πl ) | l = 1, . . . , dE !}. Finally, permutation en-
series.
tropy (denoted by S [P]) of the corresponding time series
There must be predefined appropriate parameters on
presented in the following form:
which PEn relying, namely, the embedding dimension
dE !
dE is paramount of importance because it determines dE !
possible states for the appropriate probability distribution.
X
S [P] = − p(πl ) log p(πl ).
l=1
With small values such as 1 or 2, parameter dE will not
13SHS Web of Conferences 107, 03001 (2021) https://doi.org/10.1051/shsconf/202110703001
M3E2 2021
(a)
(b)
Figure 8: ApEn dynamics along with the first (a) and the second (b) periods of the entire time series of Bitcoin calculated
with rolling window of 100 days and the step size of 1 day
work because there are only few distinct states. Further- the fractal theory proposed by Mandelbrot [141]. Before,
more, for obtaining reliable statistics and better detecting fractal studies focus on the Rescaled Range (R/S) analysis
the dynamic structure of data, dE should be relevant to the were proposed by Hurst [142, 143] in the field of hydrol-
length of the time series or less [140]. For our experi- ogy. However, Lo [144] discovered that the R/S method
ments, dE ∈ {3, 4} and τ ∈ {2, 3} indicate the best results. is sensitive to short-term autocorrelation, which may lead
Hence, in figure 9 we can observe the empirical results for to a bias error of nonstationary time series. To solve this
permutation entropy, where it serves as indicator-precursor problem, Penget et al. [145] proposed a widely used de-
of the possible crashes and critical events. trended fluctuation analysis (DFA) that uses a long-range
Information measures of complexity due to their initial power law to avoid significant long-term autocorrelation
validity and transparency, ease of implementation and in- false detection [146]. As a multifractal extension (MF)
terpretation of the results occupy a prominent place among of the DFA approach, Kantelhardt et al. [147] introduced
the tools for the quantitative analysis of complex systems. the MF-DFA method that for a long time has been suc-
cessfully applied for a variety of financial markets, such
as stock [148–156], commodity [154, 157–160], tanker
4 Fractal and multifractal measures of [161], derivative [162], foreign exchange rates [163–167],
complexity and electricity markets [168]. An especially interesting ap-
plication of multifractal analysis is measuring the degree
The economic phenomena that cannot be explained by the
traditional efficient market hypothesis can be explained by
14You can also read