Edition 9 June 2021 - Deloitte
←
→
Page content transcription
If your browser does not render page correctly, please read the page content below

Edition 9 June 2021

Voice of Asia

                                     Our Voice of Asia series brings to life the challenges and
                                       opportunities facing the region today and tomorrow.
                                    Voice of Asia is the result of significant collaboration across
                                           the Deloitte Asia Pacific and Global Network.

                Cover and chapter images: Hu, Olivia Yang
Edition 9 June 2021

Contents

   A recovery that exceeds expectations | 6

   Well-crafted policies are needed to contain
   downside risks | 10

   The challenge: how to “build back better” in the
   post-pandemic world that is emerging? | 15

   In need of a booster shot: Asia's green recovery
   after the pandemic | 20

   Acknowledgements | 27

                              1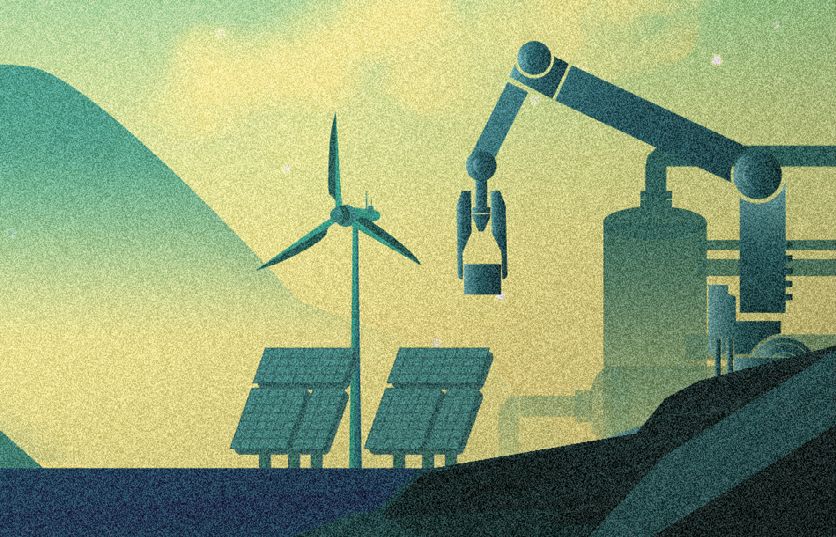
Preparing for a
Post-pandemic Era

Edition 9 June 2021

Summary

S
     EVERAL themes will be evident in                   turbulence. Carefully calibrated policies can help
      economies across the Asia Pacific over the        contain these risks.
     coming 12 months.
                                                        Third, it's time for reform: as confidence in
First, the global recovery is gathering strength:       the economic recovery strengthens, the focus
powerful stimulus policies and improving vaccine        of businesses and markets will shift to the
rollouts in large economies are combining with          shape of the post-pandemic landscape and how
enhanced economic resilience to produce a more          various geographies can “build back better.”
formidable recovery than expected.                      The geographies where governments carve out
                                                        an appropriate role in supporting economic
Second, we're not out of the woods: downside            development and where the private sector adapts
risks that still need to be managed include             most effectively will be the ones that deliver
new spikes of COVID-19 infections, dangerous            superior long-term economic growth.
new variants of the virus and financial market

                                                    3
Voice of Asia

                Summary of Geographic Views
                Geography   Outlook

                Australia   Cyclical rebound will get a huge boost from commodity boom

                            Export tailwinds will power industrial production and
                            manufacturing investment
                            Consumer spending reviving, albeit more slowly
                China       Fiscal consolidation will be gradual — risks from credit tightening
                            are manageable given a backdrop of robust demand, especially
                            in housing
                            Reforms to boost domestic demand will take center stage

                            Domestic demand remains weak, with tourism under water
                            Financial services still a locomotive of growth
                Hong Kong   Positive spillovers from external Chinese demand
                            Diversion of certain financial activity to other hubs a clear negative
                            More changes are looming, in the form of housing and anti-trust laws

                            Recent spike in infections cast doubt over India’s recovery
                            Strict mobility restrictions are being imposed and are likely to set
                            back economic activity
                India       Calibrated restrictions to minimize supply chain and industry
                            disruptions could ensure smaller impact than initial lockdown
                            Surge in infections likely to result in modest growth but economic
                            activity will pick up rapidly in the second half

                            Economy hit hard by the relentless spread of the virus
                            Government support via transfers and infrastructure spending
                Indonesia   Mixed impact from rising commodity prices (e.g. coal, nickel, CPO
                            vs. oil)
                            Structural reform agenda – omnibus bill, negative investment list

                            Industrial output will support the economic recovery as demand
                            from industrial digitalization accelerates
                            Consumer spending will recover slowly at first but pent-up demand
                Japan
                            will later support the recovery alongside the vaccination rollout
                            Japan will follow other developed economies with fiscal stimulus later
                            this year but there is a risk this could fizzle out

                            New surge in COVID-19 infections prompted severe restrictions
                            which will hurt near term growth
                            Buoyant external demand helps to offset this setback
                Malaysia    Government support via transfers and infrastructure projects
                            Rising commodity prices a positive for the economy
                            New five-year plan will be released soon, prompting a rise in
                            public investment

                                                     4
Edition 9 June 2021

Geography     Outlook

New Zealand   The economy is benefiting from the commodity boom

              Economy hit hard by the relentless spread of the virus
              Infrastructure spending to firm up ahead of 2022 elections
Philippines   More stimulus and further reforms could be in the offing
              Remittances to surprise on the upside; business process outsourcing
              has coped well with work-from-home arrangements

              Export demand will be extremely robust, manufacturing exports and
              reexports are likely to do well. Regional demand to turn accretive for
              the entrepot hub
Singapore     Vaccination program well-advanced by mid-2021, paving the way for
              cautious and selective reopening to cross-border travel by 3Q21
              Fixed asset investment commitments to resume in earnest by 4Q21,
              sustaining momentum into 2022

              New waves of infections have buffeted the economy
              More fiscal stimulus in the offing ahead of the 2022 elections
South Korea   New Deal to create more jobs in green economy and digital sphere
              Buoyant external demand, especially in electronics, is a powerful
              tailwind to growth

              Cyclical upswing in Taiwan could be more potent than most regional
              economies due to its competitiveness in semiconductors
              2021 could be a breakout year in terms of GDP growth (around 2%)
Taiwan
              compared with recent years
              The currency may even flirt with levels not seen since the Asian
              Financial Crisis in 1997

              New surge in COVID-19 infections will hurt domestic demand and
              further delay the recovery in tourism
              Exports and manufacturing can look forward to a better year as
              global demand broadens
Thailand      Some upside for private investment with political risks having
              declined somewhat
              Balance of risks tilted towards the downside – premature withdrawal
              of fiscal support, planned infrastructure projects failing to be
              promptly implemented, consumer fatigue

              Poised for another year of outperforming growth owing to adept
              virus control and vaccination progress, as well as export tailwinds
Vietnam       on resilient global tech demand
              Well positioned to capture more production relocating away from
              hitherto China-centric supply chains

                                       5
Voice of Asia

                A recovery that exceeds
                expectations

                A
                            RAPID upturn is beginning in the global                 Chinese export strength isn’t merely relative to
                            economy which is likely to strengthen                   last year’s COVID-19 lows, but also to recovering
                            even further.                                           global demand. Comparing Chinese exports in the
                                                                                    first four months of 2021 against the same period
                The world is recovering faster than many realize –                  in 2019, we find an expansion of about 31%. In
                and that’s good news for the exporters of the Asia                  fact, it appears as if global demand continued to
                Pacific region.                                                     firm up. In the first ten days of May, South Korean
                                                                                    exports surged 81% on the previous year. Another
                China and Korea are sizeable exporters, and                         useful indicator is that South Korea’s export
                thus, the demand for their exports offers a good                    growth is broadening out beyond semiconductors
                reflection of the underlying dynamics in world                      to non-IT related goods such as automobiles
                trade. Trends in their exports show a stronger                      and chemicals.
                rebound in global demand than anticipated.

                CHART 1

                OECD Composite Lead Indicator (CLI)
                Long term trend = 100                    OECD            US                Japan            China        Euro area

                   102.5

                   100.0

                     97.5

                     95.0

                     92.5

                     90.0

                     87.5

                     85.0

                     82.5
                                    Jan-20          Mar-20      May-20            Jul-20           Sep-20    Nov-20     Jan-21

                Source: CEIC, Centennial Asia Advisors

                                                                              6
Edition 9 June 2021
CHART 2
US: ISM PMI New Orders Index
Manufacturing Services
75
65
55
45
35
25
Jan-13
Apr-13
Jul-13
Oct-13
Jan-14
Apr-14
Jul-14
Oct-14
Jan-15
Apr-15
Jul-15
Oct-15
Jan-16
Apr-16
Jul-16
Oct-16
Jan-17
Apr-17
Jul-17
Oct-17
Jan-18
Apr-18
Jul-18
Oct-18
Jan-19
Apr-19
Jul-19
Oct-19
Jan-20
Apr-20
Jul-20
Oct-20
Jan-21
Source: CEIC, Centennial Asia Advisors
Moreover, there is evidence that this ongoing geography spills over into others and pulls them
improvement in global demand is likely to be along as well. For instance, China's rebound is
sustained. The OECD’s composite lead indicators clearly the driving force behind this commodity
have been a reliable predictor of future economic boom which has begun to broaden out.
activity. The fact that they are improving across
the board is thus a propitious sign. This is in The durability of this recovery is underpinned by
line with surveys of purchasing managers which a confluence of several forces
show the pipeline of new orders expanding. In
March, the indicator for new business received by There’s a lot to like about global prospects:
American companies in both the manufacturing vaccinations are working, policymakers remain
and non-manufacturing sectors reached almost committed to the recovery, while businesses and
record levels. Taiwan’s new export orders are families are proving resilient.
similarly trending at their highest level in over a
decade. Trends in the New York Federal Reserve's Optimism towards a formidable recovery may
Weekly Economic Index also suggest that second seem misplaced given the unfortunate news
quarter growth in the US, still the single biggest around accelerating COVID-19 infections in
engine of global demand, could accelerate rapidly. India, Brazil and parts of Europe and the United
States. This is particularly so when one considers
The composition of trade is also congruent the concerns over side effects which have plagued
with the notion that the world economy is some of the new vaccines and are hindering
staging a substantial recovery. China's imports the rollout of vaccines that many countries are
in April 2021 were up 22% on levels in April depending on to bring an end to the pandemic.
2019. Strong growth in Chinese demand should
spur Asia Pacific exports of commodities as Clearly, these threats to public health and a
well as components for electronics and related meaningful recovery should not be discounted.
equipment, benefiting countries as wide-ranging However, they need to be viewed within the
as Japan, Australia, India and Indonesia. What context of other developments.
this shows is that, as countries come to grips with
the pandemic, an economic recovery also spurs • First, economies appear to be developing
growth in imports. In this way, a recovery in one greater resilience to new spikes in infections.
7Voice of Asia
Public health policymakers, business leaders trillion infrastructure plan that, if passed,
and ordinary consumers have adapted to the will be phased in over the next eight years.
reality of the pandemic in ways that reduce This could in turn be followed by a further
the economic damage caused by these new US$1 trillion package of social spending. This
waves of infections. Restrictions on activities colossal amount of government expenditure
in response to rising numbers of cases tend will not only boost American economic growth
to be more targeted, so the drag on economic this year and next, but will also trickle out into
activity they cause tends to be less impactful other economies through trade spillovers.
than before. Businesses have also been Recent export data from China also suggest
creative in finding ways to minimize the hit that the momentum of China's recovery may
to their operations, such as by utilizing virtual surprise on the upside in 2H of 2021.
platforms to sell their products or conduct
business operations. Ordinary citizens have • Third, vaccination campaigns in large
equally learned to better cope with the fear developed economies are gaining traction.
of infections or restrictions on socializing, At its current vaccination rate of roughly 3.1
finding ways to sustain their consumption million a day, the United States is on course
habits through different means. This helps to to reach herd immunity by July. Europe’s
explain why activity in Europe seems to have vaccination program has been roundly
held up better than expected during the early criticized for delays but recent weeks have
months of this year, despite the bad news seen a ramp-up. As an increasingly higher
surrounding new waves of infections and proportion of people are getting vaccinated
subsequent lockdowns. in the United States and Europe, as well
as in large developing countries such as
• Second, monetary and fiscal policies China and India, governments will be more
continue to provide considerable support to willing to normalize economic activity and
economies. Central banks in large developed consumers will feel sufficiently confident in
economies around the world remain channelling their huge amounts of savings to
committed to a prolonged period of near-zero fund increased consumption. Such a release
interest rates and high levels of quantitative of pent-up demand should also be evident in
easing. In the United States, the Biden corporate capital spending, and if that unfolds,
Administration has followed up on its then the economic rebound will be even
enormous US$1.9 trillion fiscal stimulus which more potent.
is already being implemented with a US$2
CHART 3
Vaccine Doses Per 100 People
China Germany France India Italy Japan US UK
70
60
50
40
30
20
10
0
Dec-20
Dec-20
Dec-20
Jan-21
Jan-21
Jan-21
Jan-21
Feb-21
Feb-21
Feb-21
Feb-21
Mar-21
Mar-21
Mar-21
Mar-21
Mar-21
Apr-21
Apr-21
Source: CEIC, Centennial Asia Advisors
8Edition 9 June 2021
CHART 4
US: Manufacturing New Orders (Electronics)
%y/y sa
15
10
5
0
-5
-10
-15
-20
Jan-13
Apr-13
Jul-13
Oct-13
Jan-14
Apr-14
Jul-14
Oct-14
Jan-15
Apr-15
Jul-15
Oct-15
Jan-16
Apr-16
Jul-16
Oct-16
Jan-17
Apr-17
Jul-17
Oct-17
Jan-18
Apr-18
Jul-18
Oct-18
Jan-19
Apr-19
Jul-19
Oct-19
Jan-20
Apr-20
Jul-20
Oct-20
Jan-21
Source: CEIC, Centennial Asia Advisors
These factors are strongly supportive of Asia generation memory chips has just been approved
Pacific economies, with the tech cycle adding by the authorities.
more vigor to the outlook
The mammoth scale of these recent investment
The global electronics sector is in the midst of a commitments reflect the industry’s expectations
structural upturn driven by the proliferation of for future demand: a higher baseline level of
5G networks, rising semiconductor content in demand for semiconductors going forward, over
5G-capable smartphones, and the maturation of and above the incremental demand from one-off
marquee next-generation technology applications factors such as the shift to home working.
such as machine learning, artificial intelligence,
and the industrial Internet-of-Things. Asia is more exposed relative to other emerging
economies to these favorable tailwinds. Several
Indeed, the major chip foundries are putting Asia Pacific economies are highly geared into
in train capital spending programs at an the tech cycle and will benefit hugely from these
unprecedented scale. TSMC plans capital trends, with Japan, South Korea, Taiwan, and
expenditure of US$100 billion over the next Singapore likely to be sizable winners. Malaysia
three years, while SK Hynix’s US$106 billion and the Philippines will also benefit, albeit to a
plan to build a new semiconductor fabrication lesser extent.
complex housing four fabs producing next-
9Voice of Asia
Well-crafted policies
are needed to contain
downside risks
T
HERE are any number of threats to the underwrite vaccination campaigns in less
benign scenario described above but two developed countries. China and India have
in particular come to mind – the pandemic also been generous in supplying vaccines to
turning out to be worse than forecast and financial poorer countries.
turbulence. In both cases, sound policy measures
can alleviate the risks they pose. • Second, there should not be a premature
withdrawal of monetary and fiscal measures
New and more lethal waves to support spending. This will ensure that,
of COVID-19 infections even with occasional spikes in infections
which bring about restrictions on economic
After more than a year of dealing with the activity, the damage to jobs and incomes
pandemic, the medical community is still can be alleviated and the economy will avoid
discovering that there remains a lot they do not plummeting. Indeed, policy signals from
know. Because the virus mutates into variants central bank meetings and other commentary
such as the more infectious Brazilian and British by government officials suggest that Asia
ones, the pandemic has turned out to be a much Pacific policymakers are fully cognizant of the
more persistent threat than many observers had need for nuanced policy management.
thought possible. Given the continuing and large-
scale spread of the virus in populous countries • Third, continued government support to
such as India and Brazil, there is ample scope expand research and development into
for even more variants to emerge, with one vaccinations and medicines to treat the
or more of them turning out to be even more virus will help provide the range of medical
lethal. It has also become evident that in many responses that can help allay the health
societies, people have limited tolerance for the threats that the virus might pose.
stringent limitations on social interactions that
public health experts believe are needed to quash Recent experience of infection spikes over the
the virus. past few months tells us that a combination
of these policy responses can help allay these
That said, 2021 will see a tug of war between downside risks.
vaccinations and mutations.
Financial market turbulence – will inflation rear
The only way to mitigate the risk of mutations its head?
is through policy measures, several of which are
falling into place: If the global economy does indeed roar back to life
beating expectations, then two risks to financial
• First, it is vitally important to speed up and markets present themselves.
broaden vaccination processes. The good
news is that more and more countries accept First, now-dormant inflationary pressures could
that no one is safe until everyone is safe. As perk up, causing bond yields to rise and valuations
richer countries become more confident that of bonds, equities, real estate and start-ups to
they can soon provide vaccinations for their become stretched.
own citizens, they will be more willing to
10Edition 9 June 2021
Second, expectations could arise that the ultra- Indeed, as signs of economic recovery have grown
easy monetary policies we currently have might in recent months, bond yields, equity prices
be withdrawn sooner than expected, causing and currency values have become more volatile,
abrupt dislocations in financial markets. showing just how nervous financial investors have
become that their expectations of a prolonged
period of ultra-easy money might be upset.
CHART 5
10Y Government Bond Yield
% pa United States
8
6
4
2
0
Jan-00
Jan-02
Jan-04
Jan-06
Jan-08
Jan-10
Jan-12
Jan-14
Jan-16
Jan-18
Jan-20
Source: Bloomberg, Centennial Asia Advisors
CHART 6
10Y Government Bond Yield
% pa South Korea Singapore Thailand
3.0
2.5
2.0
1.5
1.0
0.5
Jan-18
Apr-18
Jul-18
Oct-18
Jan-19
Apr-19
Jul-19
Oct-19
Jan-20
Apr-20
Jul-20
Oct-20
Jan-21
Apr-21
Source: Bloomberg, Centennial Asia Advisors
11Voice of Asia
CHART 7
10Y Government Bond Yield
% pa India Indonesia
9.0
8.5
8.0
7.5
7.0
6.5
6.0
5.5
5.0
Jan-18
Apr-18
Jul-18
Oct-18
Jan-19
Apr-19
Jul-19
Oct-19
Jan-20
Apr-20
Jul-20
Oct-20
Jan-21
Apr-21
Source: Bloomberg, Centennial Asia Advisors
CHART 8
10Y Government Bond Yield
% pa China Malaysia
4.5
4.0
3.5
3.0
2.5
2.0
Jan-18
Apr-18
Jul-18
Oct-18
Jan-19
Apr-19
Jul-19
Oct-19
Jan-20
Apr-20
Jul-20
Oct-20
Jan-21
Apr-21
Source: Bloomberg, Centennial Asia Advisors
12Edition 9 June 2021
Then again, it is important to realize that rising OR
inflationary threats are a symptom of the good
news on the global economy – they are the bad • Into financial assets or real estate which could
news that accompanies a great deal of good news. produce asset price inflation.
Besides, our view is that inflation will In other words, we should not focus only on the
rise but not to rates that will cause undue risk of a surge in inflation, as excesses could be
dislocation. However, there are other vented in other ways that raise the risk of (a)
risks associated with the recovery that worsening external accounts, or (b) overheated
will pose a risk. asset prices. This could spook financial markets
or force central bankers and financial regulators
If economies come back to life while policies are to address these risks through policy tightening
still highly expansionary, there could be excess which would also upset financial markets.
demand and excess liquidity. That is what has
prompted fears in some quarters that there could Will inflation surprise so strongly on the upside
be a sharp spike in inflation. in the coming year or two to the extent that we
could see financial dislocations? We are skeptical
However, historical experience tells us that about the likelihood of this scenario for the
these excesses could be vented through three following reasons.
basic channels:
First, even with a strong rebound, there will be
• Excess demand for domestic goods and sufficient slack in the global economy to limit
services, which would produce higher inflation; pricing power, as shown in the charts below.
Therefore, even if commodity prices rise, these
OR costs may not be fully passed on.
• Through a surge in imports which could lead
to current account deficits;
CHART 9
Advanced Economies: Output Gap Projections
% of potential GDP Average, 2020-21 Average, 2022-23
2
1
0
-1
-2
-3
-4
-5
-6
-7
-8
ESP ITA FRA GBR AUS DEU CAN JPN USA
Source: IMF World Economic Outlook April 2021, Centennial Asia Advisors
13Voice of Asia
CHART 10
Emerging Economies: Output Gap Projections
% of potential GDP Average, 2020-21 Average, 2022-23
0
-1
-2
-3
-4
-5
-6
-7
IND MEX IDN ZAF BRA CHN RUS POL TUR
Source: IMF World Economic Outlook April 2021, Centennial Asia Advisors
Second, inflation rarely accelerates sharply strongly in 2021 and 2022, there is a likelihood
unless wage pressures become formidable. Given of the US current account deficit surprising on
the current pace of job recovery, we believe that the upside. That could spur policy concern
employment rates will not return to pre-pandemic in the US which might trigger renewed calls
levels until 2023. for protectionism, which could in turn hurt
Asian exporting nations. As a recent US
Thus, the risks we anticipate are as follows: Treasury report on currency manipulation
showed, allegations of unfair management of
• Inflation is likely to gather momentum in Asian currencies could be used to justify trade
developed economies but remain below rates measures against Asian exports.
that would prompt an abrupt tightening in
monetary policy. The major central banks such Central banks thus have a great responsibility
as the US Federal Reserve and the European to manage financial market expectations
Central Bank have emphasized that they prudently so that movements in asset prices are
will be wary of tightening policies. However, not disorderly. For the highly influential central
we do anticipate that financial markets will banks such as the US Federal Reserve, the
remain nervous and that there is a high People’s Bank of China, the European Central
chance of episodes of market turbulence due Bank, the Bank of Japan and the Bank of England,
to bouts of market inflation fears. This could it will become vital that they communicate policy
be in response to occasional data releases, intentions with great sensitivity. Knowing that
for example, which might indicate a rise in financial markets can be unforgiving to emerging
underlying inflationary pressures. economies in such times of uncertainty, their
central banks need to carefully calibrate their
• With the recovery unevenly spread across actual policy moves and the statements they issue.
major economies, as the US economy surges
14Edition 9 June 2021
The challenge: how to
“build back better” in
the post-pandemic world
that is emerging?
C
ERTAIN technological trends that had been Other shifts include the increased willingness
emerging before the outbreak of COVID-19 to employ industrial policies even in the United
have accelerated sharply during the States, the disillusionment with free trade and
pandemic. For example, technological solutions the subsequent readiness to employ protectionist
for remote working and digitalization trends such tools and adopt a more cautious approach to
as online payments and e-commerce were evident immigration, especially of the unskilled variety.
before the crisis but have taken off as a result.
In both developed and emerging economies, we
In the same way, other changes that were gestating are therefore likely to see a greater inclination
pre-pandemic may also have been sped up. The to experiment with policies and higher levels
following are the dominant forces we expect will of state intervention in the pursuit of economic
shape the landscape for Asia Pacific economies, development and a more equitable society.
and which governments and companies will have
to find ways to accommodate. Accelerated technological change offers
opportunities but also potential dislocations
Fundamental shift in policy frameworks
As mentioned above, the IT-telecommunications
The so-called Reagan-Thatcher revolution revolution has been accelerated by the pandemic,
up-ended the then existing economic policy particularly in the areas of artificial intelligence,
framework from 1979 onwards. Now, the robotics, big data, cloud computing, 5G
orthodoxy and policy tool kits that were ushered networks and blockchain technology. These
in by Reagan and Thatcher are themselves being are important but we should also not forget
overthrown. This is apparent in monetary policy other transformational technological advances
where a single-minded focus on controlling in renewable energy, the development of new
inflation has been cast aside, with central banks materials, advanced manufacturing processes
prepared to use aggressive quantitative easing such as 3D printing, and a whole plethora of
measures that were unthinkable before. Similarly, advances in the biomedical sciences.
there is a return to the more active use of fiscal
policy to manage economic cycles and pursue The implications are wide-ranging. There
social goals. will be dislocations in the job market as some
occupations are made redundant while new ones
New areas of policy focus will also emerge. emerge. Some goods and services will become
Tackling climate change will become a much obsolete and shrink while others will grow rapidly.
greater focus of policy formulation. Companies may be left with stranded assets.
15Voice of Asia
Changes in the structure of competitiveness Implications
The pandemic has refocused the attention of A detailed assessment of the implications of
company managers and governments on the these trends is beyond the scope of this report.
resilience of critical links within global supply But what we want to sketch out is the two broad
chains. As the factory of the world, rising costs directions along which countries in the Asia
in China and the costs associated with the trade Pacific region will need to take so as to ensure that
war have brought about a reconfiguration of their economies flexibly and effectively adapt to
supply chains. Some interpret this as denoting these mega trends.
a relocation of production facilities out of China,
but the picture is more complex than that. The first is the top-down policy interventions
Successful developing economies, where costs needed to ensure necessary economic flexibility.
and currencies have risen, will continue to move Governments need to provide key public
up the value chain. This will involve lower-value goods such as modern physical infrastructure,
activities relocating to other regions so as to education systems including life-long learning to
release resources for the higher value segments facilitate the reskilling of older workers, funding
of the value chain in which these countries will for research and development, specialized
gain a competitive edge as they develop. This will institutions to promote small- and medium-sized
be apparent not only in China but also in other enterprises and offering support to start-ups.
countries such as Thailand and Singapore too. Macroeconomic policies need to be put in place
so that the economy is capable of spontaneously
Gearing up to tackle climate change adjusting to challenges. Australia, for example,
is an economy which has succeeded in building
The COVID-19 pandemic has also focused policy in this capacity for adaptation which explains
attention on how human interaction with nature its track record of long economic expansions.
could result in unintended risks. Together with We look at the implications for climate
recent natural disasters that suggest a higher change in more detail in the deep dive
frequency of extreme weather events, public section that follows.
consciousness of the need to more vigorously
address climate change has increased. The The second is the corporate sector’s capacity
forthcoming 2021 United Nations Climate to respond. In most cases, so long as there is
Change Conference (COP26), scheduled to be an enabling business ecosystem, profit-making
held in November, should help to encourage enterprises will have the incentive and the means
more climate-oriented policy changes. of making these adjustments.
16Edition 9 June 2021
Table 1
Economic Forecasts for the Region
Current
GDP
Inflation account Policy Currency
growth
(%) balance/ rate (%) vs US$
(%)
GDP (%)
2020 -2.4 0.8 2.5 0.4 0.674
Australia 2021 4.9 1.6 1.0 0.1 0.759
2022 3.3 1.5 -0.8 0.1 0.746
2020 2.3 2.5 2.3 2.25 6.55
China 2021 8.0 1.2 2.0 2.25 6.75
2022 5.0 0.9 1.8 2.25 6.80
2020 -6.1 0.3 4.2 - 7.75
Hong Kong 2021 4.5 1.6 3.6 - 7.75
2022 5.9 1.9 3.1 - 7.75
2020 -6.9 6.2 0.5 4.40 72.5
India 2021 9.1 5.2 -1.0 4.00 74.5
2022 8.1 6.2 -1.8 4.35 75.5
2020 -2.1 1.7 -0.4 3.75 14,050
Indonesia 2021 5.8 2.5 -1.5 3.75 14,500
2022 6.0 2.8 -3.0 3.75 14,200
2020 -4.8 0.0 3.2 -0.1 103
Japan 2021 1.8 0.3 3.2 -0.1 110
2022 2.3 0.6 3.0 -0.1 110
2020 -5.6 -1.4 4.4 1.75 4.02
Malaysia 2021 6.2 1.6 3.6 1.75 4.10
2022 5.8 2.1 3.2 2.00 3.90
17Voice of Asia
Current
GDP
Inflation account Policy Currency
growth
(%) balance/ rate (%) vs US$
(%)
GDP (%)
2020 0.7 1.7 -2.8 1.2 0.65
New Zealand 2021 4.8 1.7 -1.3 0.3 0.71
2022 2.8 1.6 -2.3 - 0.72
2020 -9.5 3.5 3.6 2.00 48.0
Philippines 2021 5.5 4.4 2.1 2.00 49.0
2022 6.5 3.6 0.5 2.50 50.0
2020 -5.4 -0.2 16.7 0.0 1.32
Singapore 2021 7.8 0.9 16.8 0.0 1.30
2022 3.6 1.0 16.3 0.5 1.28
2020 -1.0 0.5 4.6 0.50 1,090
South Korea 2021 4.0 1.6 4.2 0.50 1,115
2022 3.2 1.3 4.1 0.75 1,040
2020 3.1 -0.2 13.8 1.13 27.5
Taiwan 2021 6.5 1.5 13.4 1.13 27.5
2022 2.7 1.1 12.7 1.25 27.5
2020 -6.1 -0.8 3.3 0.50 30.0
Thailand 2021 2.3 1.1 2.0 0.50 29.1
2022 5.2 1.3 4.6 0.50 30.5
2020 2.8 3.2 4.5 4.00 23,130
Vietnam 2021 8.0 3.2 4.2 4.00 23,280
2022 7.0 3.0 3.5 4.00 23,150
Source: Centennial Asia Advisors
Notes: In the case of Singapore, policy rate corresponds to the slope of the S$NEER policy band; we use the 7-day repo rate for China;
we use the refinancing rate for Vietnam
18Edition 9 June 2021 19
Voice of Asia

                In need of a booster shot:
                Asia's green recovery
                after the pandemic

                A
                        LONG with rising levels of wealth and              Tackling climate change and advancing the
                        prosperity across the region, Asia's               SDGs requires a joint effort by businesses and
                        economic transformation in recent                  governments. An environment designed to
                decades has also brought with it a monumental              foster business engagement in sustainability
                rise in greenhouse gas (GHG) emissions. The                through supportive policies and more extensive
                effects of global warming are already beginning            infrastructure, coupled with more proactive steps
                to create lasting impacts on the world's climate           taken by companies to leverage their strengths
                system and people's livelihoods. Asia is the               and find synergies with governments, will help to
                world's most populous continent and home to                accelerate the green transition.
                some of the countries most vulnerable to the
                effects of climate change, giving policymakers             COVID-19: The great wakeup call
                and business executives the necessary impetus
                to tackle the issue head on. After all, the actions        The outbreak of COVID-19 not only interrupted
                taken in Asia could well determine the future fate         the days of business-as-usual, but also served as a
                of our planet.                                             stark wakeup call to governments and corporations
                                                                           on the need to attach sufficient importance to the
                Deloitte China, along with the Boao Forum for              challenge of sustainable development and to take
                Asia and the Central Asia Regional Economic                decisive action accordingly.
                Cooperation Institute jointly conducted a survey
                of around 70 businesses operating across Asia,             While much of Asia has returned to normalcy, the
                gauging their views on the global economic                 latest outbreak in India, which has seen record
                recovery after COVID-19 and what measures                  levels of daily new infections, has reminded us
                they are taking in accordance with the United              that many national healthcare systems across
                Nations Sustainable Development Goals (SDGs).              the region, for example, remain fragile and
                The survey reveals that while most businesses in           vulnerable to large scale crises. This renewed rise
                the region are aware of the pressing need to act,          in infections has heightened the need for closer
                they are not taking bold enough steps to make a            regional and global cooperation in distributing
                meaningful difference. Difficulties in quantifying         desperately-needed medical resources and
                the impact of their actions in realizing the SDGs          vaccines to those countries in need, while also
                is proving to be the largest obstacle holding              underscoring the reality that no one single
                businesses back. Furthermore, when examining               country is safe until every country has the virus
                the current sources of energy used by businesses,          under control.
                it is clear that there is still much more work to
                be done by both the public and private sectors to          Our elevated awareness of sustainability during
                replace fossil fuels with renewable energy.                the pandemic has been particularly acute around

                                                                      20
Edition 9 June 2021
the issue of climate change. As COVID-19 swept carbon neutral by 2050 and to triple the share
through the continent, containment measures of renewables in Japan's energy mix to at least
imposed by governments in Asia led to a temporary 50%. South Korea followed just two days later. As
lapse in GHGs. The closing of borders, restrictions part of a Korean New Deal, President Moon Jae-
on the movement of people, and shifts in energy in pledged that the country would reach net-zero
demand all led to a reduction of transportation emissions by 2050, driven by a switch from coal
and consumption, and with it, a sharp drop in to renewables, and the creation of new markets,
carbon emissions. This was especially noticeable industries, and jobs.
in the region's largest economies. Between
January and April 2020, China's emissions fell by While these high-level announcements were
more than 10% compared to the same period the welcomed by international environmental
previous year. Stringent measures taken by the organizations, such grandiose statements alone
likes of India and Japan to confine the movement will not get us to net-zero. Coordinated action by
and activities of respective populations during businesses and governments will be necessary to
the pandemic equally resulted in a rapid decline win the battle against climate change, and this
in emissions. will involve addressing many of the lingering
challenges that constrain more audacious actions.
Much to the relief of the international community,
2020 saw some of Asia's largest economies Addressing the challenge of impact assessment
announcing their own national climate pledges. is essential to encouraging more sustainable
On September 22, Chinese President Xi Jinping business practices
announced to the United Nations General
Assembly that China will peak carbon emissions According to our survey findings, more than 80%
before 2030 and achieve carbon neutrality by of businesses are aware of the main messaging
2060. Despite tensions running high, recent behind the Paris Climate Accords and the
signs of greater cooperation between China and pledges made by the world's major economies.
the United States on the climate front are also More stringent environmental legislation and
indicative of the importance both governments increasing public expectations are also pushing
attach to the issue and their commitment to companies to proactively work to address climate
curbing global warming. change and pursue sustainable development. Yet,
how they will measure the impact of their positive
On October 26, little more than a month later, climate actions remains a key challenge inhibiting
Japanese Prime Minister Yoshihide Suga laid out businesses from taking bold enough measures to
a bold scheme that called for Japan to become implement the SDGs.
CHART 11
Does your business have sustainability and climate change goals or targets in place?
Yes, we have already set decarbonization targets
14%
Yes, we have already set renewable energy targets
35%
12%
Yes, we have already set environmental goals in areas
other than emissions reductions
No, but we are in the process of setting decarbonization targets 18%
No, and we do not currently have any related plans 21%
21Voice of Asia
While the survey shows that more than half a more sustainable lifestyle (72%) and using
of businesses have already set their own eco-friendly materials in the workplace (59%).
decarbonization targets (Chart 11), most More far-reaching measures that would have a
businesses are only taking convenient and greater impact on the broader ecosystem, such as
modest action (Chart 12). By and large, this has purchasing renewable energy (33%), have seen
been in the form of encouraging staff to lead much less uptake by businesses.
CHART 12
What actions is your organization taking as part of its current sustainability and
climate change efforts?
Encouraging more environmentally-sustainable practices by employees 72%
Using more sustainable materials 59%
Encouraging or requiring suppliers and/or partners to meet company-specific
52%
sustainability and climate change standards
Analyzing and increasing energy efficiency 44%
Purchasing renewable energy 33%
Offsetting carbon emissions 30%
Utilizing on-site distributed renewable energy projects 25%
Reducing air travel 14%
Other 14%
Linking performance targets of senior leaders with sustainable development 8%
0% 10% 20% 30% 40% 50% 60% 70% 80%
In understanding the reasons behind this, the Governments must therefore do what they can to
survey findings are clear. More than half of ease the pressure on businesses and encourage
respondents report that the inability to measure them to adopt more sustainable practices. Tax
the impact of their actions has prevented them incentives, carbon pricing, subsidies and risk-
from adopting business models more in line sharing mechanisms will help to spur innovation
with the SDGs (Chart 13). This has knock- and reduce the financial burden businesses face in
on consequences that further constrain their the clean transition. Frequent dialogue between
propensity for climate action. Since companies policymakers and company executives will also
are unable to measure their impact on global contribute to more informed business decisions
sustainable development, they will be less likely around sustainability. The international exchange
to conduct a clear and definitive cost-benefit of best practice and lessons learned could also
analysis on their sustainability solutions (37% offer a blueprint for businesses to accelerate their
lack such solutions), and will then be even less sustainable transition.
likely to staff the company with the qualified
talent needed to devise sustainable business
strategies (29% lack relevant personnel).
22Edition 9 June 2021
CHART 13
What are the key challenges preventing your organization from taking more
concrete sustainability and climate change-related measures?
Unable to measure impact 51%
Lack of cost-effective solutions 37%
Lack of internal subject matter expertise 29%
Difficult to formulate an impactful strategy 22%
Difficult to execute internally 17%
Other 10%
Lack of support from senior executives 5%
0% 10% 20% 30% 40% 50% 60%
On April 21, 2021, the day before the Leaders The lack of incentives and infrastructure
Summit on Climate, both China and the is hindering the transition by businesses
European Union delivered updates on their towards renewables
respective sustainable financing standards. With
the exclusion of fossil fuels from China's green Energy is the spark that underpins our modern
bond catalogue, the desire by both the two major civilization and enables our continued economic
economies to converge their financing standards advancements. The burning of fossil fuels,
for SDGs has become apparent. This could serve however, continues to account for a substantial
as a valuable example of governments offering portion of GHG emissions, despite the transition
consistent and harmonized standards in defining towards clean energy already being underway
sustainable practices for businesses, and could across Asia. While utilizing clean energy appears
further facilitate impact measurement and to be a simple solution for businesses to reduce
reporting across not only the two territories but their carbon footprint and advance their
in countries along the Belt and Road as well. sustainability targets, the survey finds that the
transition is taking place at a slower rate than
expected due to a lack of incentives and access
to infrastructure.
23Voice of Asia
CHART 14
What are the main sources of energy powering your organization's electricity
consumption?
Thermal power 61%
Hydropower 32%
Wind power 19%
Solar power 16%
Tidal storage power 12%
Other 10%
Nuclear power 4%
Biomass power 4%
Geothermal power 0%
0% 10% 20% 30% 40% 50% 60% 70%
Even as clean energy has accounted for a growing already begun to develop and implement varying
share of global primary energy consumption measures to manage and conserve energy, but
over the past decade, more than half of surveyed this has been largely motivated by concerns
businesses report that their predominant supply around profitability and business performance
of electricity stills comes from traditional sources rather than sustainability reasons.
such as thermal power (Chart 14). China is the
largest investor in clean energy in the world, The lack of infrastructure across many Asia
yet access to clean energy for businesses is Pacific countries is regarded by respondents as
insufficient, limited mainly to the Renewable one of the biggest constraints on their adoption
Energy Certificate and self-installed projects. of sustainable business practices. Possibly the
Other approaches such as direct purchasing clearest example of this missing link is the
agreements or direct investments are still being new energy vehicle (NEV) sector. Despite the
piloted in China. impressive strides made in improving long-
standing issues around safety, cost and battery
Besides from replacing fossil fuels with clean performance, nearly a quarter of organizations
energy, increasing the efficiency of energy usage report not having yet employed NEVs (Chart
is a feasible option for many companies that 15). Furthermore, only 10% of companies have
are not yet in a position to utilize alternative a vehicle fleet comprising more than 20% NEVs.
energy sources. As major consumers of energy, As with regular consumers, concerns around
even simple actions by businesses to optimize insufficient charging infrastructure have been the
or reduce their energy use could significantly biggest hindrance to greater adoption of NEVs by
influence overall emissions as well as their own businesses in Asia (Chart 16).
business performance. Most organizations have
24Edition 9 June 2021
CHART 15
What is the total proportion of new energy vehicles used by your organization
as a share of all vehicles?
None
10%
24%
Less than 10%
23%
10-20%
More than 20%
43%
CHART 16
Is the scale of new energy vehicle charging infrastructure sufficient in your
organization's host country?
Yes
25% 26%
No, the total amount of charging stations is insufficient
No, the spatial distribution of charging stations is unreasonable
6%
No, the total amount of charging stations is insufficient and
the spatial distribution of charging stations is unreasonable
43%
Governments should go beyond working to energy consumption. Governments can also help
enhance organizational awareness on the to raise the importance of climate goals in the
importance of energy sustainability goals to minds of business leaders, while also educating
taking decisive action to improve the scale of them on sustainable practices and helping them
available infrastructure for clean energy. Doing to see where the value lies from more sustainable
so will be the impetus businesses need to shift business models.
to a cleaner form of mobility and transform their
25Voice of Asia
Much work remains to be done to advance the businesses accessing and utilizing new energies
sustainable agenda will be removed. For companies, identifying how
their operations supplement global and regional
While the Asia Pacific region is showing signs of sustainability goals is also key to taking more
a formidable economic recovery following the targeted and coordinated action.
COVID-19 pandemic, the region still has a long
way to go in terms of curbing climate change The financial burden associated with the clean
and meeting the SDGs. Closer collaboration and transition that businesses face can also be
joint efforts by businesses and governments will significantly eased by government support. Risk
be essential. sharing mechanisms between governments
and enterprises such as subsidies, funds and
Firstly, governments should provide timely other incentives would alleviate the pressure on
information and guidance on new policies and businesses and give them more confidence to act.
convene dialogues with different stakeholders In doing so, businesses could respond with more
in order to reduce information asymmetries ambitious emissions reduction targets and take
and offer certainty for companies to invest in more meaningful steps in contributing to climate
sustainable business solutions. Businesses solutions.
can also do their part to reduce the knowledge
deficit by deepening their understanding of Lastly, international exchange can play a pivotal
climate change and sustainability, allowing them role in both regional and global sustainability
to effectively formulate and implement more strategies. Given the borderless nature of GHGs,
informed sustainability strategies. coordinating joint action between countries will
be essential to tackling climate change. A system
Next, the expansion of sustainable infrastructure that is practical and grounded in science which
depends on government investment. More allows companies to measure the impact of their
policy incentives should be provided to foster business activities on wider sustainability efforts
technological innovation. By lowering the cost would be highly conducive to the establishment of
of renewable energy and investment in relevant more effective regional partnerships within and
infrastructure, the obstacles that get in the way of across sectors.
26Edition 9 June 2021
Acknowledgements
Our Voice of Asia series brings to life the challenges and opportunities facing the region today and
tomorrow. Voice of Asia is the result of significant collaboration across the Deloitte Asia Pacific and
Global Network.
The following economists contributed to creating the rich tapestry of insights that feature in Voice
of Asia, Edition 9 June 2021:
Manu Bhaskaran Chris Richardson
CEO, Centennial Asia Advisors Pte Ltd; Partner,
Alliance Partner, Canberra
manu@centennialasia.com chrichardson@deloitte.com.au
Rumki Majumdar Yu Zhao
Associate Director, Deloitte Research Manager,
Bengaluru Beijing
rumajumdar@deloitte.com zhaoyu@deloitte.com.cn
Spencer Yao Shiro Katsufuji
Clients & Industries Leader, Director,
Taiwan Tokyo
speyao@deloitte.com.tw shiro.katsufuji@tohmatsu.co.jp
SukKi Kim Sitao Xu
Partner, China Chief Economist and Partner,
Seoul Voice of Asia Leader,
sukkim@deloitte.com Beijing
sxu@deloitte.com.cn
27Voice of Asia
28Sign up for Deloitte Insights updates at www.deloitte.com/insights.
Follow @DeloitteInsight
About Deloitte Insights
Deloitte Insights publishes original articles, reports and periodicals that provide insights for businesses, the public sector
and NGOs. Our goal is to draw upon research and experience from throughout our professional services organization,
and that of coauthors in academia and business, to advance the conversation on a broad spectrum of topics of interest to
executives and government leaders.
Deloitte Insights is an imprint of Deloitte Development LLC.
About this publication
This publication contains general information only, and none of Deloitte Touche Tohmatsu Limited, its member firms, or
its and their affiliates are, by means of this publication, rendering accounting, business, financial, investment, legal, tax,
or other professional advice or services. This publication is not a substitute for such professional advice or services, nor
should it be used as a basis for any decision or action that may affect your finances or your business. Before making any
decision or taking any action that may affect your finances or your business, you should consult a qualified professional
adviser.
None of Deloitte Touche Tohmatsu Limited, its member firms, or its and their respective affiliates shall be responsible for
any loss whatsoever sustained by any person who relies on this publication.
About Deloitte
Deloitte refers to one or more of Deloitte Touche Tohmatsu Limited, a UK private company limited by guarantee (“DTTL”),
its network of member firms, and their related entities. DTTL and each of its member firms are legally separate and
independent entities. DTTL (also referred to as “Deloitte Global”) does not provide services to clients. In the United States,
Deloitte refers to one or more of the US member firms of DTTL, their related entities that operate using the “Deloitte”
name in the United States and their respective affiliates. Certain services may not be available to attest clients under the
rules and regulations of public accounting. Please see www.deloitte.com/about to learn more about our global network of
member firms.
Copyright © 2021 Deloitte Development LLC. All rights reserved.
Member of Deloitte Touche Tohmatsu Limited
Designed by CoRe Creative Services. RITM0707043You can also read