2021 Pipeline Outlook Reviewing The Deficit Myth - SL-Advisors
←
→
Page content transcription
If your browser does not render page correctly, please read the page content below
2021 Pipeline Outlook

Reviewing The Deficit Myth
Stephanie Kelton’s The Deficit Myth opens with the startling
assertion that the only reason today’s fiat currencies have
any value is because citizens need to acquire them to pay
taxes. Without that requirement, there would be no need to
hold dollars, euros or yen. I first heard this argument from
Warren Mosler twenty five years ago when he was a partner in
hedge fund Illinois Income Investors in West Palm Beach. I
found this view quixotic at the time, although our meeting was
too brief to fully refute it. Today Mosler is regarded as the
father of Modern Monetary Theory (MMT), seized by progressive
Democrats as evidence that the Federal government can pay for
everything.

To prove that tax liabilities are necessary to give money
value, Kelton recounts a story I heard personally from Mosler
in the 1990s. Suppose he assigned household chores to his
children with payment promised in business cards. With little
of value being offered in exchange for the work, the lawn
would remain uncut and the car unwashed. But if Mosler the Dad
then imposes a monthly tax of 30 business cards from each
offspring, on pain of being grounded, they suddenly have
value. The work gets done.

From this follows the logic that the government needs to spend
money in order to provide the means with which to pay taxes.
The government, as the sole issuer of currency, can pay in
regular green dollars, or in yellow interest-bearing dollars
(i.e. they can borrow to pay their bills). They can never run
out. So they can never go bankrupt. Therefore, deficits don’t
matter unless they exhaust the economy’s productive capacity,
which is inflationary.

I’m still not convinced taxes are necessary to give a fiat
currency value, although behind every such currency lies a
government taxing and spending it. For much of human history
money has been linked to gold. When the US left the gold
standard in 1971, the severing of the link ushered in fiat
currencies that derived their value from the issuing country’s
policies. But it’s definitely clear that a country can never
be forced into bankruptcy in its own fiat currency, as they
can always issue an unlimited amount to pay their bills. In
this narrow sense, debt doesn’t matter.

So far, this is a non-partisan exercise in economic theory.

Kelton then seizes the access to unlimited credit to gorge on
a left wing dream of largesse. Trillions of dollars are
breezily allocated to student loan forgiveness, upgrading our
infrastructure, fighting climate change and dealing with the
pandemic. Because the Federal government can never go
bankrupt, deficits don’t matter. The twin looming crises of
social security and Medicare don’t matter, because the
government will spend whatever it needs to, since its ability
to borrow in its own currency is unlimited.
It sounds implausible, but here Kelton misses the opportunity
to strengthen her case. Today, America’s fiscal outlook
provokes widespread hand wringing and dismay. Retiring baby
boomers will command an unsustainably growing chunk of Federal
spending. There is nothing remotely optimistic to be said on
the topic. Yet long term government bond yields remain
defiantly low. The empirical evidence that deficits don’t
matter exists in Uncle Sam’s continued ability to fund its
needs at rates below inflation. An even more brazen MMT
advocate would argue low bond yields are the market’s
vindication that deficits don’t matter.

The failure of conventional economic thinking to explain
apparently costless fiscal profligacy offers at least an
opening for the progressives who have hijacked MMT to drive
through. Kelton misses her chance.

The risk is of course inflation. If the government tries to
pay for more output than the economy is able to provide,
inflation will follow. If Mosler the Dad started adding new
chores, he’d have to offer more business cards per hour to
motivate his exhausted children. Had his progeny begun saving
these cards for the future, the resulting inflation would
diminish their value. Kelton does admit to limits on spending,
but these are imposed by inflation not deficits. She argues
that government spending should rise until it’s inflationary,
ensuring maximum utilization of the economy’s potential.

That is in effect current policy, administered by the Federal
Reserve’s twin objectives of maximum employment consistent
with stable inflation. Kelton would prefer the Federal
government was explicitly responsible for the twin mandate
rather than the Fed. In doing so they would rely on fiscal,
rather than monetary policy.

Since inflation has remained so consistently low that the Fed
is trying to overshoot its 2% target, it’s a reasonable
argument that pursuing NAIRU (the Non-Accelarating Inflation

Rate of Unemployment) through interest rate policy alone is
leaving millions of potentially productive people out of the
labor force. The Fed can be criticized for over-estimating
NAIRU, but there’s no reason to think Congress would do any
better. They would inevitably synchronize economic booms even
more closely with the election cycle, and there would be no
reason to expect anything but a bad outcome. This is why
independent central banks are part of every well-run economy.

However, Kelton goes further, advocating government spending
until everyone has a job, supported by a Federal jobs program
for all. “The federal government announces a wage (and
benefit) package for anyone who is looking for work but unable
to find suitable employment in the economy.” she writes.

Kelton’s faith that a huge program of useful jobs could be run
productively without abuse is naive. Would the government fire
lazy workers? Under her approach, “It takes workers as they
are, and where they are, and it fits the job to their
individual capabilities and the needs of the community.”

It would descend into a jobs program for those unemployable in
the private sector. Don’t MMT advocates even believe in
workers learning marketable skills?

Many questions are left unanswered. Most obviously, what would
the Federal government do when its spending caused inflation?
If the ability to issue debt in your own currency is so
valuable, why do countries give up sovereignty and join
currency unions, such as the euro, or peg their currency to
the dollar? What does MMT say about serial defaulters like
Argentina? What about Germany’s hyperinflation that preceded
the rise of Hitler? And while Kelton argues we should not
worry about future entitlement obligations, what would MMT
prescribe if those future payments ultimately drive up
inflation? She fails to identify a single country that has
successfully relied on deficits to maximize economic output.
MMT has become shorthand for unlimited government spending to
solve every problem progressives can identify. Stephanie
Kelton’s expansive vision of MMT’s possibilities cemented the
conviction of many that our economy needs protection from the
more liberal elements of Joe Biden’s party. It’s the type of
thinking that denied Democrats a stronger electoral showing.
Warren Mosler is rich enough to indulge such economic
fantasies today, but I doubt 25 years ago he would have
favored big government on such a scale.

In Lunch with the FT, journalist Brendan Greeley was
disappointingly deferential. There’s little insightful in
Kelton’s policy prescriptions. The type of profligate
government spending she advocates has invariaby led to ruinous
inflation elsewhere. If practised here, progressives would
likely blame a Wall Street conspiracy for the economic
destruction they had wrought. MMT isn’t a new idea, and isn’t
a new source of money for liberals to spend. It should drift
from the fringes of policy discussion to complete oblivion.

Stocks Are Still A Better Bet
Than Bonds
In late April, a month after the low, we noted how stocks were
cheap (see The Stock Market’s Heartless Optimism). The Equity
Risk Premium (ERP, the difference between the earnings yield
on the S&P500 and ten year treasury yields) is a useful
barometer of relative value between the two major asset
classes.

At the lows in March, the ERP on 2020 S&P50 earnings reached
5.0, and was 6.5 for 2021.

Now that the market has made a new all-time high, capping the
briefest bear market in history, it’s no longer cheap although
still attractive by historical standards. The 2020 ERP is 3.4
and 2021’s is 4.1.

The rally has mostly been characterized by multiple expansion.
No big stock epitomizes this more than Apple (AAPL), which has
almost tripled in value since the beginning of last year. It
used to trade at a low double digit earnings multiple – it’s
now at 30X 2021 Bloomberg consensus earnings. At $2TN in
market cap, AAPL is over 7% of the S&P500.
As 2021 earnings forecasts were revised down through the worst
of the pandemic, they still never dipped below last year’s. In
other words, even at the depths of Covid despair, the earnings
story remained that this was a one year hit that would see
profits quickly rebound to prior levels.

Earnings forecasts for the following year are typically most
optimistic in January. As time passes they are usually revised

downward, probably as cautious management guidance gets
reflected in analyst estimates. This makes it easier to
subsequently beat expectations. But in recent weeks, 2021
earnings forecasts have been revised up modestly. The improved
profits outlook has more than offset cautious guidance.

Given the impact on our lives and the relentless media reports
of death, the stock market has provided an almost offensively
optimistic perspective (see Is Being Bullish Socially
Acceptable?).

The ERP shows stocks to be cheap because interest rates remain
so low. Stocks are cheap relative to bonds. In the past we’ve
illustrated this by calculating how much money invested in
stocks would deliver the same ending value as $100 put into
ten year treasury securities. The dividend yield on the S&P500
is around 1.8%, 1.2% above the ten year. Dividends grow while
treasury coupon payments do not, and dividends are also taxed
at a lower rate – at least, for now. The result is that it
takes a lot less than $100 invested in stocks to match a ten
year bond, assuming stocks don’t wind up lower in a decade.

The contrast is especially stark when applied to pipeline
stocks. Enterprise Products Partners (EPD) maintained its
payout through the 2014-16 energy downturn and, so far,
through the Covid pandemic. Its dividend provides a 9.7%
yield, a level that might suggest a high degree of investor
concern about their prospects. However, bond investors see
little to worry them. EPD recently issued ten year notes that
currently yield 1.9%. A 30 year bond issued at the same time
yields 3.3%.
Using the assumptions in the table, an investor about to
commit $100 to EPD’s ten year debt could instead put just $8
into EPD common shares with the rest in cash (i.e. treasury
bills), and achieve the same return. Even in a highly
improbably EPD bankruptcy, a loss on the bonds of greater than
8% would still leave the equity as the less risky choice.

This math reflects the tyranny of low rates, and has been
driving investors into stocks for years. Inflexible investment
mandates that require holding bonds without regard to return
are keeping rates low. The stocks in the American Energy
Independence Index, of which EPD is a component, yield 8.8%.
For those with sufficient flexibility, the stocks of these
issuers are far more compelling than their bonds.

We are invested in EPD and all the components of the American
Energy Independence Index via the ETF that seeks to track its
performance.
Natural            Gas        Is      November’s
Winner
Citibank published some interesting research recently, making
the case for higher natural gas prices in the months ahead.
Oil production in the U.S. has fallen sharply as a result of
Covid. Gasoline demand has recovered from its low point in
April, but remains about 9% below normal.

Natural gas demand has shown much less impact, because it’s
not used in transportation. The chart shows that it’s running
the same as a year ago, although last week power consumption
dipped. Power outages from Tropical Storm Isaias may have been
partly to blame.

Citi’s forecast of higher natural gas relies on two factors:
the drop in oil production has also reduced output of
associated gas, which was most common in the Permian in west
Texas. Oil prices drive the economics of drilling in that
region. The resulting gas production was pressuring prices as
well as causing more flaring (watch Stop Flaring).

The second factor relies on a Biden administration, which is
looking the more likely outcome based on recent opinion polls.
The thinking is that a Federal initiative to lower CO2
emissions will start with accelerating the phase-out of coal-
burning power plants. This trend has been under way for
several years, and represents the easiest steps an incoming
President Biden could take to fulfill campaign pledges on
clean energy.
Deferred natural gas futures pushed higher in recent weeks,
reflecting higher prices a year out at the same time as
opinion polls continue to show Biden in front.

Natural gas power plants typically release half the CO2
emissions of coal for equivalent energy production, and are
also free of particulate matter and other pollution such as
nitrogen oxides, sulfur dioxide, mercury and other hazardous
substances that the local population inhales.

The Biden Plan for Climate Change targets “net-zero emissions
no later than 2050.” However, the Biden-Sanders Unity Task
Force says, “Democrats commit to eliminating carbon pollution
from power plants by 2035.” A Biden administration would be
under pressure from extreme liberals to adopt the more
aggressive target, which Citi believes is likely.
Citi Research calculates that retiring the nation’s coal
plants at a uniform rate would take approximately 10 Gigawatts
(GW) of power offline annually. Assuming these plants are
running at 48% capacity, as was the case last year, the
country would need to add 4.8 GW of new natural gas power
every year, requiring about 1 Billion Cubic Feet per Day
(BCF/D).

Foreign demand is also increasing — both China and India have
long term plans to use more natural gas. Nord Stream 2, which
is being built to supply more Russian gas to Europe, continues
to draw U.S. sanctions which may yet impede its ultimate
completion.

Last year, the U.S. produced 92 BCF/D of natural gas,
consuming 85 BCF/D domestically with the difference made up by
exports (5BCF/D) and withdrawals from storage (1.4 BCF/D).
Decommissioning coal plants could increase domestic demand by
1% or so annually.

So far, cheap natural gas has motivated the switch away from
coal. Citi expects higher prices to reduce the economic
advantage, but also believes this will stimulate increased
production by 2022.

Although Trump’s election victory was welcomed by energy
executives, their enthusiasm for a Republican administration
freed their animal spirits in recent years, and investors have
borne the cost. A pro-fossil fuel administration has been an
excuse for many upstream and a few midstream companies to dump
financial discipline and allocate capital with overly
optimistic assumptions.

It may seem perverse, but a Biden victory could be good for
pipeline investors, because it would impose a more cautious
 assessment of new projects. An industry held responsible for
climate change by extremists in the president’s party would
more likely be parsimonious in spending its cash.

New greenfield pipeline projects are already a non-starter
because of relentless legal challenges, which many investors
have welcomed (see Environmental Activists Raise Values on
Existing Pipelines). Solar and wind projects are just as
vulnerable to the same delaying tactics using the court
system. New England is famously opposed to new pipelines (see
An Expensive, Greenish Energy Strategy). But in 2017 an
offshore wind project also fell victim to interminable delays,
from property owners defending their ocean view (see After 16
Years, Hopes for Cape Cod Wind Farm Float Away).

Russell Gold recounted in Superpower: One Man’s Quest to
Transform American Energy the challenges that defeated Michael
Skelly in building high voltage transmission lines to send
electricity from windy, unpopulated regions to cities.
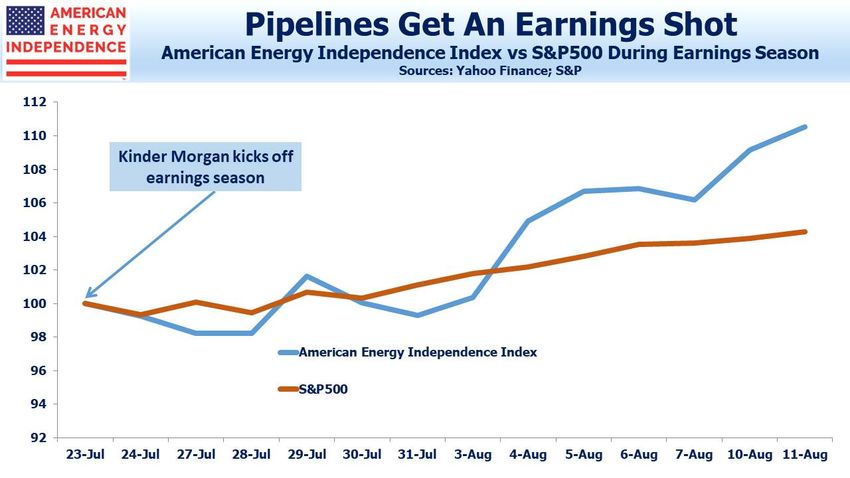
New natural gas power plants retain a substantial cost
advantage over renewables, even after many years of subsidies.
It’s likely that a sharp increase in solar and wind farms,
along with the associated power lines, will collide with the
same NIMBY opposition through court challenges. Energy
infrastructure that is already installed, such as natural gas
pipelines, has an advantage.

Much can change over the 79 days until the election, but
pipeline stocks have been outperforming the S&P500 since
earnings were kicked off by Kinder Morgan last month (see
Pipeline Earnings Provide A Boost). Dividend yields of 8-9%
are drawing buyers who are looking beyond the opinion polls.

There’s no reason for equity investors in midstream energy
infrastructure to be scared of a Biden presidency (listen to
our recent podcast, Joe Biden and Energy). Bond investors see
little of concern — Enterprise Products Partners (EPD) for
example recently issued 30 year debt at 3.2%, while their
equity offers a dividend yield over 9%. Compared with the past
four years, equity returns are likely to be much better.

We are invested in the names mentioned above and all the
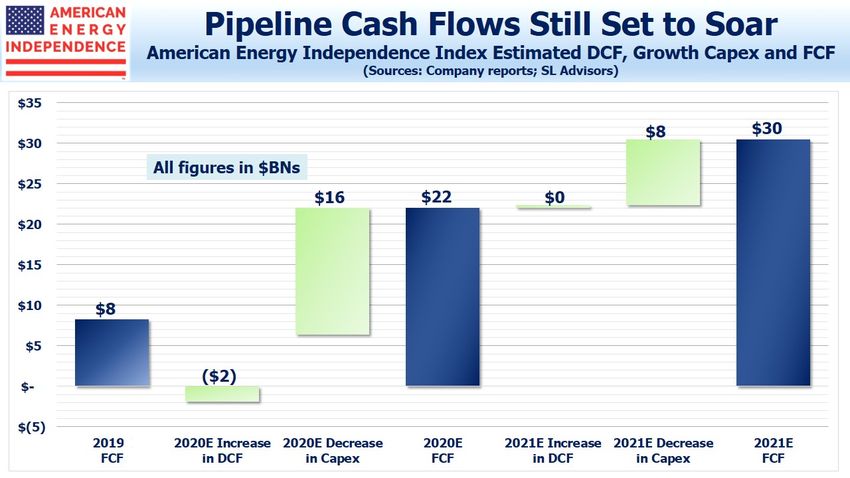
components of the American Energy Independence Index via the
ETF that seeks to track its performance.

Pipeline Earnings Provide A
Boost
Investors often ask, what will it take to get pipeline stocks
moving upwards? Attractive valuations and the prospect of
higher cashflows are compelling, but when will investors start
acting?

They may already being doing so. Kinder Morgan kicked off

earnings after the close on July 23rd. Since then, results for
the sector have generally come in as expected, with more
positive surprises than negative. The encouraging free cash
flow outlook remains intact (see Pipeline Cash Flows Will
Still Double This Year). The most positive among the big
companies was Williams Companies (WMB), whose earnings
scarcely showed any impact of the pandemic (see Williams Has
Covid Immunity). Their gathering and processing business held
up better than volumes across the country, and WMB took
another $100MM off their 2020 growth capex which further
cheered investors. WMB was up 8% following the announcement.
The two big Canadians, Enbridge (ENB) and TC Energy (TRP) were
both resilient. ENB even added $100MM to their growth capex
plans – they’re probably the only company that could do so
without seeing their stock sell off. TRP has one of the bigger
capex budgets, mostly driven by the perennially delayed
Keystone XL. Joe Biden has committed to withhold the required
Federal approval of this cross-border project, reflecting a
leftward shift in his platform. If he wins the election,
Canadian oil producers will suffer but investors in TRP will
likely benefit from higher free cash flow without the Keystone
spending.

Cheniere Energy (CEI) reported $405MM of cargo cancellation
revenues. Cheniere has always maintained that their 100%
investment grade customer base and very long term contracts
insulated the company from fluctuating volumes. Falling demand
for shipments of Liquified Natural Gas (LNG) caused some
weakness in CEI earlier in the quarter. The $405MM represents
some tangible evidence of the security of the contracts.
Typically, when a buyer cancels a contract CEI takes ownership
of the LNG shipment and is free to find a new buyer.

Energy Transfer (ET) remains one of the cheapest big pipeline
companies – their eye-popping 17% yield is in part because of
CEO Kelcy Warren’s opportunistic ethical lapses (see Energy
Transfer’s Weak Governance Costs Them). Questions remain
around their elevated leverage, which is still above 5X. Some
analysts would like to see them cut their distribution so as
to delever faster. The company believes they can rely on
growing EBITDA, although CFO Tom Long did say, “…the
distributions are a topic when we discuss how to get the
leverage down.” So that 17% yield isn’t secure.

Oneok (OKE) saw weaker than expected gathering and processing
results, and they revised full year EBITA guidance to the low
end of the range so they see continuing softness.

We thought Plains All American (PAGP), which is all crude oil,
should have done better in their Supply and Logistics (S&L)
segment. The dislocation in April was manifested by the
negative price for front month of futures. This should have
been a perfect environment to own storage assets in multiple
locations and the pipes to connect them. Disappointingly,
PAGP’s S&L segment adjusted EBITDA came in at only $3MM, and
is running at $144MM for the first half of the year. During
1H19 they did $478MM. Management has done a good job at
lowering analyst expectations for this business. Enterprise
Products Partners’ (EPD) Marketing segment turned storae and
contango opportunities into $185MM in 2Q20. PAGP should be
aiming higher.

Overall, midstream energy infrastructure earnings were good,
and with dividend yields still above 8% it is poised to move
higher.

We are invested in the names mentioned above and all the
components of the American Energy Independence Index via the
ETF that seeks to track its performance.
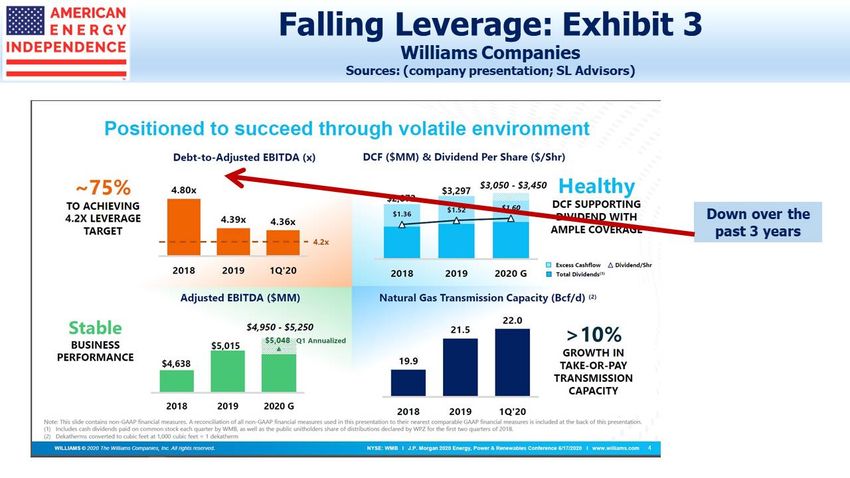
Williams Has Covid Immunity
Pipeline company earnings continue to provide reassurance
about their ability to grow cash flows (see Pipeline Cash
Flows Will Still Double This Year). Yesterday’s earnings call
with Williams Companies (WMB) was an example.

WMB’s 2Q adjusted EBITDA came in at $1,240MM, $48MM ahead of
expectations. For the full year they are guiding
conservatively to the low end of their prior range ($4.95BN-
$5.25BN). 2020 growth capex was reduced by another $100MM to
$1BN-$1.2BN. Like other pipeline companies, WMB’s continued
trimming of growth capex is boosting their cash flow
generation (see Pipeline Opponents Help Free Cash Flow).

Leverage has now come down to 4.31X Debt:EBITDA. Their $1.60
annual dividend still yields 7.5%, even after yesterday’s 8%
rally in the stock.
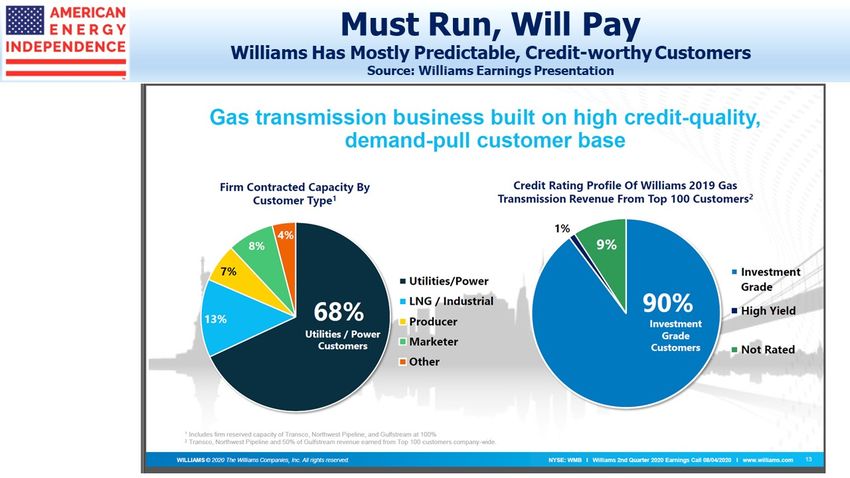
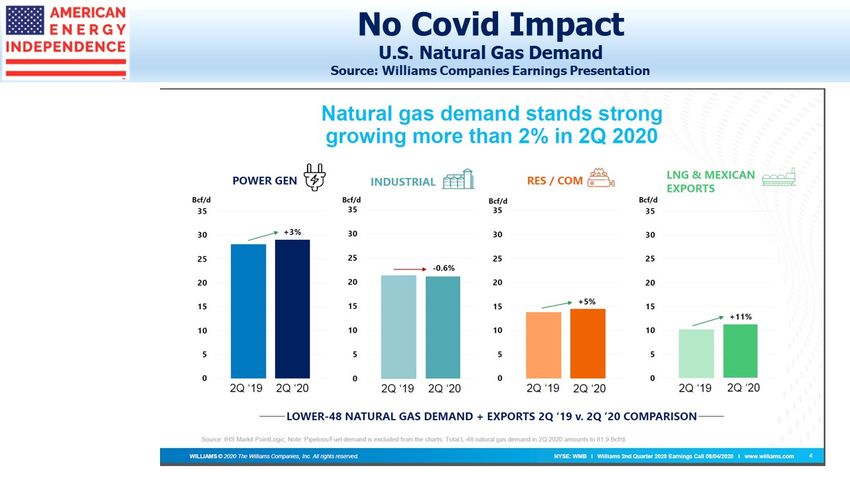
WMB is among the best positioned pipeline companies – almost
100% natural gas. Its gas transmission business, which is 44%
of EBITDA, is two thirds utilities and 90% investment grade.
Gathering and processing, which is the rest of the company,
has picked its customers well, growing 3.6% year-on-year even
while Lower-48 production is roughly flat.

CEO Alan Armstrong noted what we’ve pointed out recently, that
natural gas demand has remained strong and shows little impact
from the pandemic (see Energy Demand After Covid-19).
Armstrong also mentioned that canceled LNG shipments, the only
area of weakness, appear to be moderating in July.

Armstrong spoke to the complimentary relationship gas-fired
power generation has with solar and wind. Pairing always-
available gas with intermittent renewables allows for
increased use of both and lowers overall CO2 emissions. Since
natural gas is crucial to any serious green initiative, WMB
has a secure future (see Where America gets Its Power).

Transco, WMB’s extensive natural gas pipeline network that
runs from Texas to NY, sits beneath many dense population
centers. Given today’s uncertain regulatory process faced by
new projects and successful opposition from environmental
extremists (see Installed Pipelines Are Worth More), Armstrong
feels that WMB’s extensive existing infrastructure gives them
an advantage in expanding to meet growing demand. It’s much
less disruptove to add on to an existing network than to
embark on a new, greenfield project.

WMB’s business was neither helped nor hurt by Covid. In that
respect it offers more visibility, if less excitement, than
some of today’s high-fliers that are profiting from the new
stay-at-home lifestyle. In effect, WMB is immune to Covid. It
looks like a pretty cheap stock.

On a different topic, the owner of Jos A. Banks, Tailored
Brands, recently filed for bankruptcy. I have followed Jos A.
Banks with interest ever since 2008 when I saw Marc Cohodes, a
short seller, explain why “Buy One Get Two Free” was not a
sustainable business model for selling mens suits. I recounted
this in The Hedge Fund Mirage. Cohodes had a tragically bad
financial crisis for a short seller and for a time left
Finance in disgust (see A Hedge Fund Manager Finds More to
Like in Farming). On Jos A. Banks, Marc was early but
ultimately right.

We are invested in WMB and all the components of the American
Energy Independence Index via the ETF that seeks to track its
performance.

The     Biggest    Pipeline
Companies Are Doing Well
Last week Enbridge (ENB) and Enterprise Products (EPD), North
America’s two biggest pipeline companies, were among those
reporting earnings. Both beat expectations – ENB reported 2Q
EBITDA of $3,312MM versus $3,155MM, helped by strong results
in natural gas transmission. EPD came in at $1,961MM versus
$1,877MM, boosted by strength in crude oil. Dividend yields of
7.7% (ENB) and 10.1% (EPD) look secure.

The earnings calls that accompany quarterly results often
provide some interesting additions. The ENB call included
several exchanges with analysts on renewables. For example,
CEO Al Monaco noted, “…we know the supply profile is going to
change globally for energy. It’s not going to be a quick
transition by any stretch, but slowly renewables will be a
bigger portion.” He continued, “U.S. offshore wind is
certainly an attractive opportunity but… the supply chains are
not as developed yet”

Bill Yardley, President of Gas Transmission & Midstream,
added,“…on the ISO website… wind is 30 megawatts, natural gas
is 10,200. You could quadruple the amount of wind as they’re
projecting and it’s just–on the peak hours, it’s just not
there.”

Although ENB expects renewables to gain market share,
conventional fuels still get most of their spending on new
projects. Al Monaco explained, “In terms of the asset mix
today, I think when we repositioned the asset mix to almost
50/50, I’m going to call it, between natural gas and the
liquids businesses, with a little bit in there for renewables,
I think we’re happy with the mix there.”

Hydrogen as a potential renewable fuel has been drawing a lot
of interest recently. For example, on Nextera’s (NEE) call,
hydrogen appears 25 times in the transcript. But it’s still
way off in the future. Rebecca Kujawa, CFO, noted that NEE
is, “really excited about hydrogen, particularly in the 2030
and beyond time frame”

On the same topic, ENB’s Bill Yardley added, “Natural gas
pipeline networks may be repurposed for hydrogen at some point
in the future, if the economics work. To that end, It’s
extremely expensive – you know, is it green hydrogen, is it
blue hydrogen, how does it interact with the pipelines and the
actual steel in the pipeline, and that takes a lot of
engineering to look at. But you’re right – the network, and
this is decades from now, would be well positioned if hydrogen
transitioned from that shiny object that is potentially a
solution to a reality.”

EPD’s CEO Jim Teague often adds some colorful phrases and
humor to these calls. He referred to the prior quarter’s
conference call as a “COVID call” and opened last week by
saying, “…today, we are going to tell you our COVID story.”

Since EPD had beaten expectations during a tumultuous period
in energy markets, Teague immediately addressed the issue: “We
usually get the question of how much of our results are non-
recurring, and it is the same question we got when Katrina
blew through South Louisiana and literally knocked out every
plant we had…Demand came back before indigenous supply and we
made more money with our West to East pipelines than if those
plants had been running. So it was non-recurring.

“We got that question during Hurricane Ike in 2008… got the
question in Hurricane Harvey in 2017.” Teague continued,”
Events like what we are going through now, and the
opportunities they present may be labeled as non-recurring,
but our performance and our results are recurring regardless
of the environment.” In other words, the diversity and
naturally offsetting risks among business lines create the
opportunity for recurring upside surprise.
Crude oil dominates sentiment around pipelines, although
natural gas is more important. Little attention is paid to the
non-energy side of the business, such as plastics. Teague
reminded listeners that,“…the United States, especially in
ethylene, has quickly moved into being the world’s incremental
supplier.” He added, “In June, we loaded a record size
ethylene cargo of 44 million pounds.”

Growth capex is also falling as both companies are maintaining
strict return criteria. Teague said, “For 2021 and 2022, we
currently anticipate growth capital investments to be
approximately $2.3 billion and $1 billion respectively. This
is an aggregate $700 million reduction from guidance we
provided for 2021 and 2022, at the end of the first quarter.”
Last year EPD spent $4BN. Their Free Cash Flow in 2022 is on
track to have doubled in only three years.

Both companies can issue ten year debt “with a two handle”,
reflecting the confidence of bond investors in their balance
sheets and showing a     juxtaposition with their dividend
yields.

Earnings continue to support our expectation of strong cash
generation (see Pipeline Cash Flows Will Still Double This
Year). Listening to conference calls like these provides
further comfort around the outlook.

We are invested in ENB, EPD, and all the components of the
American Energy Independence Index via the ETF that seeks to
track its performance.

Lower    Spending                               Cheers
Pipeline Investors
In February, following our criticism of Kinder Morgan’s (KMI)
return on invested capital (see Kinder Morgan’s Slick
Numeracy) the company, to their credit, reached out to us so
as to better present their perspective. Our point was that
capital allocation decisions in recent years had not always
been accretive to equity. We offered the company an
opportunity to write a rebuttal which we promised to publish,
unedited, but they declined. So we summarized their response
(see Kinder Morgan Responds to our Recent Criticism).

Not long after, Covid dominated the news, and historic returns
on invested capital took a backseat to gauging current demand
destruction. KMI’s stock sank from $21 to under $10, before
recovering roughly halfway to $14.

KMI kicked off earnings reports for the sector last week. We
were most interested in their outlook, but also in their
planned growth capex. Industry-wide spending reductions are
driving improved profitability (see Pipeline Cash Flows Will
Still Double This Year).

KMI announced a $1BN goodwill writedown on natural gas
gathering and processing assets previously acquired. Although
a non-cash expense, this is an example of capital deployed
whose cash generation will no longer meet its target. KMI will
blame Covid, but nonetheless it’s a loss for shareholders.

The company confirmed guidance of $1.7BN in “expansion
opportunities” (we winced) for 2020. This is well below their
prior range of $2-3BN annually over the next decade, as
initially communicated in April during the depths of lost
production. Several questions followed on the earnings call –
in response to Shneur Gershuni of UBS, CEO Steve Kean allowed
that future capex, “looks like it hangs around the level we’re
seeing in 2020, maybe a little less.”

This cheered us, and later JPMorgan’s Jeremy Tonet asked, “…is
there a scenario where 2021, or maybe in 2022, where growth
CapEx could be as low as $1 billion?” We were left positively
giddy when Steve Kean replied, “We’re close, yes. We’re
close.”

When it comes to pipeline company growth capex plans, they
share the qualities of an overly vigorous golf swing – less is
more.
KMI’s adjusted EBITDA came in at $1,568MM versus expectations
of $1,634MM. They also lowered full year DCF to 11% below
budget (was previously 10% below). They still plan to increase
their dividend to $1.25 annually, which would yield over 8.5%
at the current stock price. They expect to reach 4.5X
Debt/EBITDA although conceded 4.7X is their likely year-end
level. They also pushed back the date at which they expect to
be a corporate taxpayer to 2026.

Meanwhile, domestic production is recovering along with
demand. In recent weeks, oil production has risen from 9.7
Million Barrels per Day (MMB/D) to 10.9 MMB/D, and the
industry now expects it to settle in around 11 MMB/D. That’s
still well below the pre-Covid level, which was on track to
hit 13 MMB/D by year’s end. But it’s improving. “It’s a slow,
slow recovery, but it’s happening,” said Alexandre Ramos-Peon,
a senior analyst at Rystad Energy, a consultancy.

Natural gas demand of 85.5 Billion Cubic Feet per Day (BCF/D)
remains close to a year ago of 89.4 BCF/D, exhibiting very
little response to Covid. LNG exports of 3.7BCF/D are down by
2.4 BCF/D, representing more than half the drop as global LNG
demand has softened somewhat. Overall, the market hasn’t
registered much impact.

Pipeline stocks such as KMI have dividend yields that reflect
considerable market skepticism regarding their longevity. Bond
investors harbor few doubts, as we noted recently in comparing
Enterprise Products Partners 30 year debt yields of around 3%
with the almost 10% dividend yield (see Pipelines Are Becoming
Less Risky). KMI just announced a 2050 maturity with a 3.25%
coupon. The chasm between dividends and bond yields in this
sector reflect rigid investor segmentation, and a
misallocation of capital by fixed income buyers who would
greatly benefit from the flexibility to incorporate some
equity risk.

Earnings reports from other big pipeline companies over the
next few weeks should provide confirmation of growing free
cash flow and secure dividends.

We are invested in EPD, KMI and all the components of the
American Energy Independence Index via the ETF that seeks to
track its performance.

Pipelines Are Becoming Less
Risky
Before the Shale Revolution, midstream energy infrastructure
was a boringly stable sector. MLPs, which predominated versus
corporations back then, paid out most of the cash they
generated and grew distributions through price escalators and
improved operating efficiencies. Volatility was low, and
attractive yields drew income-seeking investors. This happy
marriage started to fall apart in 2015, when the industry
embraced the same growth ethos that drove their upstream
customers. Leverage and volatility rose, causing distribution
cuts and the older, wealthy K-1 tolerant American investor
started to leave (see AMLP’s Shrinking Investor Base).

In conversations with investors, the subject of volatility
often comes up. Yields are attractive – the broad-based
American Energy Independence Index, AEITR yields 9.3% on a
trailing basis. Few cuts in payouts are likely as companies
report 2Q earnings. Kinder Morgan (KMI) maintained their
dividend in Wednesday’s release. Some had been questioning
whether Oneok (OKE) would maintain their dividend, but they
reaffirmed it on Thursday, yielding 13.4%. Legal uncertainty
remains around whether the Dakota Access Pipeline (DAPL) has a
secure future (listen to Judicial Over-Reach on the Dakota
Access Pipeline). Phillips 66 Partners, LP (PSXP) is most
exposed, but they’re only 0.6% of the AEITR. Although Energy
Transfer built DAPL and retains 36% ownership, it’s only 3.5%
of their EBITDA.

In summary, payment of today’s attractively high payouts is
likely to continue. Investors are trying to assess whether
they’ll need to endure further downside volatility while
clipping coupons.

Relative to the overall market, the movements of today’s
pipeline sector are more pronounced but still well short of
the 2015 collapse, when energy sector weakness didn’t spill
over into the S&P500. Early this year saw the biggest fall in
AEITR’s history, but the panic over Covid drove the S&P500
down in the first quarter too, as indiscriminate selling was
widespread. Although pipelines have rebounded strongly since
then, the AEITR remains down 27% for the year – 10% ahead of
the MLP-heavy Alerian Index, but still well short of matching
the market, which is in positive territory.

There are three reasons to think that more stability lies
ahead for the sector. First, spending on new projects peaked
in 2018, and the pandemic has caused every company to further
reassess plans for 2020. The result is that pipelines will
generate twice as much cash as they did last year (see
Pipeline Cash Flows Will Still Double This Year).
Second, closed end funds, whose selling in March exacerbated
an already extremely weak sector, have lost much of their
ability to repeat this performance. This is because heavy
losses destroyed much of their asset base, a development
welcomed by all except those unfortunate enough to have
assumed the fund managers practiced any responsible oversight
of their leverage (see The Virus Infecting MLPs).
Third and perhaps most importantly, pipeline companies are
reducing leverage. These slides from recent investor
presentations by Enterprise Products, Kinder Morgan and
Williams Companies are reflective of what’s happening across
the industry. Stronger balance sheets will reassure rating
agencies and investors that sharply rising free cash flow is
sustainable.

These are all reasons to believe that tomorrow’s pipeline
industry will return to the lower volatility and higher
returns of 5-10 years ago.

We are invested in EPD, ET, KMI, WMB and all the components of
the American Energy Independence Index via the ETF that seeks
to track its performance.

Covid By The Numbers
The recent news on Covid-19 has been mostly bad. Infections
are increasing sharply in sunbelt states, where Florida now
holds the record for two worst days’ new infections – 15,300
and 13,965, both reached last week. Reopening plans are being
halted. Even the Republican convention scheduled for late
August, which was moved from Charlotte, NC to Jacksonville, FL
(i.e. from a Democrat governor to a Republican one), has been
scaling back its planned attendance.

We’ve aimed to be apolitical in covering what is the biggest
story concerning investors nowadays (see Taking The Politics
Out Of Covid-19). Writing about this is a fraught subject –
you don’t want to get Covid-19, and there have been over
140,000 deaths each one of which is a tragic loss. It
continues to be a traumatic time for the country. My mother is
high risk, in assisted living, and our interactions with her
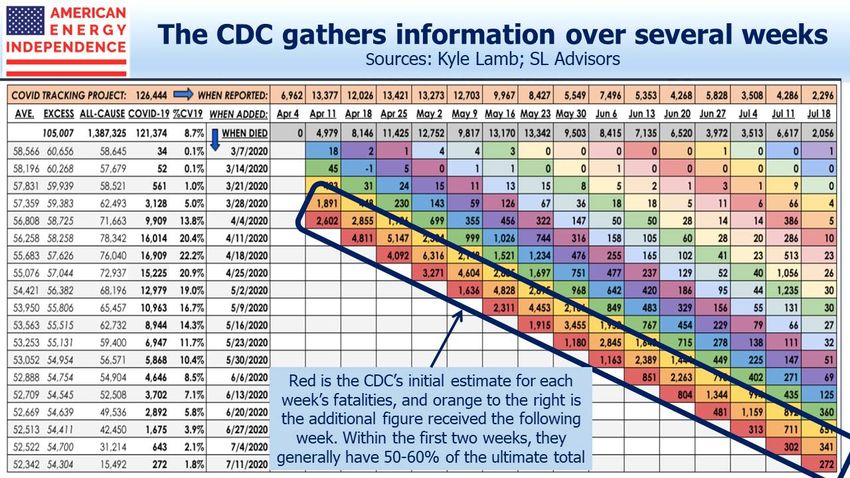
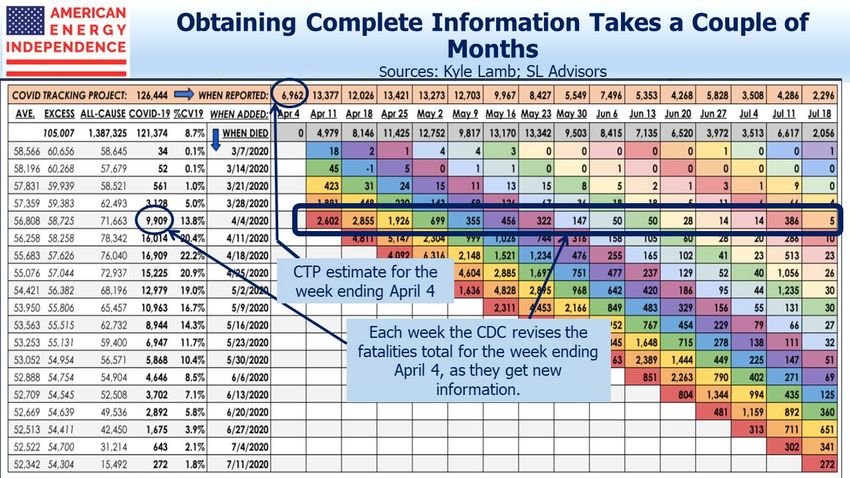
are constrained in both frequency and form.

Nonetheless, we focus on the data, which we interpret as more
optimistic than the media coverage for the overall population.
Some readers have criticized us for this. Equity markets
clearly have a more sanguine view (see Is Being Bullish
Socially Acceptable?), and investors may be wrong or they may
collectively also be interpreting the data as more positive.
We think it’s worth trying to understand the implied relative
optimism, as it contrasts so strongly with how many of us
feel.

With that preamble, let me introduce a fascinating table that
Kyle Lamb has recently posted on Twitter analyzing Covid-19
fatalities. Some effort is required to fully appreciate the
depth of information it contains – we’ll explain:

The Center for Disease Control (CDC) publishes a Provisional
Death Count which tracks “deaths involving Covid-19”. CDC data
relies on death certificates being processed, so lags by
several weeks the data published by the Covid Tracking Project
(CTP), which is what most media outlets use. Although both
produce weekly data, the CDC updates prior weeks for a couple
of months, as they receive new information.

For example, reading off the table for the week ending April
4, CTP shows 6,962. The CDC data shows 9,909, a figure they’ve
been revising up every week. The first time they reported a
figure for April 4 was on April 11, and it was 2,602. If you
sum all the colored cells horizontally, you get the fatality
total for the week in the “When Died” column.
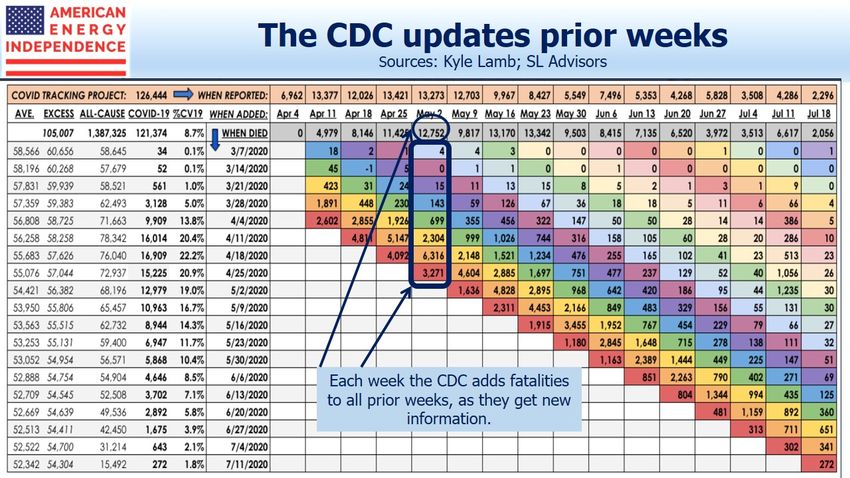
If you sum the colored cells vertically, you get what the CDC
revisions to prior weeks totaled.

Both have revised their websites to higher figures since the
table was produced.

What the table does is break down the CDC fatalities for any
given week into multiple weekly buckets to show when they were
reported. So the red cells show the CDC’s initial estimate of
fatalities for that week. Moving to the right, the orange
cells show the number of additional fatalities added to that
week’s total a week later.

So what’s the point? Although the CDC’s initial weekly
estimate is always revised up, after eight weeks they have
most of the data. Within the first two weeks, they typically
have 50-60% of the ultimate total for that week.

On April 18, the CDC reported 4,811 deaths for the prior week,
a figure that eventually rose to 16,014. The most recent week
on the table, ending July 18, shows 272 for the prior week
(more recently revised up to 1,099 on the CDC website, which
could mean faster reporting or increased fatalities). As the
CDC’s initial weekly estimates are falling, it’s reasonable to
assume that the ultimate figures will also fall. Clearly
sunbelt states are seeing increases, but today’s infected
patients are faring much better. They’re younger and are
benefitting from improved treatments. Nursing homes have
learned to better protect their highly vulnerable residents.
CTP fatalities remain well under half the levels of April,
when New York was the epicenter.

Stocks continue to trend higher. You should still wear a mask,
practice social distancing and wash your hands frequently, as
we do. But we’re getting through this.
You can also read