Efficient de novo assembly of eleven human genomes using PromethION sequencing and a novel nanopore toolkit - bioRxiv
←
→
Page content transcription
If your browser does not render page correctly, please read the page content below
bioRxiv preprint first posted online Jul. 26, 2019; doi: http://dx.doi.org/10.1101/715722. The copyright holder for this preprint (which
       was not peer-reviewed) is the author/funder, who has granted bioRxiv a license to display the preprint in perpetuity.
                                     It is made available under a CC-BY 4.0 International license.

      Efficient de novo assembly of eleven human genomes
      using PromethION sequencing and a novel nanopore
                             toolkit

                                                                  A Preprint

      Kishwar Shafin*,1 , Trevor Pesout*,1 , Ryan Lorig-Roach*,1 , Marina Haukness*,1 , Hugh E. Olsen*,1 , Colleen
      Bosworth1 , Joel Armstrong1 , Kristof Tigyi1,7 , Nicholas Maurer1 , Sergey Koren4 , Fritz J. Sedlazeck5 , Tobias
        Marschall6 , Simon Mayes3 , Vania Costa3 , Justin M. Zook8 , Kelvin J. Liu9 , Duncan Kilburn9 , Melanie
          Sorensen10 , Katy M. Munson10 , Mitchell R. Vollger10 , Evan E. Eichler10,7 , Sofie Salama1,7 , David
      Haussler1,7 , Richard E. Green1 , Mark Akeson1 , Adam Phillippy4 , Karen H. Miga4 , Paolo Carnevali†,2 , Miten
                                              Jain†,1 , and Benedict Paten†,1
                                1
                             UC Santa Cruz Genomics Institute, Santa Cruz, CA 95064, USA
                               2
                                 Chan Zuckerberg Initiative, Redwood City, CA 94063, USA
                          3
                            Oxford Nanopore Technologies, Oxford Science Park, OX4 4DQ, UK
      4
        Genome Informatics Section, Computational and Statistical Genomics Branch, National Human Genome
                                      Research Institute, Bethesda, MD 20892, USA
             5
               Baylor College of Medicine, Human Genome Sequencing Center, Houston, TX 77030, USA
                          6
                            Max Planck Institute for Informatics, 66123 Saarbrücken, Germany
               7
                 Howard Hughes Medical Institute, University of California, Santa Cruz, CA 95064, USA
                    8
                      National Institute of Standards and Technology, Gaithersburg, MD 20899, USA
                                      9
                                        Circulomics Inc, Baltimore, MD 21202, USA
      10
         Department of Genome Sciences, University of Washington School of Medicine, Seattle, WA 98195, USA
                                            *
                                              These authors contributed equally.
                                                 †
                                                   Corresponding Authors.

                                                                   Abstract

                Present workflows for producing human genome assemblies from long-read technologies have
                cost and production time bottlenecks that prohibit efficient scaling to large cohorts. We
                demonstrate an optimized PromethION nanopore sequencing method for eleven human
                genomes. The sequencing, performed on one machine in nine days, achieved an average
                63x coverage, 42 Kb read N50, 90% median read identity and 6.5x coverage in 100 Kb+
                reads using just three flow cells per sample. To assemble these data we introduce new
                computational tools: Shasta - a de novo long read assembler, and MarginPolish & HELEN -
                a suite of nanopore assembly polishing algorithms. On a single commercial compute node
                Shasta can produce a complete human genome assembly in under six hours, and MarginPolish
                & HELEN can polish the result in just over a day, achieving 99.9% identity (QV30) for
                haploid samples from nanopore reads alone. We evaluate assembly performance for diploid,
                haploid and trio-binned human samples in terms of accuracy, cost, and time and demonstrate
                improvements relative to current state-of-the-art methods in all areas. We further show that
                addition of proximity ligation (Hi-C) sequencing yields near chromosome-level scaffolds for
                all eleven genomes.

      K eywords Nanopore · Assembly · Polishing · PromethION · Human Genomes · Shasta · MarginPolish ·
      HELEN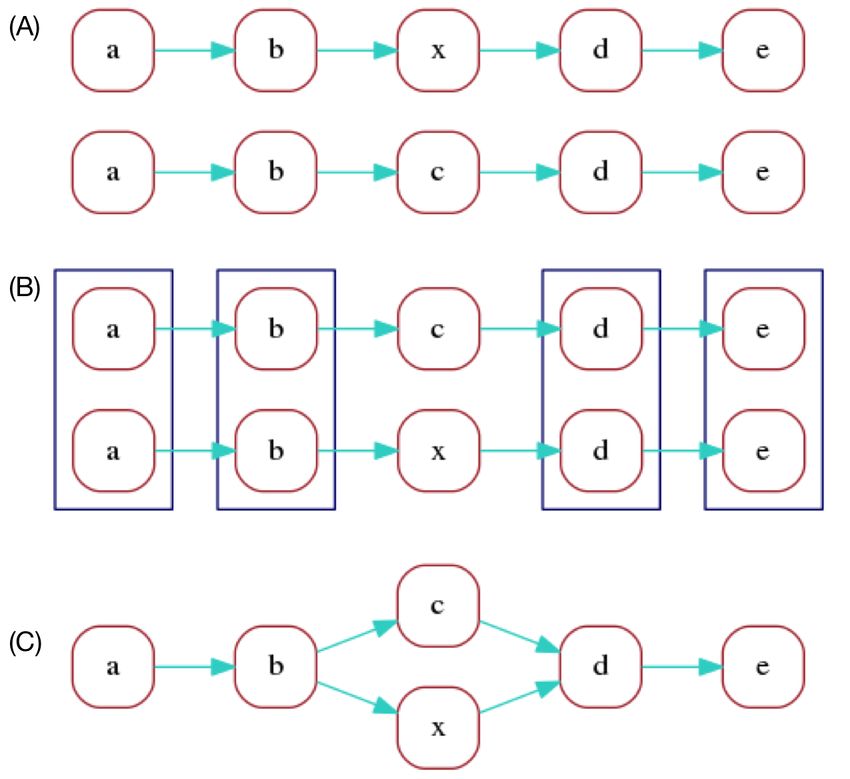
bioRxiv preprint first posted online Jul. 26, 2019; doi: http://dx.doi.org/10.1101/715722. The copyright holder for this preprint (which
       was not peer-reviewed) is the author/funder, who has granted bioRxiv a license to display the preprint in perpetuity.
                                     It is made available under a CC-BY 4.0 International license.

                                                                                                         A preprint - July 25, 2019

      Introduction
      Short-read sequencing reference-assembly mapping methods only assay about 90% of the current reference
      human genome assembly [1], and closer to 80% at high-confidence [2]. The latest incarnations of these
      methods are highly accurate with respect to single nucleotide variants (SNVs) and short insertions and
      deletions (indels) within this mappable portion of the reference genome [3]. However, short reads are much
      less able to de novo assemble a new genome [4], to discover structural variations (SVs) [5, 6] (including
      large indels and base-level resolved copy number variations), and are generally unable to resolve phasing
      relationships without exploiting transmission information or haplotype panels [7].
      Third generation sequencing technologies, including linked-reads [8, 9, 10] and long-read technologies [11, 12],
      get around the fundamental limitations of short-read sequencing for genome inference by providing more
      information per sequencing observation. In addition to increasingly being used within reference guided
      methods [1, 13, 14, 15], long-read technologies can generate highly contiguous de novo genome assemblies
      [16].
      Nanopore sequencing, as commercialized by Oxford Nanopore Technologies (ONT), is particularly applicable
      to de novo genome assembly because it can produce high yields of very long 100+ kilobase (Kb) reads [17].
      Very long reads hold the promise of facilitating contiguous, unbroken assembly of the most challenging regions
      of the human genome, including centromeric satellites, acrocentric short arms, rDNA arrays, and recent
      segmental duplications [18, 19, 20]. We contributed to the recent consortium-wide effort to perform the de
      novo assembly of a nanopore sequencing based human genome [17]. This earlier effort required considerable
      resources, including 53 ONT MinION flow cells and an assembly process that required over 150,000 CPU
      hours and weeks of wall-clock time, quantities that are unfeasible for production scale replication.
      Making nanopore long-read de novo assembly easy, cheap and fast will enable new research. It will permit
      both more comprehensive and unbiased assessment of human variation, and creation of highly contiguous
      assemblies for a wide variety of plant and animal genomes. Here we report the de novo assembly of eleven
      diverse human genomes at near chromosome scale using a combination of nanopore and proximity-ligation
      (HiC) sequencing [8]. We demonstrate a substantial improvement in yields and read lengths for human
      genome sequencing at reduced time, labor, and cost relative to earlier efforts. Coupled to this, we introduce
      a toolkit for nanopore data assembly and polishing that is orders of magnitude faster than state-of-the-art
      methods.

      Results
      Nanopore sequencing eleven human genomes in nine days

      We selected for sequencing eleven, low-passage (six passages), human cell lines of the offspring of parent-child
      trios from the 1000 Genomes Project (1KGP) [21] and Genome-in-a-Bottle (GIAB) [22] sample collections.
      The subset of 1KGP samples were selected to maximize allelic diversity and minimize passage (see Online
      Methods).
      We performed PromethION nanopore sequencing and HiC Illumina sequencing for the eleven genomes. Briefly,
      we isolated HMW DNA from flash-frozen 50 million cell pellets using the QIAGEN Puregene kit, with
      some modifications to the standard protocol to ensure DNA integrity (see Online Methods). For nanopore
      sequencing, we performed a size selection to remove fragments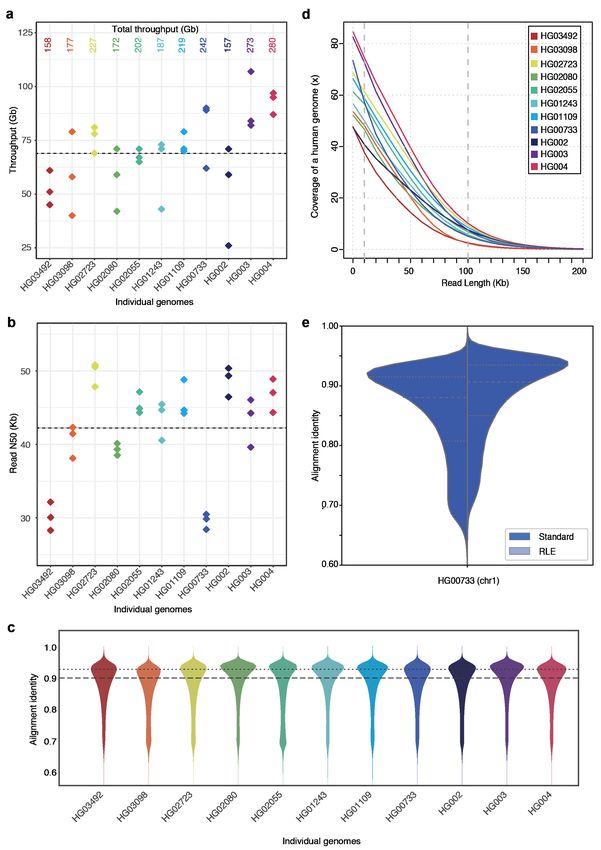
bioRxiv preprint first posted online Jul. 26, 2019; doi: http://dx.doi.org/10.1101/715722. The copyright holder for this preprint (which
       was not peer-reviewed) is the author/funder, who has granted bioRxiv a license to display the preprint in perpetuity.
                                     It is made available under a CC-BY 4.0 International license.

                                                                                                         A preprint - July 25, 2019

      Figure 1: Nanopore sequencing results. (a) Throughput in gigabases from each of three flowcells for
      eleven samples, with total throughput at top. (b) Read N50s for each flowcell. (c) Alignment identities
      against GRCh38. Medians in a, b and c shown by dashed lines, dotted line in c is mode. (d) Genome
      coverage as a function of read length. Dashed lines indicate coverage at 10 and 100 Kb. HG00733 is bolded
      as an example. (e) Alignment identity for standard and run-length encoded (RLE) reads. Data for HG00733
      chromosome 1 are shown. Dashed lines denote quartiles.

                                                                          3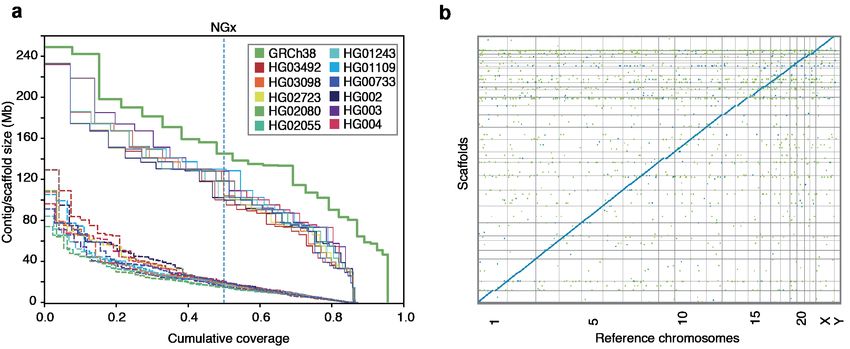
bioRxiv preprint first posted online Jul. 26, 2019; doi: http://dx.doi.org/10.1101/715722. The copyright holder for this preprint (which
       was not peer-reviewed) is the author/funder, who has granted bioRxiv a license to display the preprint in perpetuity.
                                     It is made available under a CC-BY 4.0 International license.

                                                                                                         A preprint - July 25, 2019

      the median and modal alignment identity was 90% and 93% respectively (Fig. 1c). The sequencing data per
      individual genome included an average of 55x coverage arising from 10 Kb+ reads, and 6.5x coverage from
      100 Kb+ reads (Fig. 1d). This was in large part due to size-selection which yielded an enrichment of reads
      longer than 10 Kb.

      Shasta: assembling a human genome from nanopore reads in under 6 hours

      To assemble the genomes, we developed a new de novo assembly algorithm, Shasta. Shasta was designed to
      be orders of magnitude faster and cheaper at assembling a human-scale genome from nanopore reads than
      the Canu assembler used in our earlier work [17]. A detailed description of algorithms and computational
      techniques used is provided in the Online Methods section. Here we summarize key points:
             • During most Shasta assembly phases, reads are stored in a homopolymer-compressed (HPC) form
               using Run-Length Encoding (RLE) [23, 24, 25]. In this form, identical consecutive bases are collapsed,
               and the base and repeat count are stored. For example, GATTTACCA would be represented as (GATACA,
               113121). This representation is insensitive to errors in the length of homopolymer runs, thereby
               addressing the dominant error mode for Oxford Nanopore reads [11]. As a result, assembly noise due
               to read errors is decreased, and significantly higher identity alignments are facilitated (Fig. 1e).
             • A marker representation of reads is also used, in which each read is represented as the sequence of
               occurrences of a predetermined, fixed subset of short k-mers (marker representation) in its run-length
               representation.
             • A modified MinHash [26, 27] scheme is used to find candidate pairs of overlapping reads, using as
               MinHash features consecutive occurrences of m markers (default m = 4).
             • Optimal alignments in marker representation are computed for all candidate pairs. The computation
               of alignments in marker representation is very efficient, particularly as various banded heuristics are
               used.
             • A Marker Graph is created in which each vertex represents a marker found to be aligned in a
               set of several reads. The marker graph is used to assemble sequence after undergoing a series of
               simplification steps.
             • The assembler runs on a single machine with a large amount of memory (typically 1-2 TB for a
               human assembly). All data structures are kept in memory, and no disk I/O takes place except for
               initial loading of the reads and final output of assembly results.
      To validate Shasta, we compared it against three contemporary assemblers: Wtdbg2 [28], Flye [29] and Canu
      [30]. We ran all four assemblers on available read data from two diploid human samples, HG00733 and
      HG002, and one haploid human sample, CHM13. HG00733 and HG002 were part of our collection of eleven
      samples, and data for CHM13 came from the T2T consortium [31].
      Canu consistently produced the most contiguous assemblies, with contig NG50s of 39.0, 31.3, and 85.8 Mb,
      for samples HG00733, HG002, and CHM13, respectively (Fig. 2a). Flye was the second most contiguous,
      with contig NG50s of 24.2, 24.9, and 34.2 Mb, for the same samples. Shasta was next with contig NG50s of
      20.3, 19.3, and 37.8 Mb. Wtdbg2 produced the least contiguous assemblies, with contig NG50s of 14.5, 12.2,
      and 13.6 Mb.
      Conversely, aligning the samples to GRCh38 and evaluating with QUAST [32], Shasta had between 3.6 to
      7.9x fewer misassemblies per assembly than the other assemblers (Supplementary Tables 4 and 5). Breaking
      the assemblies at these misassemblies and unaligned regions with respect to GRCh38, we observe much
      smaller absolute variation in contiguity (Fig. 2b, avg. NGA50s (Mb): Canu 18.5, Flye 15.2, Shasta 13.7,
      Wtdbg2 6.4). These results imply that Shasta trades some contiguity for a smaller overall misassembly rate
      vs. Canu and Flye. However, a substantial fraction of the misassemblies identified likely reflect SVs with
      respect to GRCh38. To address this we discounted misassemblies within centromeres and known segmental
      duplications, which are enriched in SVs, and, in the case of HG002, a set of known SVs [33]; we still observe
      between 1.3 and 2.9x fewer misassemblies in Shasta relative to the other assemblers (Fig. 2c).
      For HG00733 and CHM13 we examined a library of available bacterial artificial chromosome (BAC) assemblies
      (see Online Methods). The BACs were largely targeted at known segmental duplications (473 of 520 BACs lie
      within 10 Kb of a known duplication). Examining the subset of BACs for CHM13 and HG00733 that map to
      unique regions of GRCh38 (see Online Methods), we find Shasta contiguously assembles 46 of 47 BACs, with
      Canu and Flye performing similarly (Supplementary Table 6). In the full set we observe that Canu (401)

                                                                          4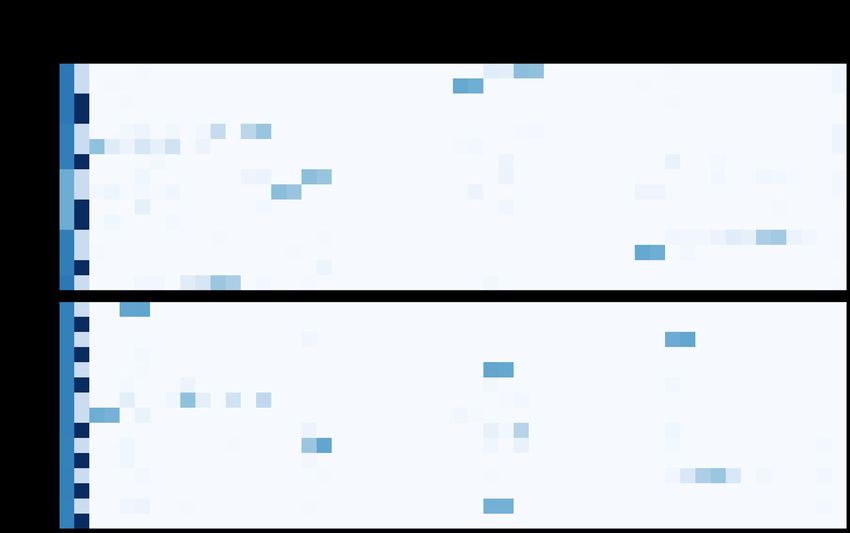
bioRxiv preprint first posted online Jul. 26, 2019; doi: http://dx.doi.org/10.1101/715722. The copyright holder for this preprint (which
       was not peer-reviewed) is the author/funder, who has granted bioRxiv a license to display the preprint in perpetuity.
                                     It is made available under a CC-BY 4.0 International license.

                                                                                                         A preprint - July 25, 2019

      Figure 2: Assembly results for four assemblers and three human samples, before polishing. (a)
      NGx plot showing contig length distribution. The intersection of each line with the dashed line is the NG50
      for that assembly. (b) NGAx plot showing the distribution of aligned contig lengths. Each horizontal line
      represents an aligned segment of the assembly unbroken by a misassembly or unmappable sequence with
      respect to GRCh38. The intersection of each line with the dashed line is the aligned NGA50 for that assembly.
      (c) Misassembly counts for regions outside of centromeres, segmental duplications and, for HG002, known
      SVs. (d) Total generated sequence length vs. total aligned sequence length (against GRCh38). (e) Balanced
      base-level error rates for assembled sequences. (f) Average runtime and cost for assemblers (Canu not shown).

                                                                          5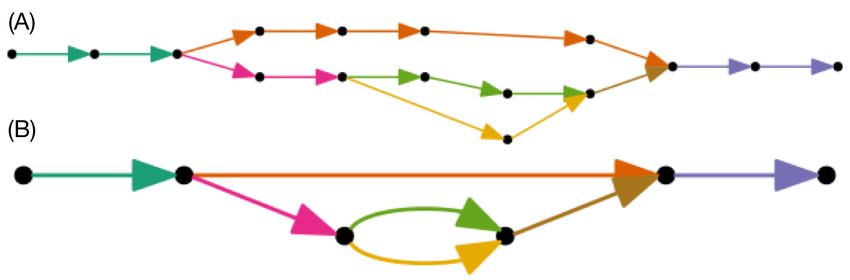
bioRxiv preprint first posted online Jul. 26, 2019; doi: http://dx.doi.org/10.1101/715722. The copyright holder for this preprint (which
was not peer-reviewed) is the author/funder, who has granted bioRxiv a license to display the preprint in perpetuity.
It is made available under a CC-BY 4.0 International license.
A preprint - July 25, 2019
and Flye (280) contigiously assemble a larger subset of these BACs than Shasta (131) and Wtdbg2 (107),
confirming the notion that Shasta is relatively conservative in these duplicated regions (Supplementary Table
7). Examining the fraction of contiguously assembled BACs of those attempted (that is, having a substantial,
unique overlap with only a single a contig in the assembly), we can derive a proxy to the specificity of these
assemblies. In this regard, Canu (0.88), Shasta (0.87) and Flye (0.84) perform similarly, with Wtdbg2 (0.65)
the outlier.
Canu consistently assembled the largest genomes (avg. 2.91 Gb), followed by Flye (avg. 2.83 Gb), Wtdbg2
(avg. 2.81 Gb) and Shasta (avg. 2.80 Gb). We would expect the vast majority of this assembled sequence to
map to another human genome. Discounting unmapped sequence, the differences are smaller: Canu produced
an avg. 2.86 Gb of mapped sequence per assembly, followed by Shasta (avg. 2.79 Gb), Flye (avg. 2.78 Gb)
and Wtdbg2 (avg. 2.76 Gb) (Fig. 2d; see Online Methods). Again, this analysis supports the notion that
Shasta is currently relatively conservative vs. its peers, producing the highest proportion of directly mapped
assembly per sample.
Shasta produced the most base-level accurate assemblies (avg. balanced error rate 1.13% on diploid and
0.63% on haploid), followed by Wtbdg2 (1.31% on diploid and 0.91% on haploid), Canu (1.46% on diploid
and 0.8% on haploid) and Flye (1.84% on diploid and 2.36% on haploid) (Fig. 2e); see Online Methods,
Supplementary Table 8.
Shasta, Wtdbg2 and Flye were run on a commercial cloud, allowing us to reasonably compare their cost and
run time (Fig. 2e; see Online Methods). Shasta took an average of 5.25 hours to complete each assembly
at an average cost of $70 per sample. In contrast, Wtdbg2 took 7.5x longer and cost 3.7x as much, and
Flye took 11.9x longer and cost 6.0x as much. The Canu assemblies were run on a large compute cluster,
consuming up to $19,000 (estimated) of compute and took around 4-5 days per assembly (see Online Methods,
Supplementary Table 9).
Contiguously assembling MHC haplotypes
The Major Histocompatibility Complex (MHC) region is difficult to resolve using short reads due to its
repetitive and highly polymorphic nature [34], but recent efforts to apply long read sequencing to this problem
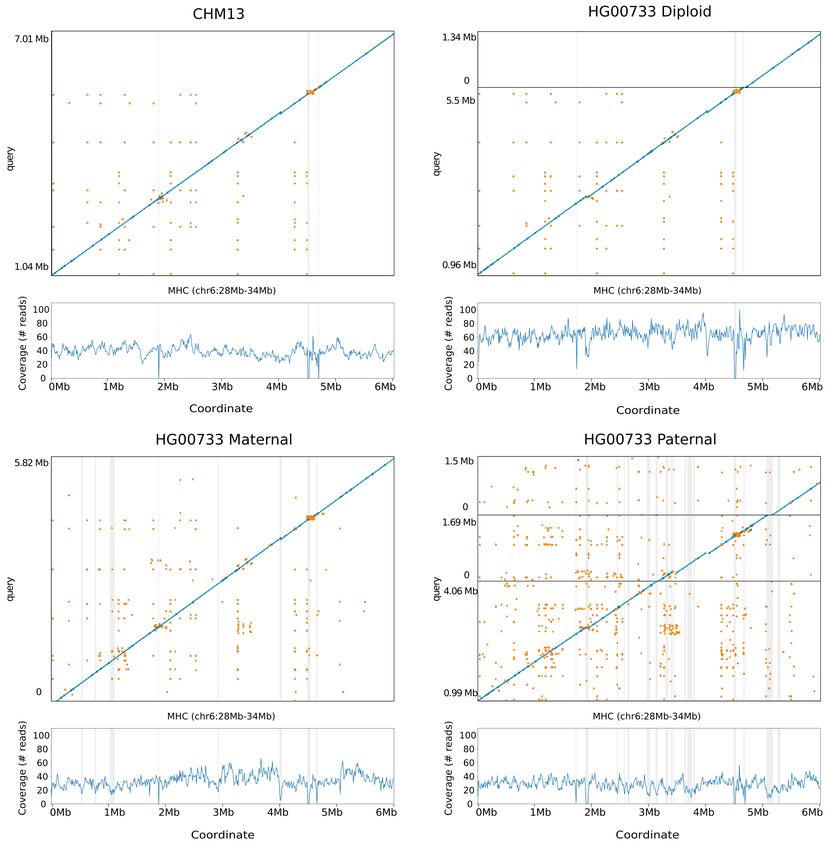
have shown promise [17, 35]. We analyzed the assemblies of CHM13 and HG00733 to see if they spanned
the region. For the haploid assembly of CHM13 we find MHC is entirely spanned by a single contig in all 4
assemblers’ output, and most closely resembles the GL000251.2 haplogroup among those provided in GRCh38
(Fig. 3a; Supplementary Fig. 1 and Supplementary Table 10). In the diploid assembly of HG00733 two
contigs span the large majority of the MHC for Shasta and Flye, while Canu and Wtdbg2 span the region
with one contig (Fig. 3b; Supplementary Fig. 2). However, we note that the chimeric diploid assembly leads
to sequences that do not closely resemble any haplogroup (see Online Methods).
To attempt to resolve haplotypes of HG00733 we performed trio-binning [36], where we partitioned all the
reads for HG00733 into two sets based on likely maternal or paternal lineage and assembled the haplotypes
(see Online Methods). For all haplotype assemblies the global contiguity worsened significantly (as the
available read data coverage was approximately halved, and further, not all reads could be partitioned),
but the resulting misassembly count decreased (Supplementary Table 11). When using haploid trio-binned
assemblies, the MHC was spanned by a single contig for the maternal haplotype (Fig. 3c, Supplementary Fig.
3, Supplementary Table 12), with high identity to GRCh38 and having the greatest contiguity and identity
with the GL000255.1 haplotype. For the paternal haplotype, low coverage led to discontinuities (Fig. 3d)
breaking the region into three contigs.
Deep neural network based polishing achieves QV30 long-read only polishing accuracy
Accompanying Shasta, we developed a deep neural network based consensus sequence polishing pipeline
designed to improve the base-level quality of the initial assembly. The pipeline consists of two modules:
MarginPolish and HELEN. MarginPolish uses a banded form of the forward-backward algorithm on a pairwise
hidden Markov model (pair-HMM) to generate pairwise alignment statistics from the RLE alignment of
each read to the assembly [37]. From these statistics MarginPolish generates a weighted RLE Partial Order
Alignment (POA) graph [38] that represents potential alternative local assemblies. MarginPolish iteratively
refines the assembly using this RLE POA, and then outputs the final summary graph for consumption by
HELEN. HELEN employs a multi-task recurrent neural network (RNN) [39] that takes the weights of the
MarginPolish RLE POA graph to predict a nucleotide base and run-length for each genomic position. The
6
bioRxiv preprint first posted online Jul. 26, 2019; doi: http://dx.doi.org/10.1101/715722. The copyright holder for this preprint (which
       was not peer-reviewed) is the author/funder, who has granted bioRxiv a license to display the preprint in perpetuity.
                                     It is made available under a CC-BY 4.0 International license.

                                                                                                         A preprint - July 25, 2019

      Figure 3: Shasta MHC assemblies vs GRCh38. Unpolished Shasta assembly for CHM13 and HG00733,
      including HG00733 trio-binned maternal and paternal assemblies. Shaded gray areas are regions in which
      coverage (as aligned to GRCh38) drops below 20. Horizontal black lines indicate contig breaks. Blue and
      green describe unique alignments (aligning forward and reverse, respectively) and orange describes multiple
      alignments.

                                                                          7
bioRxiv preprint first posted online Jul. 26, 2019; doi: http://dx.doi.org/10.1101/715722. The copyright holder for this preprint (which
was not peer-reviewed) is the author/funder, who has granted bioRxiv a license to display the preprint in perpetuity.
It is made available under a CC-BY 4.0 International license.
A preprint - July 25, 2019
RNN takes advantage of contextual genomic features and associative coupling of the POA weights to the
correct base and run-length to produce a consensus sequence with higher accuracy.
To demonstrate the effectiveness of MarginPolish and HELEN, we compared them with the state-of-the-art
nanopore assembly polishing workflow: four iterations of Racon polishing [40] followed by Medaka [41]. Here
MarginPolish is analogous in function to Racon, both using pair-HMM based methods for alignment and
POA graphs for initial refinement. Similarly, HELEN is analogous to Medaka, in that both use a deep neural
network and both work from summary statistics of reads aligned to the assembly.
Figure 4a and Supplementary Tables 13, 14 and 15 detail error rates for the four methods performed on the
HG00733 and CHM13 Shasta assemblies (see Online Methods) using Pomoxis [42]. For the diploid HG00733
sample MarginPolish and HELEN achieve a balanced error rate of 0.501% (QV 23.00), compared to 0.579%
(QV 22.37) by Racon and Medaka. For both polishing pipelines, a significant fraction of these errors are
likely due to true heterozygous variations. For the haploid CHM13 we restrict comparison to a highly curated
X chromosome sequence provided by the T2T consortium [31]. We achieve a balanced error rate of 0.095%
(QV 30.22), compared to Racon and Medaka’s 0.127% (QV 28.96).
For all assemblies, errors were dominated by indel errors, e.g. substitution errors are 6.26x and 9.67x fewer
than indels in the MarginPolish and HELEN on HG000733 and CHM13 assemblies, respectively. Many
of these errors relate to homopolymer length confusion; Fig. 4b analyzes the homopolymer error rates for
various steps of the polishing workflow for HG00733. Each panel shows a heatmap with the true length of
the homopolymer run on the y-axis and the predicted run length on the x-axis, with the color describing
the likelihood of predicting each run length given the true length. Note that the dispersion of the diagonal
steadily decreases. The vertical streaks at high run lengths in the MarginPolish and HELEN confusion-matrix
are the result of infrequent numerical and encoding artifacts (see Online Methods, Supplementary Fig. 4)
Figure 4c and Supplementary Table 16 show the overall error rate after running MarginPolish and HELEN
on HG00733 assemblies generated by different tools. The consistency in post-polishing error rates is evidence
that the models used are not strongly biased towards Shasta and that they can be usefully employed to polish
assemblies generated by other tools.
Figure 4d and Supplementary Table 17 describe average runtimes and costs for the methods (see Online
Methods). MarginPolish and HELEN cost a combined $108 and took 29 hours of wall-clock time on average,
per sample. In comparison Racon and Medaka cost $693 and took 142 wall-clock hours on average, per
sample.
Long-read assemblies contain nearly all human coding genes
To evaluate the accuracy and completeness of an assembled transcriptome we ran the Comparative Annotation
Toolkit [43], which can annotate a genome assembly using the human GENCODE [44] reference human gene
set (Table 1, Online Methods, Supplementary Tables 18, 19, 20, and 21.).
Table 1: CAT transcriptome analysis of human protein coding genes for HG00733 and CHM13.
Genes Missing Complete
Sample Assembler Polisher Found % Genes Genes %
Canu HELEN 99.741 51 67.038
Flye HELEN 99.405 117 71.768
HG00733 Wtdbg2 HELEN 97.429 506 66.143
Shasta HELEN 99.228 152 68.069
Shasta Medaka 99.141 169 66.27
Shasta HELEN 99.111 175 74.202
CHM13
Shasta Medaka 99.035 190 73.836
For the HG00733 and CHM13 samples we found that Shasta assemblies polished with MarginPolish and
HELEN were close to representing nearly all human protein coding genes, having, respectively, an identified
8bioRxiv preprint first posted online Jul. 26, 2019; doi: http://dx.doi.org/10.1101/715722. The copyright holder for this preprint (which
was not peer-reviewed) is the author/funder, who has granted bioRxiv a license to display the preprint in perpetuity.
It is made available under a CC-BY 4.0 International license.
A preprint - July 25, 2019
Figure 4: Polishing Results. (a) Balanced error rates for the four methods on HG00733 and CHM13. (b)
Row-normalized heatmaps describing the predicted run-lengths (x-axis) given true run lengths (y-axis) for
four steps of the pipeline on HG00733. (c) Error rates for MarginPolish and HELEN on four assemblies. (d)
Average runtime and cost.
9bioRxiv preprint first posted online Jul. 26, 2019; doi: http://dx.doi.org/10.1101/715722. The copyright holder for this preprint (which
was not peer-reviewed) is the author/funder, who has granted bioRxiv a license to display the preprint in perpetuity.
It is made available under a CC-BY 4.0 International license.
A preprint - July 25, 2019
ortholog for 99.23% (152 missing) and 99.11% (175 missing) of these genes. Using the restrictive definition that
a coding gene is complete in the assembly only if it is assembled across its full length, contains no frameshifts,
and retains the original intron/exon structure, we found that 68.07% and 74.20% of genes, respectively, were
complete in the HG00733 and CHM13 assemblies. Polishing the Shasta assemblies alternatively with the
Racon-Medaka pipeline achieved similar but uniformly less complete results.
Comparing the MarginPolish and HELEN polished assemblies for HG00733 generated with Flye, Canu and
Wtdbg2 to the similarly polished Shasta assembly we found that Canu had the fewest missing genes (just
51), but that Flye, followed by Shasta, had the most complete genes. Wtdbg2 was clearly an outlier, with
notably larger numbers of missing genes (506). For comparison we additionally ran BUSCO [45] using the
eukaryote set of orthologs on each assembly, a smaller set of 303 expected single-copy genes (Supplementary
Tables 22 and 23). We find comparable performance between the assemblies, with small differences largely
recapitulating the pattern observed by the larger CAT analysis.
Comparing to a PacBio HiFi Assembly
We compared the CHM13 Shasta assembly polished using MarginPolish and HELEN with the recently released
Canu assembly of CHM13 using PacBio HiFi reads [46]; HiFi reads being based upon circular consensus
sequencing technology that delivers significantly lower error rates. The HiFi assembly has lower NG50 (29.0
Mb vs. 41.0 Mb) than the Shasta assembly (Supplementary Fig. 5). Consistent with our other comparisons
to Canu, the Shasta assembly also contains a much lower misassembly count (1107) than the Canu based HiFi
assembly (8666), a difference which remains after discounting all misassemblies in centromeres and known
segmental duplications (314 vs. 893). The assemblies have an almost equal NGAx (~20.0Mb), but the Shasta
assembly covers a smaller fraction of GRCh38 (95.28% vs. 97.03%) (Supplementary Fig. 6, Supplementary
Table 24). Predictably, the HiFi assembly has ~4.7 fold fewer inserts and ~3.3 fold fewer deletes than the
Shasta assembly when aligned to the highly curated X chromosome assembly from v0.6 T2T consortium [31].
Although the HiFi assembly has less indels, both have comparable mismatches with HiFi assembly having
~1.4 fold fewer mismatches (Supplementary Table 25).
Assembling, polishing and scaffolding 11 human genomes at near chromosome scale
Figure 5: HiRise scaffolding for 11 genomes. (a) NGx plots for each of the 11 genomes, before (dashed)
and after (solid) scaffolding with HiC sequencing reads, GRCh38 minus alternate sequences is shown for
comparison. (b) Dot plot showing alignments between the scaffolded HG00733 Shasta assembly and GRCh38
chromosome scaffolds. Blue indicates forward aligning segments, green indicates reverse, with both indicating
unique alignments.
The median NG50 of the 11 Shasta assemblies is 18.5Mb (Fig. 5a), generally below the level required to
achieve complete chromosomes; to resolve the remaining contig breaks in the assemblies we scaffolded all of
the polished Shasta assemblies with HiC proximity-ligation data using HiRise [47] (see Online Methods). On
average, 891 joins were made per assembly. This increased the scaffold NG50s to near chromosome scale,
10bioRxiv preprint first posted online Jul. 26, 2019; doi: http://dx.doi.org/10.1101/715722. The copyright holder for this preprint (which
was not peer-reviewed) is the author/funder, who has granted bioRxiv a license to display the preprint in perpetuity.
It is made available under a CC-BY 4.0 International license.
A preprint - July 25, 2019
with a median of 129.96 Mb, as shown in Fig. 5a, with additional assembly metrics in Supplementary Table
26. Aligning HG00733 to GRCh38, we find no major rearrangements and all chromosomes are spanned by
one or a few contigs (Fig. 5b), with the exception of chrY, which is not present because HG00733 is female.
Similar results were observed for HG002 (Supplementary Fig. 7).
Discussion
In this paper we demonstrate the sequencing and assembly of eleven diverse human genomes in a time and
cost efficient manner using a combination of nanopore and proximity ligation sequencing.
The PromethION realizes dramatic improvements in yield per flow cell, allowing the sequencing of each
genome with just three flow cells at an average coverage of 63x. This represents a large reduction in associated
manual effort and a dramatic practical improvement in parallelism; a single PromethION allows up to 48 flow
cells to be run concurrently. Here we completed all 2.3 terabases of nanopore data collection in nine days on
one PromethION, running up to 15 flow cells simultaneously (it is now possible to run 48 concurrently). In
terms of contemporary long-read sequencing platforms, this throughput is unmatched.
Due to the length distribution of human transposable elements, we found it better to discard reads shorter
than 10 Kb to prevent multi-mapping. The Circulomics SRE kit reduced the fraction of readsbioRxiv preprint first posted online Jul. 26, 2019; doi: http://dx.doi.org/10.1101/715722. The copyright holder for this preprint (which
was not peer-reviewed) is the author/funder, who has granted bioRxiv a license to display the preprint in perpetuity.
It is made available under a CC-BY 4.0 International license.
A preprint - July 25, 2019
All three presented computational methods employ run-length encoding of reads. By operating on
homopolymer-compressed nucleotide sequences, we mitigate effects of the dominant source of error in
nanopore reads [53] and enable the use of different models for addressing alignment and run-length estimation
orthogonally.
Shasta produces a notably more conservative assembly than competing tools, trading greater correctness for
contiguity and total produced sequence. For example, the ratio of total length to aligned length is relatively
constant for all other assemblers, where approximately 1.6% of sequence produced does not align across the
three evaluated samples. In contrast, on average just 0.38% of Shasta’s sequence does not align to GRCh38,
representing a more than 4x reduction in unaligned sequence. Additionally, we note substantially lower
misassembly counts, resulting in much smaller differences between the raw NGx and corrected NGAx values.
Shasta also produces substantially more base-level accurate assemblies than the other competing tools.
MarginPolish and HELEN provide a consistent improvement of base quality over all tested assemblers,
with more accurate results than the current state-of-the-art long read polishing workflow. We note the
marginalization over alignments performed by MarginPolish as a likely source of this improvement, reinforcing
conclusions from previous work [1].
We have assembled and compared haploid, trio-binned and diploid samples. Trio binned samples show great
promise for haplotype assembly, for example contiguously assembling an MHC haplogroup, but the halving of
effective coverage resulted in ultimately less contiguous human assemblies with higher base-error rates than
the related, chimeric diploid assembly. This can potentially be rectified by merging the haplotype assemblies
to produce a pseudo-haplotype or increasing sequencing coverage. Indeed the improvements in contiguity and
base accuracy in CHM13 over the diploid samples illustrate what can be achieved with higher coverage of a
haploid sample. We believe that one of the most promising directions for the assembly of diploid samples is
the integration of phasing into the assembly algorithm itself, as pioneered by others [16, 54, 55]. We anticipate
that the novel tools we’ve described here are suited for this next step: the Shasta framework is well placed
for producing phased assemblies over structural variants, MarginPolish is built off of infrastructure designed
to phase long reads [1], and the HELEN model could be improved to include haplotagged features for the
identification of heterozygous sites.
Acknowledgements
The authors are grateful for support from the following individuals. Dan Turner, David Stoddart, Androo
Markham, and Jonathan Pugh (ONT) provided advice on method development and basecalling. Chris Wright
(ONT) provided advice for Medaka. Daniel Garalde, and Rosemary Dokos (ONT) provided advice on the
PromethION for parallelized DNA sequencing and basecalling.
The authors are grateful to Amazon Web Services (AWS) for hosting the data via their AWS Public Dataset
Program.
AP and SK were supported by the Intramural Research Program of the National Human Genome Research
Institute, National Institutes of Health. This work utilized the computational resources of the NIH HPC
Biowulf cluster (https://hpc.nih.gov).
Sidney Bell and Charlotte Weaver from Chan Zuckerberg Initiative (CZI) provided support on development
and documentation. CZI further supported this effort by funding the usage of Amazon Web Services (AWS)
for the project.
Certain commercial equipment, instruments, or materials are identified to specify adequately experimental
conditions or reported results. Such identification does not imply recommendation or endorsement by the
National Institute of Standards and Technology, nor does it imply that the equipment, instruments, or
materials identified are necessarily the best available for the purpose.
This work was supported, in part, by the National Institutes of Health (award numbers: 5U54HG007990,
5T32HG008345-04, 1U01HL137183, R01HG010053, U01HL137183, and U54HG007990 to BP and DH;
R01HG010329 to SRS and DH), by Oxford Nanopore Research Grant SC20130149 (MA), and the Howard
Hughes Medical Institute (DH).
12bioRxiv preprint first posted online Jul. 26, 2019; doi: http://dx.doi.org/10.1101/715722. The copyright holder for this preprint (which
was not peer-reviewed) is the author/funder, who has granted bioRxiv a license to display the preprint in perpetuity.
It is made available under a CC-BY 4.0 International license.
A preprint - July 25, 2019
Online Methods
Sample selection
The goal of sample selection was to select a set of individuals that collectively captured the maximum amount
of weighted allelic diversity [56]. To do this, we created a list of all low-passage lymphoblastoid cell lines
that are part of a trio available from the 1000 Genomes Project collection [57] (We selected trios to allow
future addition of pedigree information, and low-passage line to minimize acquired variation). In some cases,
we considered the union of parental alleles in the trios due to not having genotypes for the offspring. Let a
weighted allele be a variant allele and its frequency in the 1000 Genomes Project Phase 3 VCF. We selected
the first sample from our list that contained the largest sum of frequencies of weighted alleles, reasoning that
this sample should have the largest expected fraction of variant alleles in common with any other randomly
chosen sample. We then removed the variant alleles from this first sample from the set of variant alleles in
consideration and repeated the process to pick the second sample, repeating the process recursively until we
had selected seven samples. This set greedily, heuristically optimizes the maximum sum of weighted allele
frequencies in our chosen sample subset. We also added the three Ashkenazim Trio samples and the Puerto
Rican individual (HG00733). These four samples were added for the purposes of comparison with other
studies that are using them [22].
Cell culture
Lymphoblastoid cultures for each individual were obtained from the Coriell Institute Cell Repository
(coriell.org) and were cultured in RPMI 1640 supplemented with 15% fetal bovine serum (Life Technologies).
The cells underwent a total of six passages (p3+3). After expansion, cells were harvested by pelleting at
300xg for 5 minutes. Cells were resuspended in 10 ml PBS and a cell count was taken using a BiRad TC20
cell counter. Cells were aliquoted into 50 ml conical tubes containing 50 million cells, pelleted as above and
washed with 10 ml PBS before a final pelleting after which the PBS was removed and the samples were flash
frozen on dry ice and stored at -80o C until ready for further processing.
DNA extraction and size-selection
We extracted high-molecular weight (HMW) DNA using the QIAGEN Puregene kit. We followed the standard
protocol with some modifications. Briefly, we lysed the cells by adding 3 ml of Cell Lysis Solution per 10
million cells, followed by incubation at 37o C for up to 1 hour. We performed mild shaking intermediately by
hand, and avoided vortexing. Once clear, we split the lysate into 3 ml aliquots and added 1 ml of Protein
Precipitation Solution to each of the tubes. This was followed by pulse vortexing three times for five seconds
each time. We next spun this at 2000 x g for 10 minutes. We added the supernatant from each tube to
a new tube containing 3 ml of isopropanol, followed by 50x inversion. The HMW DNA precipitated and
formed a dense thread-like jelly. We used a disposable inoculation loop to extract the DNA precipitate. We
then dipped the DNA precipitate, while it was on the loop, into ice-cold 70% ethanol. After this, the DNA
precipitate was added to a new tube containing 50-250 µl 1x TE buffer. The tubes were heated at 50o C for 2
hours and then left at room temperature overnight to allow resuspension of the DNA. The DNA was then
quantified using Qubit and NanoDrop.
We used the Circulomics Short Read Eliminator (SRE) kit to deplete short-fragments from the DNA
preparation. We size-selected 10 µg of DNA using the Circulomics recommended protocol for each round of
size-selection.
Nanopore sequencing
We used the SQK-LSK109 kit and its recommended protocol for making sequencing libraries. We used 1 µg
of input DNA per library. We prepared libraries at a 3x scale since we performed a nuclease flush on every
flow cell, followed by the addition of a fresh library.
We used the standard PromethION scripts for sequencing. At around 24 hours, we performed a nuclease
flush using the ONT recommended protocol. We then re-primed the flow cell, and added a fresh library
corresponding to the same sample. After the first nuclease flush, we restarted the run setting the voltage to
-190 mV. We repeated the nuclease flush after another around 24 hours (i.e. around 48 hours into sequencing),
re-primed the flow cell, added a fresh library, and restarted the run setting the run voltage to -200 mV.
13bioRxiv preprint first posted online Jul. 26, 2019; doi: http://dx.doi.org/10.1101/715722. The copyright holder for this preprint (which
was not peer-reviewed) is the author/funder, who has granted bioRxiv a license to display the preprint in perpetuity.
It is made available under a CC-BY 4.0 International license.
A preprint - July 25, 2019
We performed basecalling using Guppy v.2.3.5 on the PromethION tower using the GPUs. We used the
MinION DNA flipflop model (dna_r9.4.1_450bps_flipflop.cfg), as recommended by ONT.
Chromatin Crosslinking and Extraction from Human Cell Lines
We thawed the frozen cell pellets and washed them twice with cold PBS before resuspension in the same
buffer. We transferred Aliquots containing five million cells by volume from these suspensions to separate
microcentrifuge tubes before chromatin crosslinking by addition of paraformaldehyde (EMS Cat. No. 15714)
to a final concentration of one percent. We briefly vortexed the samples and allowed them to incubate at
room temperature for fifteen minutes. We pelleted the crosslinked cells and washed them twice with cold
PBS before thoroughly resuspending in lysis buffer (50 mM Tris-HCl, 50 mM NaCl, 1 mM EDTA, 1% SDS)
to extract crosslinked chromatin.
The Hi-C Method
We bound the crosslinked chromatin samples to SPRI beads, washed three times with SPRI wash buffer (10
mM Tris-HCl, 50 mM NaCl, 0.05% Tween-20), and digested by DpnII (20 U, NEB Catalog No. R0543S) for 1
hour at 37o C in an agitating thermal mixer. We washed the bead-bound samples again before incorporation
of Biotin-11-dCTP (ChemCyte Catalog No. CC-6002-1) by DNA Polymerase I, Klenow Fragment (10 U,
NEB Catalog No. M0210L) for thirty minutes at 25o C with shaking. Following another wash, we carried out
blunt-end ligation by T4 DNA Ligase (4000 U, NEB Catalog No. M0202T) with shaking overnight at 16o C.
We reversed the chromatin crosslinks, digested the proteins, eluted the samples by incubation in crosslink
reversal buffer (5 mM CaCl 2 , 50 mM Tris-HCl, 8% SDS) with Proteinase K (30 µg, Qiagen Catalog No.
19133) for fifteen minutes at 55o C followed by forty-five minutes at 68o C.
Sonication and Illumina Library Generation with Biotin Enrichment
After SPRI bead purification of the crosslink-reversed samples, we transferred DNA from each to Covaris®
microTUBE AFA Fiber Snap-Cap tubes (Covaris Cat. No. 520045) and sonicated to an average length of
400 ± 85 bp using a Covaris® ME220 Focused-Ultrasonicator™. Temperature was held stably at 6o C and
treatment lasted sixty-five seconds per sample with a peak power of fifty watts, ten percent duty factor, and
two-hundred cycles per burst. The average fragment length and distribution of sheared DNA was determined
by capillary electrophoresis using an Agilent® FragmentAnalyzer 5200 and HS NGS Fragment Kit (Agilent
Cat. No. DNF-474-0500). We ran sheared DNA samples twice through the NEBNext® Ultra™ II DNA
Library Prep Kit for Illumina® (Catalog No. E7645S) End Preparation and Adaptor Ligation steps with
custom Y-adaptors to produce library preparation replicates. We purified ligation products via SPRI beads
before Biotin enrichment using Dynabeads® MyOne™ Streptavidin C1 beads (ThermoFisher Catalog No.
65002). We performed indexing PCR on streptavidin beads using KAPA HiFi HotStart ReadyMix (Catalog
No. KK2602) and PCR products were isolated by SPRI bead purification. We quantified the libraries by
Qubit™ 4 fluorometer and FragmentAnalyzer 5200 HS NGS Fragment Kit (Agilent Cat. No. DNF-474-0500)
before pooling for sequencing on an Illumina HiSeq X at Fulgent Genetics.
Analysis methods
Read alignment identities
To generate the identity violin plots (Fig. 1c/e) we aligned all the reads for each sample and flowcell to
GRCh38 using minimap2 [23] with the map-ont preset. Using a custom script get_summary_stats.py in the
repository https://github.com/rlorigro/nanopore_assembly_and_polishing_assessment, we parsed
the alignment for each read and enumerated the number of matched (N= ), mismatched (NX ), inserted
(NI ), and deleted (ND ) bases. From this, we calculated alignment identity as N= /(N= + NX + NI +
ND ). These identities were aggregated over samples and plotted using the seaborn library with the
script plot_summary_stats.py in the same repository. This method was used to generate both Figure 1c
and Figure 1e. For Figure 1e, we selected reads from HG00733 flowcell1 aligned to GRCh38 chr1. The
“Standard” identities are used from the original reads/alignments. To generate identity data for the “RLE”
portion, we extracted the reads above, run-length encoded the reads and chr1 reference, and followed
the alignment and identity calculation process described above. Sequences were run-length encoded using
a simple script github.com/rlorigro/runlength_analysis/blob/master/runlength_encode_fasta.py)
and aligned with minimap2 using the map-ont preset and –k 19.
14bioRxiv preprint first posted online Jul. 26, 2019; doi: http://dx.doi.org/10.1101/715722. The copyright holder for this preprint (which
was not peer-reviewed) is the author/funder, who has granted bioRxiv a license to display the preprint in perpetuity.
It is made available under a CC-BY 4.0 International license.
A preprint - July 25, 2019
Base-level error-rate analysis with Pomoxis
We analyzed the base-level error-rates of the assemblies using the assess_assembly tool of Pomoxis toolkit
developed by Oxford Nanopore Technology https://github.com/nanoporetech/pomoxis. The assess as-
sembly tool is tailored to compute the error rates in a given assembly compared to a truth assembly. It
reports an identity error rate, insertion error rate, deletion error rate, and an overall error rate. The identity
error rate indicates the number of erroneous substitutions, the insertion error rate is the number of incorrect
insertions, and the deletion error rate is the number of deleted bases averaged over the total aligned length of
the assembly to the truth. The overall error rate is the sum of the identity, insertion, and deletion error rates.
For the purpose of simplification, we used the indel error rate, which is the sum of insertion and deletion
error rates.
The assess_assembly script takes an input assembly and a reference assembly to compare against. The
assessment tool chunks the reference assembly to 100 Kb regions and aligns it back to the input assembly
to get a trimmed reference. Next, the input is aligned to the trimmed reference sequence with the same
alignment parameters to get an input assembly to the reference assembly alignment. The total aligned length
is the sum of the lengths of the trimmed reference segments where the input assembly has an alignment.
The total aligned length is used as the denominator while averaging each of the error categories to limit
the assessment in only correctly assembled regions. Then the tool uses stats_from_bam, which counts the
number of mismatch bases, insert bases, and delete bases at each of the aligned segments and reports the
error rate by averaging them over the total aligned length.
The Pomoxis section in Supplementary Notes describe the commands we ran to perform this assessment.
Truth assemblies for base-level error-rate analysis
We used HG002, HG00733, and CHM13 for base-level error-rate assessment of the assembler and the
polisher. These three assemblies have high-quality assemblies publicly available, which are used as the
ground truth for comparison. Two of the samples, HG002 and HG00733, are diploid samples; hence,
we picked one of the two possible haplotypes as the truth. The reported error rate of HG002 and
HG00733 include some errors arising due to the zygosity of the samples. The complete hydatidiform
mole sample CHM13 is a haploid human genome which is used to assess the applicability of the tools
on haploid samples. We have gathered and uploaded all the files we used for assessment in one place:
https://console.cloud.google.com/storage/browser/kishwar-helen/truth_assemblies/.
Table 2: The truth assembly files with download URLs.
Sample name Region File type URL
fasta HG002_GRCh38_h1.fa
HG002 Whole genome
bed HG002_GRCh38.bed
HG00733 Whole genome fasta hg00733_truth_assembly.fa
Whole genome fasta CHM13_truth_assembly.fa
CHM13
Chr-X fasta CHRX_CHM13_truth_assembly.fa
To generate the HG002 truth assembly, we gathered the publicly available Genome-in-a-bottle (GIAB)
high-confidence variant set (VCF) against GRCh38 reference sequence. Then we used bedtools to create
an assembly (FASTA) file from the GRCh38 reference and the high-confidence variant set. We got two files
using this process for each of the haplotypes, and we picked one randomly as the truth. All the diploid
HG002 assembly is compared against this one chosen assembly. GIAB also provides a bed file annotating
high-confidence regions where the called variants are highly precise and sensitive. We used this bed file with
assess_assembly to ensure that we compare the assemblies only in the high confidence regions.
The HG00733 truth is from the publicly available phased PacBio high-quality assembly of this sample [58].
We picked phase0 as the truth assembly and acquired it from NCBI under accession GCA_003634895.1. We
note that the assembly is phased but not haplotyped, such that portions of phase0 will include sequences
from both parental haplotypes and is not suitable for trio-binned analyses. Furthermore, not all regions were
15bioRxiv preprint first posted online Jul. 26, 2019; doi: http://dx.doi.org/10.1101/715722. The copyright holder for this preprint (which
was not peer-reviewed) is the author/funder, who has granted bioRxiv a license to display the preprint in perpetuity.
It is made available under a CC-BY 4.0 International license.
A preprint - July 25, 2019
fully phased; regions with variants that are represented as some combination of both haplotypes will result in
lower QV and a less accurate truth.
For CHM13, we used the v0.6 release of CHM13 assembly by the T2T consortium [31]. The reported quality
of this truth assembly in Q-value is QV 39. One of the attributes of this assembly is chromosome X. As
reported by the T2T assembly authors, chromosome X of CHM13 is the most complete (end-to-end) and
high-quality assembly of any human chromosome. We obtained the chromosome X assembly, which is the
highest-quality truth assembly (QV >= 40) we have.
QUAST / BUSCO
To quantify contiguity, we primarily depended on the tool QUAST [32]. QUAST identifies misassemblies as
major rearrangement events in the assembly relative to the reference. For our assemblies, we quantified all
contiguity stats against GRCh38, using autosomes plus chromosomes X and Y only. We report the total
misassemblies given that their relevant “size” descriptor was greater than 1 Kb, as is the default behavior
in QUAST. QUAST provides other contiguity statistics in addition to misassembly count, notably total
length and total aligned length as reported in Figure 2d. To determine total aligned length (and unaligned
length), QUAST performs collinear chaining on each assembled contig to find the best set of non-overlapping
alignments spanning the contig. This process contributes to QUAST’s misassembly determination. We
consider unaligned sequence to be the portions of the assembled contigs which are not part of this best set of
non-overlapping alignments. All statistics are recorded in Supplementary Table 4. For all QUAST analyses,
we used the flags min-identity 80 and fragmented.
QUAST also produces an NGAx plot (similar to an NGx plot) which shows the aligned segment size
distribution of the assembly after accounting for misassemblies and unalignable regions. The intermediate
segment lengths that would allow NGAx plots to be reproduced across multiple samples on the same
axis (as is shown in Figure 2b) are not stored, so we created a GitHub fork of QUAST to store this
data during execution: https://github.com/rlorigro/quast. Finally, the assemblies and the output
of QUAST were parsed to generate figures with an NGx visualization script, ngx_plot.py, found at
github.com/rlorigro/nanopore_assembly_and_polishing_assessment/.
BUSCO [45] is a tool which quantifies the number of Benchmarking Universal Single-Copy Orthologs present
in an assembly. We ran BUSCO via the option within QUAST, comparing against the eukaryota set of
orthologs from OrthoDB v9.
Misassembly assessments
To analyze the QUAST-reported misassemblies for different regions of the genome, we gathered the known
segmental duplication (SD) regions [7], centromeric regions for GRCh38, and known regions in GRCh38
with structural variation for HG002 from GIAB [33]. We used a python script quast_sv_extractor.py
that compares each reported misassembly of QUAST to the SD, SV and centromeric regions and discounts
any misassembly that overlaps with these regions. The quast_sv_extractor.py script can be found at
https://github.com/kishwarshafin/helen/blob/master/modules/python/helper/.
The segmental duplication regions of GRCh38 defined in the ucsc.collapsed.sorted.segdups file can be
downloaded from https://github.com/mvollger/segDupPlots/.
The defined centromeric regions of GRCh38 for all chromosomes are used from the available summary at
https://www.ncbi.nlm.nih.gov/grc/human.
For GIAB HG002, known SVs for GRCh38 are available in NIST_SVs_Integration_v0.6/ under
ftp://ftp-trace.ncbi.nlm.nih.gov/giab/ftp/data/AshkenazimTrio/analysis/. We used Tier1+2
bed file availabe in the GIAB ftp site.
Trio-binning
We performed trio-binning on two samples HG002 and HG00733 [36]. For HG00733, we obtained the
parental read sample accessions (HG00731, HG00732) from 1000 genome database. Then we counted k-mers
with meryl to create maternal and paternal k-mer sets. Based on manual examination of the k-mer count
histograms to determine an appropriate threshold, we excluded k-mers occurring less than 6 times for maternal
set and 5 times for paternal set. We subtracted the paternal set from the maternal set to get k-mers unique
to the maternal sample and similarly derived unique paternal k-mer set. Then for each read, we counted the
number of occurrences of unique maternal and paternal k-mers and classified the read based on the highest
16bioRxiv preprint first posted online Jul. 26, 2019; doi: http://dx.doi.org/10.1101/715722. The copyright holder for this preprint (which
was not peer-reviewed) is the author/funder, who has granted bioRxiv a license to display the preprint in perpetuity.
It is made available under a CC-BY 4.0 International license.
A preprint - July 25, 2019
occurrence count. During classification, we avoided normalization by k-mer set size. This resulted in 35.2x
maternal, 37.3x paternal, and 5.6x unclassified for HG00733. For HG002, we used the Illumina data for the
parental samples (HG003, HG004) from GIAB project [22]. We counted k-mers using meryl and derived
maternal paternal sets using the same protocol. We filtered k-mers that occur less than 25 times in both
maternal and paternal sets. The classification resulted in 24x maternal, 23x paternal, and 3.5x unknown.
The commands and data source are detailed in the Supplementary Notes.
Transcript analysis with comparative annotation toolkit
We ran the Comparative Annotation Toolkit [43] to annotate the polished assemblies in order to analyze how
well Shasta assembles transcripts and genes. Each assembly was individually aligned to the GRCh38 reference
assembly using Cactus [59] to create the input alignment to CAT. The GENCODE [60] V30 annotation was
used as the input gene set. CAT was run in the transMap mode only, without Augustus refinement, since the
goal was only to evaluate the quality of the projected transcripts. All transcripts on chromosome Y were
excluded from the analysis since some samples lacked a Y chromosome.
Run-Length Confusion Matrix
To generate run-length confusion matrices from reads and assemblies, we run-length encoded
(RLE) the assembly/read sequences and reference sequences using a purpose-built python script,
measure_runlength_distribution_from_fasta.py. The script requires a reference and sequence file,
and can be found in the GitHub repo https://github.com/rlorigro/runlength_analysis/. The RLE
nucleotides were aligned to the RLE reference nucleotides with minimap2. As RLE sequences cannot have
identical adjacent nucleotides, the number of unique k-mers is diminished with respect to standard sequences.
As minimap2 uses empirically determined sizes for seed k-mers, we used a k-mer size of 19 to approximately
match the frequency of the default size (15) used by the presets for standard sequences. For alignment of
reads and assemblies we used the map-ont and asm20 presets respectively.
By iterating through the alignments, each match position in the cigar string (mismatched nucleotides are
discarded) was used to find a pair of lengths (x, y) such that x is a predicted length and y is the true
(reference) length. For each pair, we updated a matrix which contains the frequency of every possible pairing
of prediction vs truth, from length 1bp to 50bp. Finally,Pthis matrix is normalized by dividing each element
50
by the sum of the observations for its true run length, i=1 (xi , y), and plotted as a heatmap. Each value
represents the probability of predicting a length for a given true length.
Runtime and Cost Analysis
Our runtime analysis was generated with multiple methods detailing the amount of time the processes took to
complete. These methods include the unix command time and a home-grown resource tracking script which
can be found in the https://github.com/rlorigro/TaskManager repository. We note that the assembly
and polishing methods have different resource requirements, and do not all fully utilize available CPUs, GPUs,
and memory over the program’s execution. As such, we report runtimes using wall clock time and the number
of CPUs the application was configured to use, but do not convert to CPU hours. Costs reported in the
figures are the product of the runtime and AWS instance price. Because portions of some applications do not
fully utilize CPUs, cost could potentially be reduced by running on a smaller instance which would be fully
utilized, and runtime could be reduced by running on a larger instance which can be fully utilized for some
portion of execution. We particularly note the long runtime of Medaka and found that for most of the total
runtime, only a single CPU was used. Lastly, we note that data transfer times are not reported in runtimes.
Some of the data required or generated exceeds hundreds of gigabytes, which could be potentially significant
in relation to the runtime of the process. Notably, the images generated by MarginPolish and consumed by
HELEN were often greater than 500 GB in total.
All recorded runtimes are reported in the supplement. For Shasta, times were recorded to the tenth of the
hour. All other runtimes were recorded to the minute. All runtimes reported in figures were run on the
Amazon Web Services cloud platform (AWS).
Shasta runtime reported in Fig. 2f was determined by averaging across all 12 samples. Wtdbg2 runtime was
determined by summing runtimes for wtdbg2 and wtpoa-cns and averaging across the HG00733, HG002,
and CHM13 runs. Flye runtime was determined by averaging across the HG00733, HG002, and CHM13
runs. Precise Canu runtimes are not reported, as they were run on the NIH Biowulf cluster. Each run was
restricted to nodes with 28 cores (56 hyperthreads) (2x2680v4 or 2x2695v3 Intel CPUs) and 248GB of RAM
17You can also read