Electrical antimicrobial susceptibility testing based on aptamer functionalized capacitance sensor array for clinical isolates - Nature
←
→
Page content transcription
If your browser does not render page correctly, please read the page content below
www.nature.com/scientificreports
OPEN Electrical antimicrobial
susceptibility testing based
on aptamer‑functionalized
capacitance sensor array for clinical
isolates
Kyo‑Seok Lee1,7, Sun‑Mi Lee2,7*, Jeseung Oh3, In Ho Park4,5, Jun Ho Song1, Myeonggil Han4,
Dongeun Yong6, Kook Jin Lim2,3, Jeon‑Soo Shin2,4,5* & Kyung‑Hwa Yoo1,2*
To prescribe effective antibiotics to patients with bacterial infections in a timely manner and to
avoid the misuse of antibiotics, a rapid antimicrobial susceptibility test (AST) is essential. However,
conventional AST methods require more than 16 h to provide results; thus, we developed an electrical
AST (e-AST) system, which provides results within 6 h. The proposed e-AST is based on an array of 60
aptamer-functionalized capacitance sensors that are comparable to currently available AST panels and
a pattern-matching algorithm. The performance of the e-AST was evaluated in comparison with that
of broth microdilution as the reference test for clinical strains isolated from septic patients. A total
of 4,554 tests using e-AST showed a categorical agreement of 97% with a minor error of 2.2%, major
error of 0.38%, and very major error of 0.38%. We expect that the proposed e-AST could potentially
aid antimicrobial stewardship efforts and lead to improved patient outcomes.
Bacterial infection-related complications such as sepsis are serious diseases with mortality rates ranging from
30 to 50%1–3. If appropriate treatment is delayed, survival chances decrease drastically. Thus, rapid antimicrobial
susceptibility testing (AST) is required to prescribe the patient with effective antibiotics and avoid their misuse4.
However, conventional phenotype-based AST methods, including broth dilution and disk diffusion methods,
require more than 3 d to show AST r esults5,6. Genotypic methods, such as PCR, enable the rapid identification of
strains carrying specific antibiotic resistance genes7. However, they have several disadvantages, such as reliance
on high bacterial concentrations to provide sufficient DNA and manual sample handling steps, such as lysing
bacterial cells to extract nucleic acids. Further, the extracted DNA contains DNA from both living and dead
cells, leading to a high false positive rate. Hence, phenotype methods remain the “gold standard” for clinical AST.
To reduce AST time, various phenotype AST techniques based on optical imaging8–14, microfluidic
channels15–19, and other b iosensors4,20 have been pursued. For example, several microscopy-based methods
have been developed to measure bacterial growth every 10 min as clonal aggregates multiply in Mueller–Hinton
media, to determine antibiotic-induced morphological changes in single bacterial c ells10, and to measure the
number of bacteria in a microfluidic c hannel19. In addition, rapid AST using biochemical, optical, and isothermal
measurements has been reported21,22.
Here, we report electrical AST (e-AST) chips composed of 60 aptamer-functionalized capacitance sensors
(Fig. 1). Bacteria act as dielectric particles; thus, if bacteria are bound to the sensor surface via the aptamer, the
1
Department of Physics, Yonsei University, Seoul 03722, Republic of Korea. 2Nanomedical Graduate Program,
Yonsei University, Seoul 03722, Republic of Korea. 3Proteomtech Inc., 1101 Wooree‑Venture Town, Seoul 07573,
Republic of Korea. 4Department of Microbiology, College of Medicine, Yonsei University, Seoul 03722, Republic
of Korea. 5Severance Biomedical Science Institute and Institute for Immunology and Immunological Diseases,
Yonsei University College of Medicine, Seoul 03722, Republic of Korea. 6Department of Laboratory Medicine
and Research Institute of Bacterial Resistance, Yonsei University College of Medicine, Seoul 03722, Republic
of Korea. 7These authors contributed equally: Kyo-Seok Lee and Sun-Mi Lee. *email: sunmilee@yonsei.ac.kr;
jsshin6203@yuhs.ac; khyoo@yonsei.ac.kr
Scientific Reports | (2020) 10:13709 | https://doi.org/10.1038/s41598-020-70459-3 1
Vol.:(0123456789)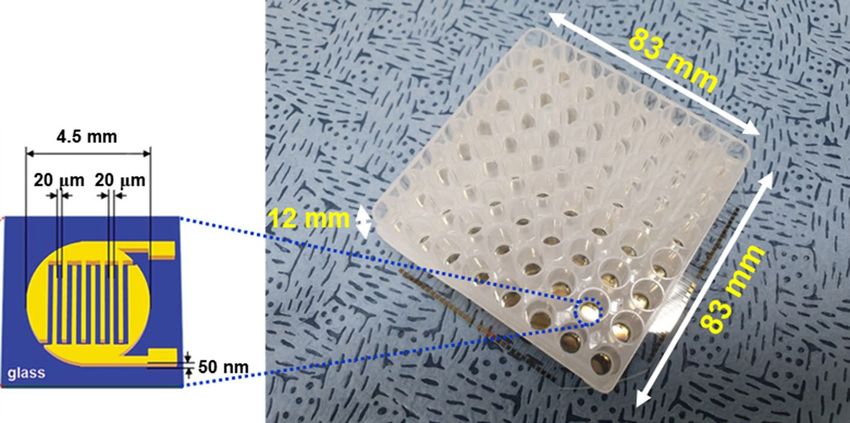
www.nature.com/scientificreports/
Figure 1. Photograph of capacitance sensor array consisting of 60 capacitance sensors. The inset shows a
schematic of capacitance sensor.
Bacteria Number of strains Clinical strains
Gram-negative
E. coli 5 U433, U556a, B12327, U5307, U
6267a
A. baumannii 5 P762, T800, R4197, R4299, R4356
P. aeruginoa 5 PAE1, PAE2, PAE3, PAE4, PAE5
K. pneumoniae 5 KP1a, KP2a, KP3, KP4a, KP5a
Gram-positive
S. aureus 5 P101, T82, C970, R4308, R4319
E. faecalis 5 R1238, U554, U5179, U4879, U5064
Table 1. Representative microorganism from sepsis in clinical strains. a Extended-spectrum β-lactamase
(ESBL) positive strains.
capacitance changes. As a result, bacterial activities, such as growth and death, can be monitored in real-time
by measuring the capacitance change, allowing more rapid A ST23,24. For AST of clinical samples, it is necessary
to simultaneously test various antimicrobial agents at different concentrations; therefore, we fabricated sensor
arrays consisting of 60 sensors. Among the 60 sensors, two and three sensors were used for negative and positive
controls, respectively, and the other 55 sensors were used to measure the antibiotic susceptibility to 11 antibiotics
at five different concentrations (see Supplementary Table S1). To evaluate the performance of the e-AST system,
30 clinical strains, most of which are frequently found in sepsis, were tested (Table 1). The categorical agreement
between the e-AST system and gold standard broth microdilution (BMD) test was estimated to be 97%, meeting
the requirements of the United States Food and Drug Administration (FDA).
Materials and methods
Fabrication of e‑AST chip. The e-AST chip, consisting of 60 sensors, was fabricated on a glass substrate
(Fig. 1). Each sensor had interdigitated Au electrodes with a width of 20 µm and spacing of 20 µm, which were
patterned by conventional photolithography and lift-off techniques. For bacterial culture, a 300 μl-acrylic well
(Nobel Biosciences Inc., Hwaseong-Si, South Korea) was attached to the array sensor using 3 M VHBTM tape.
Next, the bacteria-aptamers were immobilized on the sensor surface.
Bacterial strains and their growth condition. Thirty clinical isolates comprising four Gram-negative
strains (Escherichia coli, Acinetobacter baumannii, Klebsiella pneumoniae, and Pseudomonas aeruginosa) and
two Gram-positive strains (Staphylococcus aureus and Enterococcus faecalis) were used for the study (Table 1).
Two extended-spectrum β-lactamase (ESBL)-producing E. coli and four ESBL-producing K. pneumoniae were
included. Sepsis-causing clinical bacterial strains from various specimens (blood, pus, and urine) were collected
from the laboratories of Yonsei University Severance Hospital (Seoul, South Korea). They were subcultured on
blood agar plates (KOMED Life Science Co., Ltd., Seoul, South Korea) for 20 to 24 h before the test and their
antimicrobial resistance was performed with VITEK 2 systems (bioMerieux with three AST cards). Mueller
Hinton Broth (cation-adjusted) (BD Biosciences, San Jose, CA, USA) was used as the growth medium. This
Scientific Reports | (2020) 10:13709 | https://doi.org/10.1038/s41598-020-70459-3 2
Vol:.(1234567890)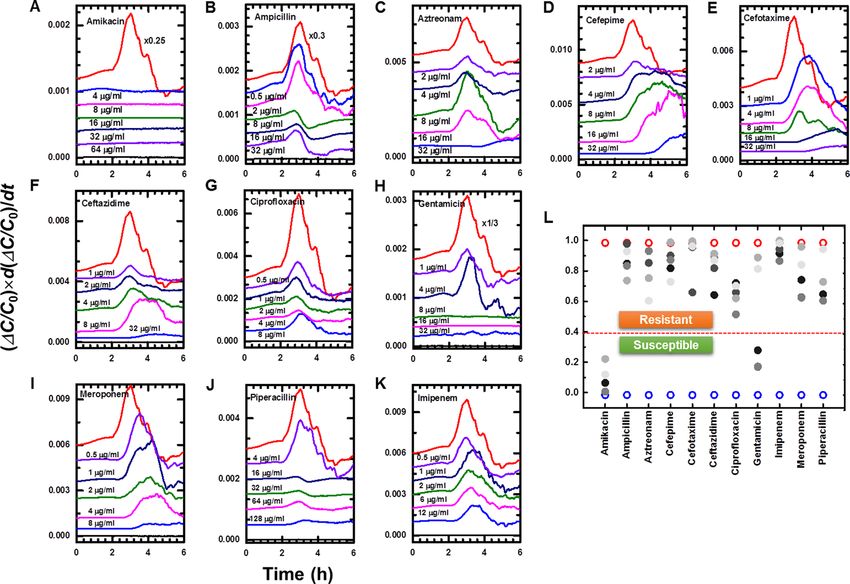
www.nature.com/scientificreports/
study was approved by the Institutional Review Board of Severance Hospital, Yonsei University Health System
(4-2017-1179).
Aptamer immobilization on the sensor surface. The sequences of the DNA aptamers, specific to each
bacterial species, were as follows: E. coli, 5′-GCA ATG GTA CGG TAC TTC CCC ATG AGT GTT GTG AAA
TGT TGG GAC ACT AGG TGG CAT AGA GCC GCA AAA GTG CAC GCT ACT TTG CTA A-3′25; A. bau-
mannii, 5′-TAC ATG GTC AAC CAA ATT CTT GCA AAT TCT GCA TTC CTA CTG T-3′26; K. pneumoniae,
5′-GCA ATG GTA CGG TAC TTC C(N45)-CAA AAG TGC ACG CTA CTT TGC TAA-3′27; P. aeruginosa,
5′-CCC CCG TTG CTT TCG CTT TTC CTT TCG CTT TTG TTC GTT TCG TCC CTG CTT CCT TTC TTG-
(CH2)3′-SH-3′28; S. aureus, 5′-GCA ATG GTA CGG TAC TTC CTC GGC ACG TTC TCA GTA GCG CTC GCT
GGT CAT CCC ACA GCT ACG TCA AAA GTG CAC GCT ACT TTG CTA A-3′29; and E. faecalis, 5′-ATC
CAG AGT GAC GCA GCA CGA CAC GTT AGG TTG GTT AGG TTG GTT AGT TTC TTG TGG ACA CGG
TGG CTT A-3′30. All aptamers were custom synthesized by Genotech Inc. (Daejeon, South Korea) and dissolved
at 10 μM in distilled water for further use.
To detect various bacteria, mixtures of various bacterial aptamers were immobilized on the sensor surface, as
previously reported23. First, the sensors were treated with O
2 plasma for 1 min to form OH groups on the glass
substrate. After the O
2 plasma treatment, the sensors were treated with 10% (3-aminopropyl) triethoxysilane
(Sigma, St. Louis, MO, USA) for 2 h at room temperature, followed by washing with 10 mM sulfuric acid for
15 min and then with distilled water. Subsequently, the sensors were treated with 10 mM 3,3′-dithiopropionic
acid for 2 h at room temperature, followed by washing with distilled water. To activate the carboxylic groups, the
sensors were treated with 12.9 mM N-3-dimethylaminopropyl (Sigma) and 8.7 mM N-hydroxysulfosuccinimide
(Sigma) for 1 h, and then washed with ethanol. Finally, the sensors were incubated in a solution of 3 μM amine-
modified aptamer for 6 h and washed thoroughly with distilled water.
Antibiotic coating on the sensor surface. For each antimicrobial agent, a stock solution of 1 mg/ml was
prepared in ultra-pure water, and diluted in the growth medium. Ten microliters of the antimicrobial solutions
were added to the wells of the Gram-negative and Gram-positive chips. They were then dried using a freeze-
dryer.
Real‑time capacitance measurements. Subcultured bacterial colonies were released to growth media
and the suspension was diluted to a concentration of 105 CFU/ml for the AST experiments. 200 μl of bacterial
solution was added to each well of the e-AST chip. Then, the e-AST chip was mounted on a capacitance imped-
ance analyzer (Proteomtech Inc., Seoul, South Korea) capable of simultaneously measuring the capacitance of 60
sensors (see Supplementary Fig. S1). It was then placed inside an incubator maintained at 37 °C. The capacitance
was measured with a peak-to-peak alternating current signal of 10 mV at a frequency of 1,000 Hz. The capaci-
tance impedance analyzer inside the incubator was linked via Bluetooth to the computer, and the data from each
sensor were collected every 16.5 min.
Broth microdilution test. For the BMD tests, antimicrobial solutions were prepared from the stock solu-
tion. Antimicrobial agents at the appropriate concentration were pipetted into the wells of BD Falcon™ 96 Micro-
Well plates (BD Biosciences, San Jose, CA, USA) at a volume of 200 μl, and the wells were then inoculated with
10 μl bacterial stock solution, each at a final concentration of 5 × 10⁵ CFU/ml31. After 16 h of incubation at 37 °C,
the MIC values of the microdilution wells were read as the concentration, at which more than 80% reduction in
growth was observed, as compared to that in the control by unaided visual inspection5,32.
Estimation of similarity measure. A similarity measure was estimated using a pattern-matching
a lgorithm33. Briefly, the complexity of the (ΔC/C0) × d(ΔC/C0)/dt curves was reduced using principal component
analysis, and the feature of each curve was extracted via linear discriminant analysis. Then, the similarity meas-
ure was determined by a/(a + b), where a and b are the Euclidean distance to the features of cell-free media curve
and the positive control curves, respectively. For cell-free media and the positive control, the similarity measure
was expected to be 0 and 1, respectively. The program was coded using MATLAB.
Statistical analysis. The 95% confidence intervals for the proportion of CA, including mE, ME, and VME
between the e-AST, VITEK 2 Systems, and gold standard BMD method, were also calculated.
Results and discussion
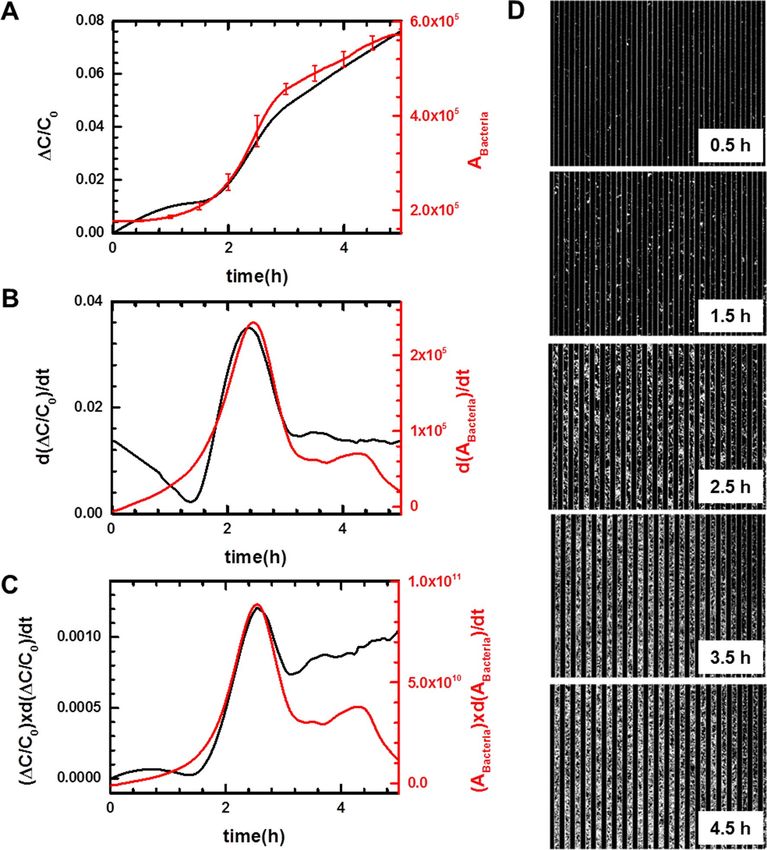
Relationship between real‑time capacitance and bacterial growth. Prior to the AST test, we meas-
ured the real-time capacitance when E. coli U433 of 105 CFU/ml was cultured in media (black curve, Fig. 2A),
where C0 is the initial capacitance value and ΔC = C − C0. The capacitance increased slowly from 0 to 2 h, and
rapidly from 2 to 2.9 h; thereafter, it increased steadily. Accordingly, the capacitance increase rate, calculated
numerically by differentiating the capacitance with respect to time, d(ΔC/C0)/dt, shows a peak at 2.4 h (black
curve, Fig. 2B). To investigate the relationship between the real-time capacitance and the number of bacteria
bound to the sensor surface via aptamers, phase contrast optical images were acquired when E. coli U433 at
105 CFU/ml was cultured in a Chamlide chamber (Live Cell Instrument, Inc., Seoul, South Korea) maintained
at 37 °C (Fig. 2D).
The area occupied by bacteria (ABacteria) was estimated using MATLAB built-in function, which is used to
detect the edge line of cells, as a function of time (red curve, Fig. 2A). As for the capacitance, ABacteria exhibited
Scientific Reports | (2020) 10:13709 | https://doi.org/10.1038/s41598-020-70459-3 3
Vol.:(0123456789)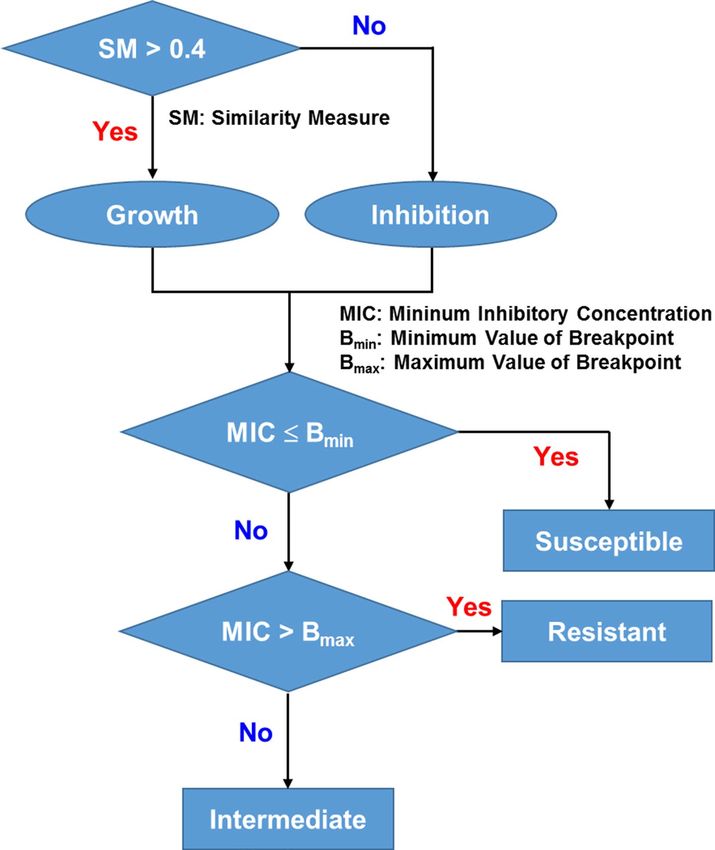
www.nature.com/scientificreports/

                                      Figure 2.  (A) Time dependence of normalized capacitance change (ΔC/C0, black curve) and the area occupied
                                      by bacteria (ABacteria, red curve) when E. coli U433 was cultured. (B) d(ΔC/C0)/dt (black curve) and d(ABacteria)/dt
                                      (red curve) numerically calculated from the data shown in (A). (C) (ΔC/C0) × d(ΔC/C0)/dt (black curve) and
                                      (ABacteria) × d(ABacteria)/dt (red curve). (D) Time-lapse phase contrast optical images acquired when E. coli U433
                                      was cultured in a Chamlide chamber.

                                      three regions depending on the increasing rate. When ABacteria was differentiated with respect to time, d(ABacteria)/dt
                                      exhibited a peak at the same time as d(ΔC/C0)/dt (Fig. 2B), indicating that bacterial growth is closely related to
                                      real-time capacitance. In particular, when d(ΔC/C0)/dt and d(ABacteria)/dt were multiplied by ΔC/C0 and ABacteria,
                                      respectively, similar behaviors were observed before 3.5 h (Fig. 2C). Therefore, the capacitance data were analyzed
                                      in terms of (ΔC/C0) × d(ΔC/C0)/dt.

                                      Determination of antimicrobial susceptibility using real‑time capacitance measurements. To
                                      investigate whether real-time capacitance measurements can be employed to perform ASTs, we measured the
                                      real-time capacitance for E. coli U433 treated with different concentrations of amikacin (Fig. 3A) and ampi-
                                      cillin (Fig. 3D), and then calculated (ΔC/C0) × d(ΔC/C0)/dt (Fig. 3B, E). For amikacin, (ΔC/C0) × d(ΔC/C0)/dt
                                      showed no peaks at all concentrations, indicating that E. coli U433 is susceptible to amikacin. In contrast,
                                      peaks were observed at all concentrations of ampicillin, indicating that U433 is resistant to ampicillin. To
                                      determine the antimicrobial susceptibility more quantitatively, we calculated the area enclosed by the curve of

          Scientific Reports |   (2020) 10:13709 |                https://doi.org/10.1038/s41598-020-70459-3                                               4

Vol:.(1234567890)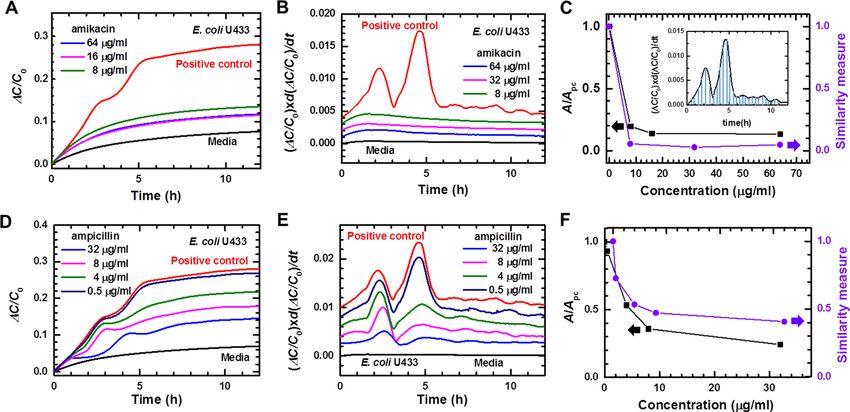
www.nature.com/scientificreports/

                            Figure 3.  Time dependence of ΔC/C0 measured for E. coli U433 treated with different concentrations of
                            (A) amikacin and (D) ampicillin. Positive control represents the data obtained from E. coli U 433 without
                            antibiotics, and media represents the data of cell-free media. (ΔC/C0) × d(ΔC/C0)/dt numerically calculated
                            for E. coli U433, which was treated with different concentrations of (B) amikacin and (E) ampicillin. The (ΔC/
                            C0) × d(ΔC/C0)/dt curves are shifted to facilitate viewing. The area enclosed by the (ΔC/C0) × d(ΔC/C0)/dt curve
                            and the X-axis, which is denoted by the shaded region in the inset of (C), normalized by the area of positive
                            control (Apc) (A/Apc, black symbols) and similarity measures (purple symbols) estimated using the pattern
                            matching algorithm for E. coli U433, which was treated with different concentrations of (C) amikacin and (F)
                            ampicillin.

                            (ΔC/C0) × d(ΔC/C0)/dt and the x-axis (inset of Fig. 3C). For all concentrations of amikacin, A/Apc was smaller
                            than 0.2, where Apc is the area estimated for the positive control (black symbols, Fig. 3C). In contrast, A/Apc was
                            higher than 0.2 for all concentrations of ampicillin (black symbols, Fig. 3F). In addition to A/Apc, we estimated
                            a similarity measure using a pattern-matching algorithm, which shows the closeness of (ΔC/C0) × d(ΔC/C0)/dt
                            curve obtained in the presence of antimicrobial agents to that of positive control (purple symbols, Fig. 3C, F).
                            The similarity measure was lower than 0.1 for amikacin and higher than 0.4 for ampicillin. The comparison with
                            the results obtained from the gold standard BMD tests and VITEK 2 systems (see Supplementary Table S2) sug-
                            gests that the cutoff values between bacterial growth and inhibition are approximately 0.2 and 0.4 for A/Apc and
                            the similarity measure, respectively. A/Apc and the similarity measure exhibited similar behaviors; however, in
                            comparison with the A/Apc, the similarity measure provides a clearer distinction between bacterial growth and
                            inhibition. Therefore, the similarity measure is adopted for the proposed e-AST chips.
                                The antimicrobial susceptibility was determined, as shown in Fig. 4. Assuming that the cutoff of similarity
                            measure between bacterial growth and inhibition is 0.4, the MIC was estimated to be less than 8 μg/ml for ami-
                            kacin. It is lower than the breakpoint of 8 – 16 μg/ml suggested by CLSI; therefore, E. coli U433 was determined
                            to be susceptible to amikacin. For ampicillin, the MIC was estimated to be greater than 32 μg/ml, higher than
                            the breakpoint of 2 – 8 μg/ml, indicating that E. coli U433 is resistant to ampicillin. The gold standard BMD
                            tests and VITEK 2 systems also showed that E. coli U433 is susceptible to amikacin and resistant to ampicillin,
                            indicating that antimicrobial susceptibility can be determined using the e-AST system.

                            Performance of e‑AST system in clinical samples. For the AST tests, Gram-negative and Gram-pos-
                            itive chips were prepared. The list of antibiotics and their concentrations is presented in Table S1, which was
                            selected from VITEK 2 kits used at Yonsei University Severance Hospital. To evaluate the performance of the
                            e-AST system, five bacterial isolates per strain were tested for four Gram-negative strains (E. coli, A. bauman-
                            nii, P. aeruginosa, and K. pneumoniae) and two Gram-positive strains (S. aureus and E. faecalis) (Table 1). Fig-
                            ure 5A – K show the typical results measured for A. baumannii R4197 using the Gram-negative e-AST chip. The
                            data were monitored for 6 h because the time dependence data (Fig. 3) revealed that antimicrobial susceptibility
                            could be determined within 6 h.
                                From the capacitance measured as a function of time, (ΔC/C0) × d(ΔC/C0)/dt was numerically calculated, and
                            the similarity measures were estimated using a pattern-matching algorithm (Fig. 5L). The antimicrobial suscep-
                            tibilities determined by the flow chart in Fig. 4 are summarized in Table 2 for various antibiotics. A. baumannii
                            R4197 was determined to be susceptible to amikacin and gentamicin, and resistant to other antibiotics. These
                            results are consistent with the BMD results, supporting the application possibility of e-AST chips to perform
                            ASTs.

Scientific Reports |   (2020) 10:13709 |               https://doi.org/10.1038/s41598-020-70459-3                                              5

                                                                                                                                        Vol.:(0123456789)
www.nature.com/scientificreports/
Figure 4. Data interpretation and susceptibility determination. SM denotes similarity measure.
To estimate the error rates of the e-AST system, a total of 4,554 tests were performed and discrepancies were
determined by comparing the results of the e-AST chips with those of the BMD test as the reference (Table 3 and
see Supplementary Table S3). According to the guidance from the FDA, the discrepancies were classified as minor
error, major error, very major error, and category agreement (CA). Minor errors (mEs) represent the strains that
were interpreted as “intermediate” using the e-AST chip but were determined to be either sensitive or resistant by
the reference test. Major errors (MEs) represent the strains that were interpreted as “resistant” using the e-AST
chip but were determined to be sensitive by the reference test. Very major errors (VMEs) represent the strains
that were interpreted as “sensitive” using the e-AST chip but were determined to be resistant by the reference
test. CA is the same category of rates (S, I, R) provided by the e-AST chip and the reference test. For all strains,
CA was higher than 95%, and mEs, MEs, and VMEs rates were lower than 5%, 1%, and 1.8%, respectively. For
P. aeruginosa, 187 tests were conducted and there were 4 mEs, 1 ME, and 1 VME. The ME and VME occurred
in ceftazidime and imipenem, respectively (see Supplementary Table S3).
In the case of S. aureus, there were 3 VMEs among 165 tests. The 3 VMEs were from S. aureus (R4319) treated
with clindamycin (see Supplementary Table S3). In the case focusing on the six β-lactam resistant strains com-
posed of ESBL, corresponding to 220 combinations of antibiotic-bacteria tests, we observed 216 (98.18%) CA,
2 (0.96%) mEs, 2 (0.96%) MEs, and 0 (0%) VME (Table 4). Overall, the total CA, mEs, MEs, and VMEs rates
were 97.03%, 2.20%, 0.38%, and 0.38%, respectively. These values satisfy the CLSI recommendations, in which
the acceptable inter-method VMEs, MEs, and mEs rates are 1.5%, 3%, and 10%, respectively34.
Conclusion
We developed e-AST systems based on an array of 60 aptamer-functionalized capacitance sensors and a pattern-
matching algorithm for rapid AST. Bacterial behaviors, such as growth and inhibition, were monitored in real-
time by measuring the capacitance change, thereby allowing the determination of antimicrobial susceptibility
Scientific Reports | (2020) 10:13709 | https://doi.org/10.1038/s41598-020-70459-3 6
Vol:.(1234567890)www.nature.com/scientificreports/
Figure 5. (A–K) Time dependence of (ΔC/C0) × d(ΔC/C0)/dt obtained using Gram-negative e-AST chip
for A. baumannii R4197. The (ΔC/C0) × d(ΔC/C0)/dt curves are shifted to facilitate viewing. Positive control
(red line) represents the data obtained from A. baumannii R4197 without antibiotics, and media (black line)
represents the data of cell-free media. (L) Similarity measures estimated using the pattern matching algorithm
for A. baumannii R4197. Higher concentration is indicated by the darker color. Blue and red circles indicate the
similarity measure of cell-free media and A. baumannii R4197 without antibiotics, respectively.
Table 2. The e-AST results for A. baumannii R4197 and the comparison with gold standard BMD. For the e-
AST and BMD test: SM (similarity measure) < 0.4, blue color; SM > 0.4, pink color; red arrow, MIC interpretive
criterion (μg/mL); S, susceptible; R, resistant.
Scientific Reports | (2020) 10:13709 | https://doi.org/10.1038/s41598-020-70459-3 7
Vol.:(0123456789)www.nature.com/scientificreports/
Discrepancy number Discrepancy rate (%)
Bacteria No. Test mEs MEs VMEs mEs MEs VMEs CA
Gram negative
E. coli 187 3 2 0 1.60 1.07 0 97.33
A. baumannii 165 4 0 0 2.42 0 0 97.58
P. aeruginoa 187 4 1 1 2.14 0.53 0.53 96.79
K. pneumoniae 176 3 1 0 1.70 0.57 0 97.73
715 14 4 1 1.96 0.56 0.14 97.34
Gram positive
S. aureus 165 0 0 3 0 0 1.82 98.18
E. faecalis 165 9 0 0 5.46 0 0 94.55
330 9 0 3 2.73 0 0.91 96.37
Total 1,045 23 4 4 2.20 0.38 0.38 97.03
Table 3. Discrepancy rate using clinical isolates. The e-AST results were compared with the BMD results
to calculate the discrepancy rates. For e-AST: mE minor error, ME major error, VME very major error, CA
categorical agreement.
Discrepancy number Discrepancy rate (%)
ESBL-bacteria No. strains No. test mEs MEs VMEs mEs MEs VMEs CA
E. coli 2 77 1 0 0 1.29 0 0 98.70
K. pneumoniae 4 143 1 2 0 2.09 0.69 0 97.20
Table 4. Discrepancy rate of two representative ESBL-positive isolates from sepsis patients. Extended-
spectrum β-lactamase (ESBL) positive strains.
within 6 h, which is shorter in comparison with that by the conventional methods (~ 16 h). To validate the clinical
usefulness of e-AST, the e-AST results were compared with the results of gold standard BMD for six clinical
strains from septic patients, including ESBL-positive E. coli and K. pneumoniae as antibiotic-resistant pathogens.
The discrepancies between e-AST and BMD tests were estimated to be 2.20% mE, 0.38% ME, and 0.38%, which
are lower than the FDA requirements (mE ≤ 10%, ME ≤ 3%, and VME ≤ 1.5%). These results demonstrate that
e-AST can be applied for rapid AST. Diagnosis of sepsis by e-AST may cost more than gold standard method;
however, it is expected that e-AST system could increase survival rate of sepsis patients.
Received: 29 April 2020; Accepted: 6 July 2020
References
1. Theisen, M. et al. The glutamate-rich protein (GLURP) of plasmodium falciparum is a target for antibody-dependent monocyte-
mediated inhibition of parasite growth in vitro. Infect. Immun. 66, 11–17 (1998).
2. Hotchkiss, R. S. et al. Sepsis and septic shock. Nat. Rev. Dis. Primers. 2, 16045 (2016).
3. Vincent, J. L. et al. Sepsis in European intensive care units: results of the SOAP study. Crit. Care Med. 34, 344–353 (2006).
4. Behera, B. et al. Emerging technologies for antibiotic susceptibility testing. Biosens. Bioelectron. 142, 111552 (2019).
5. Jorgensen, J. H., Ferraro, M. J., Reller, L. B. & Weistein, M. Antimicrobial susceptibility testing: a review of general principles and
contemporary practices. Clin. Infect. Dis. 49, 1749–1755 (2009).
6. Wiegand, I., Hilpert, K. & Hancock, R. E. Agar and broth dilution methods to determine the minimal inhibitory concentration
(MIC) of antimicrobial substance. Nat. Protoc. 3, 163–175 (2008).
7. Rolain, J. M., Mallet, M. N., Fournier, P. E. & Raoult, D. Real-time PCR for universal antibiotic susceptibility testing. J. Antimicrob.
Chemother. 54, 538–541 (2004).
8. Metzger, S., Frobel, R., Dunne, A. & Dunne, W. M. Jr. Rapid simultaneous identification and quantitation of Staphylococcus aureus
and Pseudomonas aeruginosa directly from bronchoalveolar lavage specimens using automated microscopy. Diagn. Microbiol.
Infect. Dis. 79, 160–165 (2014).
9. Choi, J. et al. Rapid antibiotic susceptibility testing by tracking single cell growth in a microfluidic agarose channel system. Lab
Chip. 13, 280–287 (2013).
10. Choi, J. et al. A rapid antimicrobial susceptibility test based on single-cell morphological analysis. Sci. Transl. Med 6, 174 (2014).
11. Choi, J. et al. Direct, rapid antimicrobial susceptibility test from positive blood cultures based on microscopic imaging analysis.
Sci. Rep. 7, 1148 (2017).
12. Fredborg, M. et al. Real-time optical antimicrobial susceptibility testing. J. Clin. Microbiol. 51, 2047–2053 (2013).
13. Fredborg, M. et al. Rapid antimicrobial susceptibility testing of clinical isolates by digital time-lapse microscopy. Eur. J. Clin.
Microbiol. Infect. Dis 34, 2385–2394 (2015).
14. Chantell, C. Multiplexed automated digital microscopy for rapid identification and antimicrobial susceptibility testing of bacteria
and yeast directly from clinical samples. Clin. Microbiol. Newsl. 37, 161–167 (2015).
Scientific Reports | (2020) 10:13709 | https://doi.org/10.1038/s41598-020-70459-3 8
Vol:.(1234567890)www.nature.com/scientificreports/
15. Kim, S. C., Cestello-Blanco, S., Inoue, K. & Zare, R. N. Miniaturized antimicrobial susceptibility test by combining concentration
gradient generation and rapid cell culturing. Antibiotics (Basel). 4, 455–466 (2015).
16. Tang, Y., Zhen, L., Liu, J. & Wu, J. Rapid antibiotic susceptibility testing in a microfluidic pH sensor. Anal. Chem. 85, 2787–2794
(2013).
17. Kim, S., Lee, S., Kim, J. K., Chung, H. J. & Jeon, J. S. Microfluidic-based observation of local bacterial density under antimicrobial
concentration gradient for rapid antibiotic susceptibility testing. Biomicrofluidics 13, 014108 (2019).
18. Lu, Y. et al. Single cell antimicrobial susceptibility testing by confined microchannels and electrokinetic loading. Anal. Chem. 85,
3971–3976 (2013).
19. Mohan, R. et al. A multiplexed microfluidic platform for rapid antibiotic susceptibility testing. Biosens. Bioelectron. 49, 118–125
(2013).
20. Syal, K. et al. Current and emerging techniques for antibiotic susceptibility test. Theranostics. 7, 1795–1805 (2017).
21. Puttaswamy, S., Gupta, S. K., Regunath, H., Smith, L. P. & Sengupta, S. A comprehensive review of the present and future antibiotic
susceptibility testing (AST) systems. Arch. Clin. Microbiol. 9, 1–9 (2018).
22. Idelevich, E. A. & Becker, K. How to accelerate antimicrobial susceptibility testing. Clin. Micorbiol. Infect. 25, 1347–1365 (2019).
23. Jo, N. et al. Aptamer-functionalized capacitance sensors for real-time monitoring of bacterial growth and antibiotic susceptibility.
Biosens. Bioelectron. 102, 164–170 (2018).
24. Song, S. H. et al. Vertical capacitance aptasensors for real-time monitoring of bacterial growth and antibiotic susceptibility in
blood. Biosens. Bioelectron. 143, 111623 (2019).
25. Kim, Y. S., Song, M. Y., Jumg, J. & Kim, B. C. Isolation and characterization of DNA aptamers against Escherichia coli using a
bacterial cell-systematic evolution of ligands by exponential enrichment approach. Anal. Biochem. 436, 22–28 (2013).
26. Rasoulinejad, S. & Gargari, S. L. M. Aptamer-nanobody based ELASA for specific detection of Acinetobacter baumannii isolates.
J. Biotechnol. 231, 46–54 (2016).
27. Kim, B. C., Kim, Y. S., Chung, J. Y., Jurng, J. S. & Song, M. Y. Single-stranded nucleic acid aptamers specifically binding to klebsiella
pneumoniae and method for detecting k. pneumonia using the same.” US Patent 9 284 550. Accessed 20 Nov 2013.
28. Yoo, S. M., Kim, D. K. & Lee, S. Y. Aptamer-functionalized localized surface plasmon resonance sensor for the multiplexed detec-
tion of different bacterial species. Talanta 132, 112–117 (2015).
29. Lian, Y., He, F., Wang, H. & Tong, F. A new aptamer/graphene interdigitated gold electrode piezoelectric sensor for rapid and
specific detection of Staphylococcus aureus. Biosens. Bioelectron. 65, 314–319 (2015).
30. Turek, D., Van, S. D., Johnson, J., Ocsoy, I. & Tan, W. Molecular recognition of live methicillin-resistant Staphylococcus aureus cells
using DNA aptamers. World J. Transl. Med. 2, 67–74 (2013).
31. Wikler, M. A. et al. Methods for Dilution Antimicrobial Susceptibility Tests for Bacteria that Grow Aerobically - Seventh Edition:
Approved Standard M7–A10 (Clinical and Laboratory Standards Institute, Wayne, PA, 2006).
32. Patel, J. B. et al. Methods for Dilution Antimicrobial Susceptibility Tests for Bacteria that Grow Aerobically – Tenth Edition: Approved
Standard M7–A10 (Clinical and Laboratory Standards Institute, Wayne, PA, 2015).
33. Murty, M. N. & Devi, V. S. Pattern Recognition: An Algorithmic Approach 1st edn. (Springer, New York, 2011).
34. Powell, M. et al. Development of In Vitro Susceptibility Testing Criteria and Quality Control Parameters: Fourth Edition: Approved
Standard M23–A4 (Clinical and Laboratory Standards Institute, Wayne, PA, 2016).
Acknowledgements
This work was supported by the Nano-Convergence Foundation (Grant No. R201801311) and Advanced Tech-
nology Center + Program (ATC+, Grant No. 20008864) funded by the Ministry of Trade, Industry and Energy
(MOTIE, KOREA) and by Basic Science Research Program through the National Research Foundation of Korea
(NRF) funded by the Ministry of Science, ICT, Future Planning and the Korean government (MEST) (Grant Nos.
2017R1D1A1B03028551, 2019R1H1A2080077, 2019R1H1A2079842, 2020R1A202011942, 2020R1A2C1006092,
and 2019R1A6A1A03032869) and Brain Korea 21 PLUS Project for Medical Science.
Author contributions
Conceived and designed the experiments: K.S.L., S.M.L., J.S.S., and K.H.Y. Performed the experiments: K.S.L.,
S.M.L., J.O., I.H.P., and M.H. Analyzed the data: K.S.L., S.M.L., D.Y., K.J.L., J.S.S., and K.H.Y. Wrote the paper:
S.M.L., J.S.S., and K.H.Y.
Competing interests
The authors declare no competing interests.
Additional information
Supplementary information is available for this paper at https://doi.org/10.1038/s41598-020-70459-3.
Correspondence and requests for materials should be addressed to S.-M.L., J.-S.S. or K.-H.Y.
Reprints and permissions information is available at www.nature.com/reprints.
Publisher’s note Springer Nature remains neutral with regard to jurisdictional claims in published maps and
institutional affiliations.
Open Access This article is licensed under a Creative Commons Attribution 4.0 International
License, which permits use, sharing, adaptation, distribution and reproduction in any medium or
format, as long as you give appropriate credit to the original author(s) and the source, provide a link to the
Creative Commons license, and indicate if changes were made. The images or other third party material in this
article are included in the article’s Creative Commons license, unless indicated otherwise in a credit line to the
material. If material is not included in the article’s Creative Commons license and your intended use is not
permitted by statutory regulation or exceeds the permitted use, you will need to obtain permission directly from
the copyright holder. To view a copy of this license, visit http://creativecommons.org/licenses/by/4.0/.
© The Author(s) 2020
Scientific Reports | (2020) 10:13709 | https://doi.org/10.1038/s41598-020-70459-3 9
Vol.:(0123456789)You can also read