Energy & Environmental Science - PAPER - RSC Publishing

 
CONTINUE READING
Energy & Environmental Science - PAPER - RSC Publishing
Energy &
                                                                                                              Environmental
                                                                                                              Science
          This article is licensed under a Creative Commons Attribution-NonCommercial 3.0 Unported Licence.

                                                                                                                                                                                                                                                     View Article Online
                                                                                                                  PAPER                                                                                                                               View Journal | View Issue

                                                                                                                                                         Integrated mechanistic engineering models and
                                                                                                                                                         macroeconomic input–output approach to model
                                                                                                              Cite this: Energy Environ. Sci.,
                                                                                                              2021, 14, 5017                             physical economy for evaluating the impact of
Open Access Article. Published on 26 July 2021. Downloaded on 1/2/2022 7:34:55 PM.

                                                                                                                                                         transition to a circular economy†
                                                                                                                                                                                                         a
                                                                                                                                                         Venkata Sai Gargeya Vunnava                         and Shweta Singh              *ab

                                                                                                                                                         Sustainable transition to low carbon and zero waste economy requires a macroscopic evaluation of
                                                                                                                                                         opportunities and impact of adopting emerging technologies in a region. However, a full assessment of
                                                                                                                                                         current physical flow and waste is a tedious task, thus leading to a lack of comprehensive assessment before
                                                                                                                                                         scale up and adoption of emerging technologies. Utilizing the mechanistic models developed for
                                                                                                                                                         engineering and biological systems with the macroeconomic framework of Input–Output models, we
                                                                                                                                                         propose a novel integrated approach to fully map the physical economy, that automates the process of
                                                                                                                                                         mapping industrial flows and wastes in a region. The approach is demonstrated by mapping the agro-based
                                                                                                                                                         physical economy of the state of Illinois, USA by using mechanistic models for 10 agro-based sectors, which
                                                                                                                                                         have a high impact on waste generation. Each model mechanistically simulates the material transformation
                                                                                                                                                         processes in the economic sector and provides the necessary material flow information for physical
                                                                                                                                                         economy mapping. The model for physical economy developed in the form of a Physical Input–Output
                                                                                                                                                         Table (PIOT) captures the interindustry physical interactions in the region and waste flows, thus providing
                                                                                                                                                         insight into the opportunities to implement circular economy strategies i.e., adoption of recycling technolo-
                                                                                                                                                         gies on a large scale. In Illinois, adoption of technologies for industrial waste-water and hog manure
                                                                                                                                                         recycling will have the highest impact by reducing 462% of hog industry waste outputs, 499% of soybean
                                                                                                                                                         hull waste, and 496% of dry corn milling (corn ethanol production) waste reduction. A small % reduction in
                                                                                                                                                         nitrogen fertilizer manufacturing waste was also observed. The physical economy model revealed that the
                                                                                                                                                         urea sector had the highest material use of 5.52  108 tons and green bean farming with the lowest material
                                                                                                                                                         use of 1.30  105 tons for the year modeled (2018). The mechanistic modeling also allowed elemental flows
                                                                                                              Received 21st February 2021,               across the physical economy to be captured, with the urea sector using 8.25  107 tons of elemental
                                                                                                              Accepted 19th July 2021                    carbon per operation-year (highest) and green bean farming using 3.90  104 tons of elemental carbon per
                                                                                                              DOI: 10.1039/d1ee00544h                    operation-year (least). The approach proposed here establishes a connection between engineering and
                                                                                                                                                         physical economy modeling community for standardizing the mapping of physical economy that can
                                                                                                              rsc.li/ees                                 provide insights for successfully transitioning to a low carbon and zero waste circular economy.

                                                                                                                  Broader context
                                                                                                                  Transitioning current economic systems towards zero waste and low carbon systems will require synergistic efforts among various industrial systems and adoption of
                                                                                                                  appropriate technologies at scale in a region for recycling or decarbonization. However, selection of sustainable technologies for this transition requires a
                                                                                                                  macroscopic view of physical flows (wastes, emissions, resources) in the economy along with evaluating the impact of adopting potential emerging technologies on
                                                                                                                  economy wide physical flows. The work here proposes an approach to create this macroscopic view of physical flows (interindustry flows, wastes, emissions) in an
                                                                                                                  economy through integration of mechanistic engineering models and macroeconomic framework of Input–Output (IO) models. Furthermore, the work demonstrates
                                                                                                                  the advantage of this approach in evaluating the opportunity for reducing waste and the impact of adopting a new technology in a region on economy wide waste/
                                                                                                                  material flows for transition towards a circular economy. In summary, this work establishes an approach that connects mechanistic engineering simulations with
                                                                                                                  macroeconomic framework for identifying potential transition opportunities and evaluating the impact of adopting any emerging technology on economy wide
                                                                                                                  material flows. This approach will facilitate micro to macro scale integration for sustainable transition to a low carbon and circular economy.

                                                                                                              a
                                                                                                               Agricultural & Biological Engineering, Purdue University, West Lafayette, IN, USA
                                                                                                              b
                                                                                                               Environmental & Ecological Engineering, Purdue University, West Lafayette, IN, USA. E-mail: singh294@purdue.edu; Tel: +01 765-496-1390
                                                                                                              † Electronic supplementary information (ESI) available. See DOI: 10.1039/d1ee00544h

                                                                                                              This journal is © The Royal Society of Chemistry 2021                                                       Energy Environ. Sci., 2021, 14, 5017–5034 | 5017
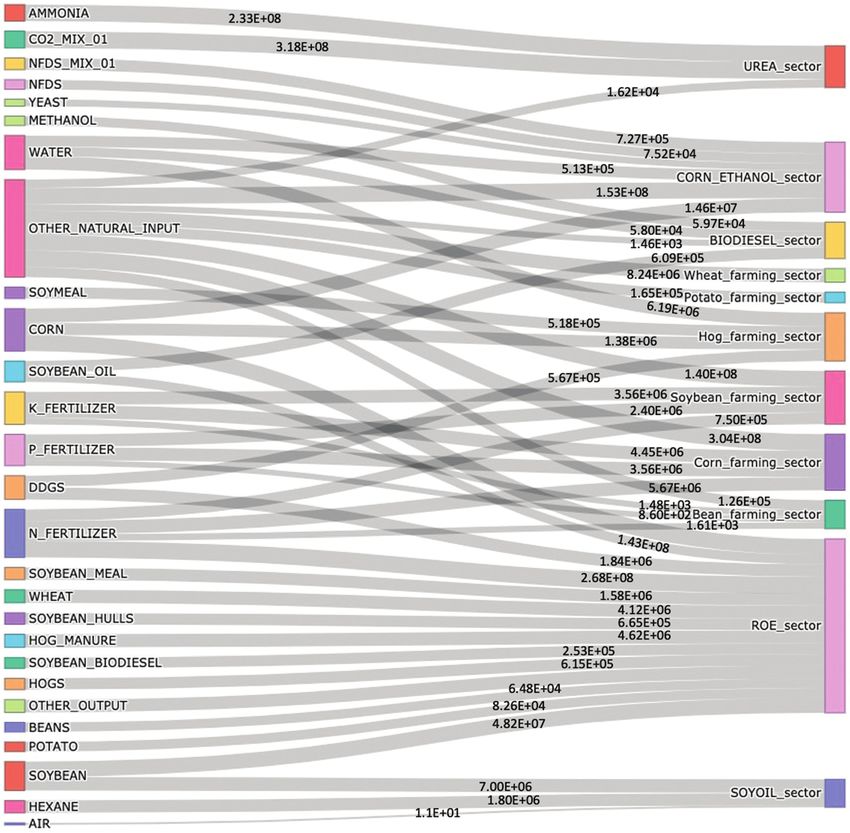
Energy & Environmental Science - PAPER - RSC Publishing
View Article Online

                                                                                                              Paper                                                                                                      Energy & Environmental Science

                                                                                                              1 Introduction                                                               in Fig. 1, on a global scale have been performed in recent years.2
                                                                                                                                                                                           Such analyses provide a clear insight into the relationship between
                                                                                                              Earth has entered a phase of Anthropocene where anthropogenic                consumption or production activities in the economy and
                                                                                                              mass is larger compared to the overall living mass.1 A large portion         associated waste or emissions. This understanding of flow mobility
          This article is licensed under a Creative Commons Attribution-NonCommercial 3.0 Unported Licence.

                                                                                                              of this anthropogenic mass is discarded as waste that affects the             enables development of sustainable resource use strategies ranging
                                                                                                              environment negatively. Waste and emissions generated by                     from identifying hot-spots for increasing production efficiencies
                                                                                                              human activities are projected to increase by 60% for solid waste            at a single process or an industry level to economy-wide circular
                                                                                                              and 52% for GHG emissions by 2050,2 from the already high                    economy implementations that will reduce impacts on the
                                                                                                              values of 49.2 Giga metric tons (GT) of waste and emissions                  environment. Furthermore, it can inform development of policies
                                                                                                              (approx. 49% of total material use in 2017). Hence, it is crucial            or technologies to reduce waste and emissions.6 While EW-MFAs
                                                                                                              to identify pathways for sustainable transition to low carbon and            have been performed at national7 and multi-national levels,2 there
Open Access Article. Published on 26 July 2021. Downloaded on 1/2/2022 7:34:55 PM.

                                                                                                              zero waste or a circular economy. While significant advancements             are very few studies that perform EW-MFA at regional levels with
                                                                                                              are being made in renewable energy and recycling technologies,               high sectoral level resolution.8 One key reason behind lack of
                                                                                                              identifying the most suitable technology based on an existing                mapping regional physical economies is unavailability of data at
                                                                                                              industrial set up of a regional economy is not obvious.                      finer spatial resolution (Fig. 1). Another reason is that the current
                                                                                                              Furthermore, evaluating the impact in terms of reducing waste                approach to create these MFAs is tedious and slow due to manual
                                                                                                              and emissions while maintaining the same level of production in              collection of data and mapping to different industrial sectors.
                                                                                                              a region is also important to inform adoption of proposed                    Furthermore, reliance on empirical data in creating these MFAs
                                                                                                              technological solutions. In order to gain insights into these open           poses additional challenges of continuity, reproducibility, validation,
                                                                                                              questions, a full-scale physical map of the whole economic region            and increased efforts for collecting data on a sub-regional scale.
                                                                                                              in terms of material flows among industries, waste generation and            As decisions are made at a local scale for implementing
                                                                                                              associated emissions is necessary. Material Flow Analysis (MFA) is           technologies for transitioning to lower waste/emissions or
                                                                                                              one such approach that enables comprehensive flow accounting,                meeting environmental regulations, lack of MFAs at a regional
                                                                                                              thus helping to better understand how materials flow from one                scale lead to sub-optimal decisions or adoption of technologies
                                                                                                              industrial/human activity to another, and eventually back into               that may have unintended long term consequences.
                                                                                                              nature as emission or waste flows.3 Apart from quantifying flows,                In this work, we address these challenges by proposing a novel
                                                                                                              MFAs need to be designed to make crucial connections between                 integrated mechanistic–macroscopic approach. The proposed
                                                                                                              economics and other engineering or social science fields.4                   approach uses computational mechanistic Engineering Models
                                                                                                              Economy Wide Material Flow Analysis (EW-MFA),5 such as shown                 (EMs) to simulate material flows at high regional and sectoral

                                                                                                              Fig. 1   Economy wide material flow analysis at different spatial resolution (Global EW-MFA numbers taken from the circularity gap report2).

                                                                                                              5018 | Energy Environ. Sci., 2021, 14, 5017–5034                                             This journal is © The Royal Society of Chemistry 2021
Energy & Environmental Science - PAPER - RSC Publishing
View Article Online

                                                                                                              Energy & Environmental Science                                                                                                       Paper

                                                                                                              level resolutions and connect these flows to the macroeconomic         simulated at an individual sector level of a given region. Next, we
                                                                                                              framework of input–output (IO) models to generate detailed             establish an approach that integrates the sectoral EMs with the
                                                                                                              material flow maps of a regional economy. Although IO models           standard IO methods to generate Physical Supply Tables (PSTs),
                                                                                                              were predominantly used by economists in the past, these are now       Physical Use Tables (PUTs) and Physical Input Output Tables
          This article is licensed under a Creative Commons Attribution-NonCommercial 3.0 Unported Licence.

                                                                                                              actively being used to quantify environmental flows and assessing      (PIOT) that captures the material flow interactions between
                                                                                                              environmental impact of economic activities both at national9 and      industries. This enables us to develop a physical economy model
                                                                                                              multi-national levels.10 This use was originally envisioned by         at regional levels that can be used to perform EW-MFAs and
                                                                                                              Wassily Leontief who won the Nobel prize for proposing the IO          evaluate the impact of implementing circular economy (CE) strate-
                                                                                                              model.11 As envisioned originally, IO models are now increasingly      gies on waste and emissions reduction in a region at a macroscopic
                                                                                                              being used for performing EW-MFAs at national levels.12 However,       scale using PIOTs. We first provide an overview of the proposed
                                                                                                              these studies were performed over large spatial scales as empirical    methodology for PIOT generation and the methodology to evaluate
Open Access Article. Published on 26 July 2021. Downloaded on 1/2/2022 7:34:55 PM.

                                                                                                              data that feed into these studies are often only available at a        the impact of CE strategies in Section 2. In Section 3, we demon-
                                                                                                              country or multi-national level.13,14 On the other hand, engineers,    strate the application of the approach to map the physical economy
                                                                                                              chemists, physicists and other physical scientists have been using     of Illinois in the year 2018 and also show the potential impact of
                                                                                                              mechanistic models for a long time to simulate the physical flows      adopting recycling technologies for CE on overall economy-wide
                                                                                                              of any system as governed by first principles. We utilize the          waste reduction. In Section 4, we discuss the strengths, limitations
                                                                                                              strength of such computational models and build scaled mecha-          and potential for wide scale adoption of the proposed approach as
                                                                                                              nistic models that mimic the material transformation processes in      a critical bridge between engineering, physical sciences and
                                                                                                              various economic sectors of a given region.15 The rationale behind     economics research communities for sustaining production while
                                                                                                              this approach is that physical economy is a manifestation of           minimizing waste and environmental impacts.
                                                                                                              production processes, consumption of goods and waste
                                                                                                              generation, with circular economy bringing these back into the
                                                                                                              production cycle. Hence, the models based on fundamental mass          2 Methodology
                                                                                                              balance and physics-based equations that mechanistically simulate
                                                                                                              production of various commodities and wastes can provide neces-        The methodology developed in this work integrates mechanistic
                                                                                                              sary physical data without only relying on empirical data related to   EMs with the Input–Output (IO) macroeconomic framework.
                                                                                                              outputs of an economic sector. This mechanistic approach greatly       The method proposed will facilitate automating and standardizing
                                                                                                              reduces allocation challenges as material flow information can be      the process of mapping physical flows among industries and waste

                                                                                                              Fig. 2   Proposed integration of mechanistic EMs with a macroeconomic Input–Output framework for modeling physical economies and EW-MFAs.

                                                                                                              This journal is © The Royal Society of Chemistry 2021                                    Energy Environ. Sci., 2021, 14, 5017–5034 | 5019
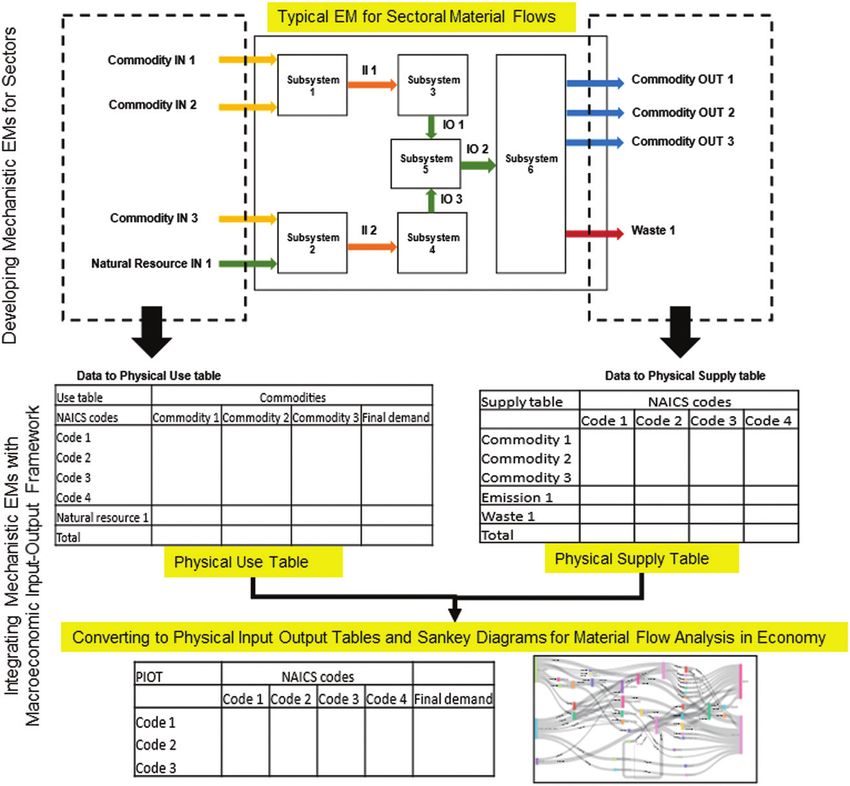
Energy & Environmental Science - PAPER - RSC Publishing
View Article Online

                                                                                                              Paper                                                                                              Energy & Environmental Science

                                                                                                              generation in a regional economy. As shown in Fig. 2, EMs form the     as materials and wastes, reliably for different sectors in any
                                                                                                              core of the methodology that can allow for automation while            region. For the US, we have developed this classification at the
                                                                                                              integrating the EMs to the macroeconomic framework of Physical         6-digit NAICS code (see SI-2, Tab NAICSClassification, ESI†).
                                                                                                              Supply Tables (PSTs), Physical Use Tables (PUTs) and Physical          This classification will be used as a guide for the selection of a
          This article is licensed under a Creative Commons Attribution-NonCommercial 3.0 Unported Licence.

                                                                                                              Input–Output Tables (PIOTs) allows for standardization.                modeling tool for developing EMs relevant to the region. All the
                                                                                                                  There are two key steps in the method: EM development for          industries that involve growing biomass (such as crops and live
                                                                                                              sectors in a region, and mapping the simulation results from           animals) were categorized as ‘‘Biomass’’ type and all the
                                                                                                              EMs to build standardized PSTs, PUTs and PIOTs. The first step         industries involving chemical transformation were categorized
                                                                                                              of the EM development process consists of three stages (Section        as ‘‘Process’’ type. Industries that do not perform any material
                                                                                                              2.1): (i) identifying the economic sectors to be modeled and           transformation but use joining/separating techniques such as
                                                                                                              mapping to economic sector codes used in a region, (ii) using          in assembly were categorized as ‘‘operations’’ type. In this
Open Access Article. Published on 26 July 2021. Downloaded on 1/2/2022 7:34:55 PM.

                                                                                                              physical, chemical or physiological based mechanistic                  paper, three categories of EMs were used based on the scope
                                                                                                              approaches to model material transformation processes in               and variations in production technologies of the economic
                                                                                                              the identified economic sector, and (iii) scaling the developed        sectors considered in the case study (see Section 3). After
                                                                                                              EM to represent material flows of the region being studied.            categorizing the sectors by EM type needed, EMs are developed
                                                                                                              Once the EMs are developed and scaled to represent various             using appropriate computational tools such as Python/Matlab
                                                                                                              industries/sectors of a region, in the second step, the material       code for biomass growth, ASPEN/ChemCad (process modeling
                                                                                                              flow information is organized to quantify the physical economy         software) models for process type and Python based model to
                                                                                                              model using PSTs, PUTs and PIOTs which provide the physical            simulate operations. These EMs capture the non-linear
                                                                                                              model of the economy (Section 2.2). This model can then be             relationship between material inputs and outputs such as
                                                                                                              used to study the impact of any technology introduction/               products/wastes/emissions for the sector, which can be scaled
                                                                                                              changes in a region or strategies for transition to a circular         to represent the actual input and output flows for a sector
                                                                                                              economy as described in Section 2.3.                                   following the non-linear relationship. Hence, this approach can
                                                                                                                                                                                     overcome a key challenge17 of true representation of ‘‘production
                                                                                                              2.1 EM development for sectors to map regional physical                technologies’’ to track material flows for a sector in any region
                                                                                                              flows                                                                  utilizing the mechanistic EM approach.
                                                                                                                  2.1.1 Identifying economic sectors to develop EMs. The                 2.1.3 Scaling and validating EMs to represent material
                                                                                                              first step in connecting EMs to the macroeconomic framework of         flows in the economy. After selecting the economic sectors to be
                                                                                                              an IO model is identification of economic sectors in the region        modeled and developing the EMs using appropriate computational
                                                                                                              for which we need to develop EMs. Standard classification              techniques, these EMs need to be scaled to accurately represent the
                                                                                                              systems such as the North American Industry Classification             material flows in the selected region and year. The EMs are scaled
                                                                                                              System (NAICS)16 of economic sector classification is used first       using either input side or output side data. Scaling for a region and
                                                                                                              to identify economic sectors. Specifically, all economic sectors       a particular year using input or output side empirical data ensures
                                                                                                              need to be tagged at the most detailed economic sector classi-         representation of actual sectoral operation, thus eliminating the
                                                                                                              fication system available. For the US, it corresponds to the 6-digit   uncertainties in flows for mapping a physical economy. A key
                                                                                                              NAICS code. The most detailed sector classification should be          advantage of using mechanism-based EMs is that it can capture
                                                                                                              selected to ensure the EMs developed accurately represent the          the nonlinear scaling for material and waste flows, i.e. material
                                                                                                              production technology of economic sectors. At higher level of          input requirements may change non-linearly based on the amount
                                                                                                              sectoral aggregation, the underlying model of production tech-         of output produced (unlike LCA or similar approaches that scale
                                                                                                              nologies get more unrealistic and only represent an averaged           models linearly18). A typical EM is shown in Fig. 3 along with
                                                                                                              material transformation process for all the sub-sectors in the         possible scaling variables shown in Table 1.
                                                                                                              aggregated sector. Hence, finer scale of sectoral representation is        In Table 1, we propose ‘‘Input side’’ or ‘‘Output side’’
                                                                                                              selected so that the EMs developed are reliable engineering            scaling. Whenever input scaling data in the form of commodity
                                                                                                              depictions for each sector to model material and waste flows.          consumption (as raw material or intermediate input) is available,
                                                                                                              If required, EMs can always be aggregated (by combining multiple       the material flow input data for all possible input commodities
                                                                                                              EMs) to higher levels of classification.                               can be used to scale EMs. Since EMs are based on underlying
                                                                                                                  2.1.2 Classification and modeling the material transformation      production or operation methodology, it will scale the rest of the
                                                                                                              processes using EMs. A single EM type cannot be used to model the      physical flows as defined by the mechanistic rules. When only
                                                                                                              flows for all industries (sectors) in the economy as the underlying    ‘‘Output side’’ information is available, scaling EMs to represent
                                                                                                              material transformation processes are different for different            the sector in an economy is not straightforward. This is because
                                                                                                              industries. For example, agricultural industries involve growth of     most mechanistic EMs are built as ‘‘input’’ driven models.
                                                                                                              various biomass such as crops and livestock, whereas chemical          In this case, we have proposed using a stochastic approach. A
                                                                                                              industries involve chemically transforming materials from one          range of input flows can be used to simulate the EMs and the
                                                                                                              form to another, while metal transforming industries involve           resulting output can be compared with available ‘‘output flow’’
                                                                                                              operations such as welding and machining. Hence, several types         data. This is an iterative approach; however, a reasonable level of
                                                                                                              or categories of EMs will be needed to capture physical flows, such    accuracy can be obtained. Automation of simulation allows for

                                                                                                              5020 | Energy Environ. Sci., 2021, 14, 5017–5034                                      This journal is © The Royal Society of Chemistry 2021
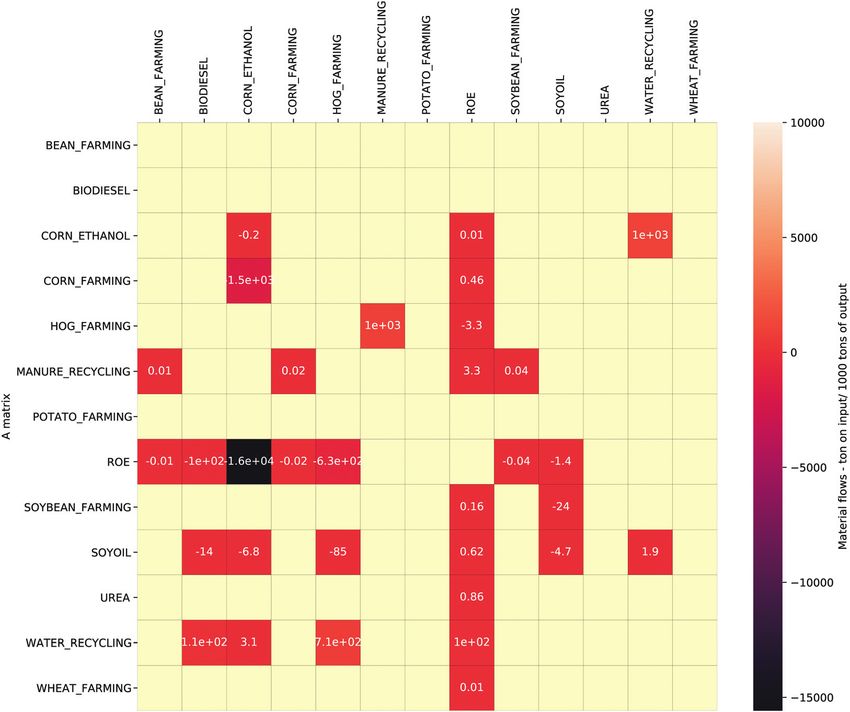
Energy & Environmental Science - PAPER - RSC Publishing
View Article Online

                                                                                                              Energy & Environmental Science                                                                                                               Paper
          This article is licensed under a Creative Commons Attribution-NonCommercial 3.0 Unported Licence.
Open Access Article. Published on 26 July 2021. Downloaded on 1/2/2022 7:34:55 PM.

                                                                                                              Fig. 3    Typical EM and various material flows associated with it.

                                                                                                              Table 1    Typical flows available as scaling variables in an EM               Once validated, the confidence of using the EMs for modeling
                                                                                                                                                                                             physical economy at scale and reusing the EMs for different
                                                                                                              Model material flow feature                                           Type
                                                                                                                                                                                             operating scales in the economy is established.
                                                                                                              Raw material                                                          Input
                                                                                                              Intermediate input                                                    Input
                                                                                                              Intermediate output                                                   Output   2.2 Transforming material flow information from EMs to
                                                                                                              Commodity production                                                  Output
                                                                                                              Waste and emissions                                                   Output   PSUTs and PIOTs
                                                                                                                                                                                             In order to standardize models for mapping physical economy
                                                                                                                                                                                             and use the model for evaluating the impact of technology
                                                                                                              testing a vast range of input flows, which is not a challenge due
                                                                                                                                                                                             interventions at an economy scale, the input and output
                                                                                                              to increasing computation power availability. An example of the
                                                                                                                                                                                             material flow information from scaled EMs are transformed
                                                                                                              output side scaling is shown in the ESI† (SI-2, Table S2).
                                                                                                                                                                                             into PSTs, PUTs and PIOTs. PIOTs allow for standardization of
                                                                                                                                                                                             depicting physical interconnections among sectors (industries)
                                                                                                                  Validation of scaled Ems. While scaling the EMs, care has to               in an economy. IO models allow for analyzing macro-scale
                                                                                                              be taken to make sure that each material flow (input or output)                economic and environmental impacts of production changes
                                                                                                              associated with an EM should be a realistic representation of                  or technology interventions.17 The data from EM provides
                                                                                                              the material flows in the region in order to model the true size               information about use and supply of different ‘‘commodities’’
                                                                                                              of the physical economy. Hence, it is recommended to cross                     along with ‘‘natural resource’’ use and ‘‘waste’’ generation in
                                                                                                              validate the flows against empirical data as per the availability.             the region for the modeled industrial sector (Fig. 3). The
                                                                                                              If input side scaling was used and there is data on one of the                 information from EMs is then organized into Physical Supply
                                                                                                              ‘‘output’’ flows, the model simulation can be cross checked to                 Table (PST) and Physical Use Table (PUT) as shown in Tables 2
                                                                                                              ensure that EMs have been developed correctly. In the case of                  and 3. The tables PST and PUT are ‘‘commodity  industry’’
                                                                                                              output side scaling, the validation is harder. If additional                   with dimensions m  n (m is no of commodities and n is no of
                                                                                                              ‘‘output’’ flows such as a co-product or emissions data is                     industries). RoE is the supply and use of commodities by
                                                                                                              reported by sectors, that can be used for validation. If both                  industries in the rest of the economy, i.e. the sectors which
                                                                                                              inputs and outputs are not available, then a decision must be                  are not being modeled or are out of scope for analysis. Since,
                                                                                                              made about how to use the only available input/output data,                    these industrial sectors are not modeled there is not a straight-
                                                                                                              however such cases are rare as all industrial sectors collect                  forward way to fill this data at this stage and it is proposed to be
                                                                                                              some information on input or output side flows. Since the EMs                  used as the balancing column in our approach.
                                                                                                              are mechanistic in nature, if they are correctly modeled and                      In Tables 2 and 3, the data in matrices EM_IN, EM_NAT_IN,
                                                                                                              scaled, their outputs should be close to the ‘‘validating’’ stream             EM_OUT, and EM_W_OUT are obtained directly from the
                                                                                                              material flow information, which is calculated as % error.                     material flow information provided by the EMs. Additional

                                                                                                              This journal is © The Royal Society of Chemistry 2021                                            Energy Environ. Sci., 2021, 14, 5017–5034 | 5021
Energy & Environmental Science - PAPER - RSC Publishing
View Article Online

                                                                                                              Paper                                                                                            Energy & Environmental Science

                                                                                                              information about exports (EX), imports (IM), and final             of commodities are not available, at this stage a simple deficit
                                                                                                              consumption (FC) of each commodity can be obtained from             balance is assumed.
                                                                                                              empirical data sources such as survey data or consumption               Converting PST and PUT to PIOT. After populating all the
                                                                                                              statistics.19 The imports and exports can also be filled in         variables in Tables 2 and 3, and followed by balancing them
          This article is licensed under a Creative Commons Attribution-NonCommercial 3.0 Unported Licence.

                                                                                                              using interregional trade models.20 Once these tables are           using the approach in Fig. 4, the PST and PUT are converted to
                                                                                                              populated using data from EM simulation and empirical data          an ‘‘Industry  Industry’’ PIOT using an adaptation of the
                                                                                                              for EX, IM and FC, the tables are checked for imbalances and        conversion model D described in the Eurostat manual.21 Model
                                                                                                              balanced to satisfy the IO framework requirement, as                D assumes a fixed product consumption structure assumption
                                                                                                              discussed below.                                                    where each product has its own consumption/sales patterns,
                                                                                                                  Balancing PSUTs. As the commodities are physical entities,      irrespective of where it is produced, which closely matches our
                                                                                                              for the whole region, a mass balance constraint of Total            economy as we trace use of commodities regardless of which
Open Access Article. Published on 26 July 2021. Downloaded on 1/2/2022 7:34:55 PM.

                                                                                                              Commodity Used (TCU) = Total Commodity Supplied (TCS)               sector it is produced.21 First a transformation matrix T (indus-
                                                                                                              for the whole region is applied first. This is based on the         try by commodity matrix) is defined (eqn (1)). T matrix can be
                                                                                                              balanced commodity flow system at basic prices from the             interpreted as the proportion contribution of each industry to
                                                                                                              supply use table manual by Eurostat.21 Additionally, assuming       the supply of each commodity. Inter-industry flows, Z, is
                                                                                                              a steady state system or no accumulation for the industries         calculated using eqn (2). The commodity level final demand
                                                                                                              modeled an industry level mass balance of Total Industry Input      (FC) is converted to industry level final demand (FD) using
                                                                                                              (TII) = Total Industry Output (TIO) is also applied. At each        eqn (3) and similarly ‘‘commodity exports’’ (EX) are converted
                                                                                                              industry level, using mechanistic EMs ensures that the total        to ‘‘industry exports’’ (EX_D) using eqn (4).
                                                                                                              mass input in an industry is equal to the mass output from the                                                 1
                                                                                                              industry, thus industry level mass balance is already ensured                                T = Vdiag(TCS)                         (1)
                                                                                                              via modeling. As the data in the PST and PUTs are in physical       where V = [EM_OUT ROE_OUT]T
                                                                                                              units, the commodity level mass balance must also hold true.
                                                                                                              Hence, we first check PSTs and PUTs for commodity level mass                                       Z = TU                           (2)
                                                                                                              balance before transforming them into a PIOT. Fig. 4 shows the
                                                                                                                                                                                  where U = [EM_IN ROE_IN]
                                                                                                              approach used to balance PSTs and PUTs.
                                                                                                                  As shown in Fig. 4, industry level mass balances are checked                                  FD = TFC                          (3)
                                                                                                              first. If imbalanced, EMs are modified to ensure that the
                                                                                                              inherent mechanistic equations used ensure mass balance. In                                      EX_D = TEX                         (4)
                                                                                                              the next stage, all available empirical data on EX, IM and FC is
                                                                                                              appended to the PST and PUT containing data from EMs. This is          Finally, the imports data available at a commodity level are
                                                                                                              then followed by a commodity level balance check for the region.    redistributed and allocated to sectors, final consumption and
                                                                                                              Since imports, exports and final demand of commodities are          exports (cross-hauling). The allocation was done by weighting a
                                                                                                              already taken care of in the empirical data addition stage, the     sector’s or final consumption or export column’s usage of
                                                                                                              remaining commodity imbalances are assigned to the RoE (Rest        commodity imported. For example, if a commodity ‘‘A’’ is used
                                                                                                              of the Economy, i.e. industries not modeled) industry that either   20% by sector 1, 50% by sector 2, 25% by final consumption
                                                                                                              supplies or uses any deficit or excess in commodities. Since the    and 5% by exports based on PUT data, then any imported
                                                                                                              ROE commodity adjustment may create an imbalance in the             commodity ‘‘A’’ was allocated 20%, 50%, 25%, and 5% to sector
                                                                                                              ROE industry level balances, a slack stock variable is used (S-IN   1, sector 2, final consumption and exports respectively. At the
                                                                                                              and S-OUT in Tables 2 and 3) to account for the imbalances in       end, these inter-industry flows, Z, and industry level FD, EX_D
                                                                                                              industries included in RoE. As detailed information about stocks    and IM_D are used to construct a PIOT as shown in Table 4.

                                                                                                              Table 2   Structure of physical use table (PUT)

                                                                                                              Commodities                     Industry 1        ‘‘’’’’’’    Industry N     ROE            Exports       FC       Total commodity used
                                                                                                              Commodity 1
                                                                                                              ‘‘                                                EM_IN                      ROE_IN         EX            FC       TCU
                                                                                                              ’’
                                                                                                              Commodity M
                                                                                                              Natural resources
                                                                                                              Natural resource 1
                                                                                                              ‘‘                                                EM_NAT_IN
                                                                                                              ’’
                                                                                                              Natural resource P
                                                                                                              Stocks (balancing slack)                                                     S_IN
                                                                                                              Total industry IN                                 TII
                                                                                                              (EM_IN: material input data from EMs, EM_NAT_IN: natural resource input data from EMs, ROE_IN: material inputs from ROE, FC: commodity
                                                                                                              final demand, EX: commodity exports, S_IN: balancing slack variable in PST, TCU: total commodity used, TII: total industry input.).

                                                                                                              5022 | Energy Environ. Sci., 2021, 14, 5017–5034                                    This journal is © The Royal Society of Chemistry 2021
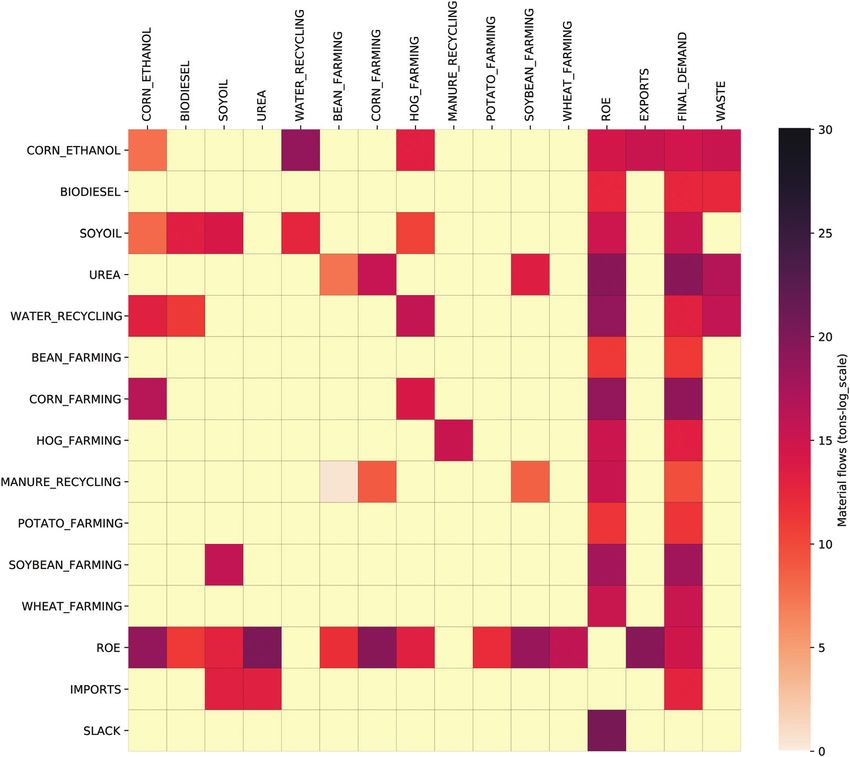
Energy & Environmental Science - PAPER - RSC Publishing
View Article Online

                                                                                                              Energy & Environmental Science                                                                                                            Paper

                                                                                                              Table 3   Structure of physical supply table (PST)

                                                                                                              Commodities                      Industry 1          ‘‘’’‘‘’’      Industry N        ROE              Imports         Total commodity supplied
                                                                                                              Commodity 1
          This article is licensed under a Creative Commons Attribution-NonCommercial 3.0 Unported Licence.

                                                                                                              ‘‘                                                   EM_OUT                          ROE_OUT          IM              TCS
                                                                                                              ’’
                                                                                                              Commodity N
                                                                                                              Waste flows
                                                                                                              Waste flow 1
                                                                                                              ‘‘                                                   EM_W_OUT
                                                                                                              ’’
                                                                                                              Waste flow P
                                                                                                              Stocks (balancing slack)                                                             S_OUT
                                                                                                              Total industry IN                                    TIO
Open Access Article. Published on 26 July 2021. Downloaded on 1/2/2022 7:34:55 PM.

                                                                                                              (EM_OUT: material output data from EMs, EM_W_OUT: waste output data from EMs, ROE_OUT: material outputs from ROE, IM: commodity
                                                                                                              imports, S_OUT: balancing slack variable in PST, TCS: total commodity supplied, TIO: total industry output.).

                                                                                                                                                                                       uncertainty can be studied as scenario analysis using variations
                                                                                                                                                                                       in EMs for same sectors. The second case of uncertainty in
                                                                                                                                                                                       scaling data will need additional empirical data for a reliable
                                                                                                                                                                                       uncertainty propagation study similar to the work described in
                                                                                                                                                                                       the literature.22,23

                                                                                                                                                                                       2.3 Simulating impact of technology adoption for a circular
                                                                                                                                                                                       economy
                                                                                                                                                                                       The symmetric PIOTs developed can be used to perform standard
                                                                                                                                                                                       Environmentally Extended Input–Output (EEIO) analysis to study
                                                                                                                                                                                       the impact of novel technology adoption or implementing new
                                                                                                                                                                                       recycling technology on the inter-industry dependence and waste/
                                                                                                                                                                                       emissions generation for the region. EEIO models provide a
                                                                                                                                                                                       systematic way to assess environmental impacts based on dollar
                                                                                                                                                                                       based (ex: impact per USD) emission factors24 and recently, in the
                                                                                                                                                                                       work by Donati et al.25 further expanded on the EEIO approach
                                                                                                                                                                                       to study global material flows. While EEIO models were
                                                                                                                                                                                       conventionally employed using monetary IO tables (MIOTs) as
                                                                                                                                                                                       their primary source to quantify inter-industry dependencies, we
                                                                                                                                                                                       use the proposed PIOTs to quantify the dependencies.8 The flows
                                                                                                                                                                                       represented by MIOTs are prone to variability in the prices
                                                                                                                                                                                       assigned to different materials26 (purchaser’s price, producer’s
                                                                                                                                                                                       price, margins, etc.) and create further uncertainty in quantifying
                                                                                                                                                                                       material flows in an economy. Hence, to overcome such
                                                                                                                                                                                       challenges, PIOTs are used to ensure the correct representation
                                                                                                                                                                                       of material flows.27 For example, all material flows that do not
                                                                                                                                                                                       have an economic value are not accounted for in MIOTs. Whereas
                                                                                                              Fig. 4 Approach to balance PSUTs for commodity and industry level mass
                                                                                                                                                                                       in PIOTs, all flows, irrespective of their economic value are
                                                                                                              balances.
                                                                                                                                                                                       included in the table and it removes the variability associated
                                                                                                                                                                                       with pricing of materials (e.g., a ton of steel is always a ton of steel
                                                                                                                                                                                       irrespective of the region/industry/sector using it). Finally, since
                                                                                                                 Uncertainty quantification of material flows in economy               the underlying mathematical framework behind IO methodology
                                                                                                              from Ems. Uncertainty in accounting for material flows in the            remains the same, we can use similar equations used in
                                                                                                              economy from EMs pertain to two sources: (1) uncertainty in a            conventional EEIO studies to simulate the impacts of final
                                                                                                              model depicting the flows of the sector and (2) uncertainty in           demand in the economy on material flows. Eqn (5) shows the
                                                                                                              the input/output data used for scaling the model to represent            change in total physical through flows for a change in Final
                                                                                                              total flows. These uncertainties can then propagate to the final         Demand (FD) of the specific industries in the economy. To
                                                                                                              PSTs/PUTs/PIOTs constructed from the simulated physical                  calculate overall impact using eqn (5), we calculate L as (I A) 1
                                                                                                              flows for sectors. In order to calculate these uncertainties,            which is called the Leontiefs inverse (L). L quantifies the changes
                                                                                                              methods such as Monte carlo etc. are used and are described              in total material throughput including direct and indirect impacts
                                                                                                              in detail in the literature.22,23 For the case of EMs, the model         for industries (sectors) in response to per unit change in final

                                                                                                              This journal is © The Royal Society of Chemistry 2021                                      Energy Environ. Sci., 2021, 14, 5017–5034 | 5023
View Article Online

                                                                                                              Paper                                                                                                  Energy & Environmental Science

                                                                                                              Table 4   Structure of physical input output table (PIOT)

                                                                                                                                             Industry 1       ‘‘’’‘‘’’    Industry N   ROE         Exports      Final demand        Waste       Total output
                                                                                                              Industry 1
          This article is licensed under a Creative Commons Attribution-NonCommercial 3.0 Unported Licence.

                                                                                                              ‘‘                                              EM_Z                     ROE_Z       EX_D         FD                  W           TIO
                                                                                                              ’’
                                                                                                              Industry N
                                                                                                              Natural resources
                                                                                                              Natural resource 1
                                                                                                              ‘‘                                              N
                                                                                                              ’’
                                                                                                              Natural resource P
                                                                                                              Stocks (balancing slack)                                                 S
                                                                                                              Imports                                         IM_D
Open Access Article. Published on 26 July 2021. Downloaded on 1/2/2022 7:34:55 PM.

                                                                                                              Total industry IN                               TII

                                                                                                              demand.17 A is called the technical coefficient matrix which is          difference in change of outputs can be calculated using eqn (8).
                                                                                                              derived using information from the Z matrix and the X column             In eqn (8), subscript DL refers to the fact that the physical changes
                                                                                                              vector (eqn (6)). X is the matrix of total useful output from each       throughout are due to the changes in direct and indirect impact
                                                                                                              sector, calculated as [TIO-W]. TIO and W are from PIOT in Table 4.       coefficients after implementing the CE strategy.
                                                                                                              In eqn (6), zi,j represents each element of the Z matrix and Xj
                                                                                                                                                                                                          DXDL = (LaDFD)      (LbDFD)                 (8)
                                                                                                              represents each element of the column sum vector of matrix X. It
                                                                                                              has to be noted that waste flows were not included in calculating           This analysis allows evaluation of the impact of adopting
                                                                                                              the A matrix since waste flows are not primary or co-products that       new recycling technology in any region by improving overall
                                                                                                              are used by other industries and not driving the production              material efficiency and reduction of waste in the economy.
                                                                                                              process as discussed in detail in the IO literature.28 Furthermore,         Apart from studying the impact of structural changes, the
                                                                                                              the coefficients A calculated here are Regional Input Coefficients       waste intensities of each sector can also be quantified. If W
                                                                                                              (RICs), which capture the industrial interaction within the region.      represents the waste flow matrix, the waste intensity w (tons of
                                                                                                              As import data were used to separate industrial uses of                  waste/ton) can be calculated by dividing each sector’s waste
                                                                                                              commodities between regional input and import use, it was                with the sector’s output. The difference in waste intensities
                                                                                                              feasible to calculate RICs.                                              before and after CE is calculated as wb wa.
                                                                                                                                            DX = LDFD                           (5)

                                                                                                                                             ai,j = zi,j/Xj                      (6)
                                                                                                                                                                                       3 Results
                                                                                                                                                                                       We present a detailed mapping of the physical economy for the
                                                                                                                 Two types of structural changes can be observed as a result           major economic sectors that constitute the agro-based economy
                                                                                                              of emerging technology adoption or implementation of CE                  in Illinois to establish the standardization process using the
                                                                                                              strategies. Since the A matrix quantifies the material requirements      proposed approach in Sections 3.1 and 3.2. Illinois was selected
                                                                                                              of an industry per unit output produced (technical coefficients),          based on prior studies8,29 where PIOTs for Illinois existed
                                                                                                              owing to the economies of scale, the A matrix may change as a            that provided a benchmark for selection of sectors to model.
                                                                                                              result of introducing structural changes in the economy due to           Furthermore, in Section 3.3, we demonstrate how the approach
                                                                                                              adoption of new technologies. If Ab and Aa represent the A               developed in this work can be used to select recycling strategies
                                                                                                              matrices before and after implementing CE, then the changes              and evaluate the impact of adoption of recycling technology on
                                                                                                              in material requirements of industries to produce unit outputs           the Illinois agro-based sectors.
                                                                                                              can be quantified by:
                                                                                                                                                                                       3.1   EMs for agro-based physical economy of Illinois
                                                                                                                                            DA = Aa      Ab                      (7)
                                                                                                                                                                                       The major agro-based sectors in Illinois, USA were first identified
                                                                                                                  Since each element in the A matrix represents the requirement        and tagged with a 6-digit NAICS code as shown in Table 5 and
                                                                                                              of inputs per unit output, the difference between the two A matrices      the EM type was given to each sector based on the type of
                                                                                                              will quantify by how much the input requirements change to               material transformation processes. The EMs developed
                                                                                                              produce the same unit output. The other type of change can be            capture all the material processing-related flows for waste and
                                                                                                              observed in the Leontief matrix. The L matrix before (Lb) and after      emissions quantification in this case study, emissions and
                                                                                                              (La) technology adoption for CE implementation can provide               upstream wastes related to energy consumption in sectors are
                                                                                                              insights into how industrial interactions change in response to          not included.
                                                                                                              new technology adoption for the same per unit changes in final              3.1.1 Modeling field crops. Field crops (EMs 1–5 in Table 5)
                                                                                                              demands of industries. If changes in industry outputs before are         were modeled using Python Crop Simulation Environment
                                                                                                              represented by DXb and after CE implementation are represented           (PCSE). PCSE is a Python package for building crop simulation
                                                                                                              by DXa and if the change in final demand is DFD then the                 models.33 PCSE provides the environment to implement crop

                                                                                                              5024 | Energy Environ. Sci., 2021, 14, 5017–5034                                        This journal is © The Royal Society of Chemistry 2021
View Article Online

                                                                                                              Energy & Environmental Science                                                                                                                     Paper

                                                                                                              Table 5   The agro-based sectors modeled in Illinois, USA

                                                                                                              EM no.                      Sector name                                       NAICS code                        EM type
                                                                                                              1                           Soybean farming                                   111110                            Plant growth model – Python
          This article is licensed under a Creative Commons Attribution-NonCommercial 3.0 Unported Licence.

                                                                                                              2                           Bean farming                                      111130                            Plant growth model – Python
                                                                                                              3                           Wheat farming                                     111140                            Plant growth model – Python
                                                                                                              4                           Corn farming                                      111150                            Plant growth model – Python
                                                                                                              5                           Potato farming                                    111211                            Plant growth model – Python
                                                                                                              6                           Hog farming                                       112210                            Animal growth model – Python
                                                                                                              7                           Urea manufacturing                                325311                            Chemical process model – Aspen         plus
                                                                                                              8                           Soybean crushing                                  311224                            Chemical process model – Aspen         plus
                                                                                                              9                           Soybean biodiesel                                 324199                            Chemical process model – Aspen         plus
                                                                                                              10                          Corn ethanol manufacturing                        325193                            Chemical process model – Aspen         plus
Open Access Article. Published on 26 July 2021. Downloaded on 1/2/2022 7:34:55 PM.

                                                                                                              simulation models which give crop yield information and much                    3.1.2 Modeling animal farming sectors. The hog farming
                                                                                                              more. Since only the crop yield data was used in this study,                 sector (NAICS 112210, EM – 6 in Table 5) was modeled using a
                                                                                                              other outputs such as plant phenology, respiration, and                      custom Python program that was built to simulate the animal
                                                                                                              evapotranspiration parameters that PCSE models produce are                   farming practices for the state of Illinois, USA. The model built
                                                                                                              not discussed. The PCSE simulation engine produces outputs                   was based on hog biomass growth rate, feed consumption, and
                                                                                                              for daily time steps and requires four primary inputs: (i)                   overall mass balance equations. The model parameters for
                                                                                                              weather data, (ii) model parameters such as crop, soil and site              capturing the mechanism of growth includes feed composition,
                                                                                                              parameters, (iii) agro-management information such as                        mass of feed intake, animal age distribution and average daily
                                                                                                              farming schedule, and (iv) custom configuration file for storing             mass gain rates for each age group. This input information was
                                                                                                              outputs. For each of the four inputs, PCSE provides a range of               obtained from USDA NASS.30 Validation of this model was done
                                                                                                              data provider options. For example, NASA power API34 was used                using the total hog mass output of the state data.30 The EM
                                                                                                              in this study as the primary weather data provider. The four                 output shows a 26% underestimation (Table 6). However, the
                                                                                                              types of input information were obtained for each of the field               EM provided enough confidence in using mechanistic models
                                                                                                              crops mapped to NAICS sectors being modeled and can be                       for the animal farming sector to independently capture inputs/
                                                                                                              found in the ESI† (SI-2). PCSE reports the crop yield in terms of            outputs of these sectors in any economic region.
                                                                                                              mass per unit area (kg per hectare). This yield data was                        3.1.3 Biomass processing and chemical manufacturing
                                                                                                              multiplied with the field crop area cultivated from USDA30 to                sectors. The sectors with conventional chemical processing
                                                                                                              get the total crop biomass output for each field crop modeled in             (EMs 7–10 in Table 5) were modeled using Aspen Plus process
                                                                                                              Illinois, USA. This provided the input and output data for ‘‘Crop            modeling software. A typical process model developed using
                                                                                                              sectors’’ at corresponding 6-digit NAICS code using a mechanistic            Aspen plus involves rigorous application of mass and thermo-
                                                                                                              model and scale of operation for the year of 2018. These models              dynamic balances that determine how different materials or
                                                                                                              were validated using the output variable data obtained indepen-              chemicals are transformed from one form to another. Once a
                                                                                                              dently from survey/census data shown in Table 6. Maximum %                   process model was developed for sectors in Aspen Plus, it was
                                                                                                              error while validation was about 18%, which establishes that the             scaled to match the material flows of the representing industry
                                                                                                              PCSE models can capture the mechanism well and represent the                 in Illinois (Table 6). Details of models for each sector are
                                                                                                              scale of input/output flows associated with this sector in the               presented in the ESI† (SI-2). Since the only available empirical
                                                                                                              region with close to 80% coverage.                                           data was used to scale the model, error % in outputs were not

                                                                                                              Table 6   Scaling and validation data used for each model along with the error of scaling!

                                                                                                              NAICS Code Sector name                        Scaling variables    Output variables     Model value Unit             Validation source          Error (%)
                                                                                                                                                                                                                   1
                                                                                                              111110        Soybean farming                 Fertilizers used     Soybean yield        5.74      10    bu per ac   30                         10
                                                                                                              111130        Bean farming                    Fertilizers used     Bean yield           1.18      108   kg          30                         5
                                                                                                              111140        Wheat farming                   Fertilizers used     Wheat yield          8.03      101   bu per ac   30                           18
                                                                                                              111150        Corn farming                    Fertilizers used     Corn yield           1.72      102   bu per ac   30                           18
                                                                                                              111211        Potato farming                  Fertilizers used     Potato yield         9.12      103   kg ha 1                                NA
                                                                                                              112210        Hog farming                     Hogs produced        Hog mass             1.23      106   ton         30                           26
                                                                                                              325311        Urea manufacturing              Ammonia used         Urea produced        5.36      108   ton         Industry is very small     NA
                                                                                                                                                                                                                                   in Illinois (only used
                                                                                                                                                                                                                                   for EM representation)
                                                                                                              311224        Soybean crushing                Soybeans crushed     Soybean oil          1.36      106   ton         31                     0.07
                                                                                                              —             —                               —                    Soybean meal         3.15      106   ton                                7
                                                                                                              324199        Soybean biodiesel               Soybean biodiesel    Soybean biodiesel    1.53      102   Mgal        32                     —
                                                                                                              325193        Corn ethanol manufacturing      Ethanol produced     Ethanol produced     1.75      103   Mgal        32                     —
                                                                                                              Soybean crushing, bio-diesel and ethyl alcohol were scaled from the output side. Since the only available output data was used for scaling, it was
                                                                                                              not used to measure the error percentages.

                                                                                                              This journal is © The Royal Society of Chemistry 2021                                              Energy Environ. Sci., 2021, 14, 5017–5034 | 5025
View Article Online

                                                                                                              Paper                                                                                                        Energy & Environmental Science

                                                                                                              reported except for the soybean crushing industry as data was                 Sankey diagrams for both the tables are shown in Fig. 5 and 6.
                                                                                                              available for it (output error % of 0.07 for soybean oil produced             The PST and PUT were converted to PIOT following the approach
                                                                                                              and 7% for soybean meal produced). The validation of the                      in Section 2.2. The PIOT captures the inter-industry dependence
                                                                                                              soybean crushing EM proved that process modeling-based EMs                    for materials in Illinois (see SI-1, Tab-PIOT, ESI†). Since the EMs
          This article is licensed under a Creative Commons Attribution-NonCommercial 3.0 Unported Licence.

                                                                                                              can represent the physical flows for industrial systems at                    developed are bottom-up and mechanistic in nature, information
                                                                                                              regional levels.                                                              such as any available elemental chemical composition of different
                                                                                                                                                                                            flows is also retained throughout the process.
                                                                                                              3.2      Physical model for the agro-based economy in Illinois                   All the tables, Sankey diagrams and heatmaps presented
                                                                                                              After validating all the EMs developed for the agro-based                     here provide a highly detailed physical map of materials flowing
                                                                                                              sectors, the material flow information was extracted from these               from one agro-based industry to another in Illinois. Such physical
                                                                                                              scaled models to construct PUT and PST using the proposed                     economy models can be critically useful to better manage regional
Open Access Article. Published on 26 July 2021. Downloaded on 1/2/2022 7:34:55 PM.

                                                                                                              approach in Section 2.2. The various material inputs and outputs              resource usage and to track elemental use efficiencies of different
                                                                                                              of each EM provided commodity data for each industry which                    industries. The two Sankey diagrams comprehensively show how
                                                                                                              were tabulated as individual columns following the structure                  different commodities are moving from one industry to another
                                                                                                              shown for PUT (Table 2) and PST (Table 3). The PST and PUT                    and all the while interacting with nature by using raw materials and
                                                                                                              constructed for the agro-based economy of Illinois are shown in               emitting waste flows. One important and easy to see observation is
                                                                                                              SI-1 (ESI†), Tabs-‘‘PST’’ and ‘‘PUT’’ which provide detailed                  that water accounts for a significant amount of the total flows, and
                                                                                                              commodity use and supply in the region. The corresponding                     the corn-ethanol and hog farming sectors had the highest amount

                                                                                                              Fig. 5    Detailed commodity use by sectors in Illinois, USA in 2018, based on the physical use table (PUT) developed (tons).

                                                                                                              5026 | Energy Environ. Sci., 2021, 14, 5017–5034                                               This journal is © The Royal Society of Chemistry 2021
View Article Online

                                                                                                              Energy & Environmental Science                                                                                                                 Paper
          This article is licensed under a Creative Commons Attribution-NonCommercial 3.0 Unported Licence.
Open Access Article. Published on 26 July 2021. Downloaded on 1/2/2022 7:34:55 PM.

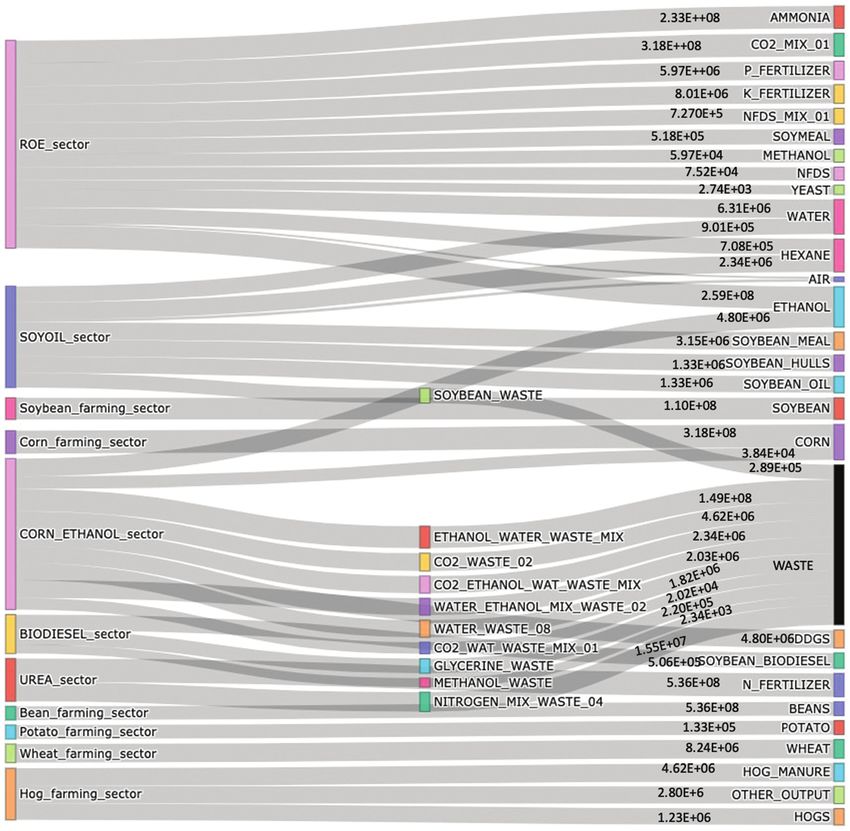
                                                                                                              Fig. 6   Detailed commodity supply by sectors in Illinois, USA in 2018, based on the physical supply table (PST) developed (tons).

                                                                                                              of waste being produced in 2018. Exact tracking of the waste flows            sector consuming high volumes of ammonia and CO2, this also
                                                                                                              through modeling at an economy scale provides an approach to                  makes urea manufacturing a key sector for carbon and nitrogen
                                                                                                              automate projection of these flows in the future as well. Another             flows and potentially a target for carbon capture technologies to
                                                                                                              important observation is that dry corn milling (or bioethanol/corn            integrate with fertilizer manufacturing. The sector with the least
                                                                                                              ethanol manufacturing) has the maximum number of input flows                  material flow intensity was the bean farming sector. This is due to
                                                                                                              and also has the highest number of output waste flows. Using these            the low nutrient input requirement (as N fixation happens), thus
                                                                                                              quantitative observations about the type and amount of waste                  beans could be a target for sustainable food production. Lastly,
                                                                                                              flows, we develop a CE strategy in next section. The detailed                 corn-ethanol manufacturing was the sector with highest number of
                                                                                                              information on commodity flows can also be utilized to perform                waste flows including water mixture with organic content (2.34 
                                                                                                              sensitivity analysis of the dry corn milling industry supply chains           106 tons) and water with CO2 and ethanol mixing (1.49  108 tons).
                                                                                                              to study how the industry behaves if one of the many input                    Given the organic content of these water mixtures, these form
                                                                                                              requirements is low in supply. The two Sankey diagrams and the                targets for further treatment and recycling of both water and any
                                                                                                              PST/PUT provides highly disaggregate material flow information at             organic waste content.
                                                                                                              detailed economic sector and commodity levels with exact                         Uncertainty in material flows from EMs. Among the two
                                                                                                              composition of material flows as well. Furthermore, using the                 sources of uncertainty, we have eliminated the study of
                                                                                                              aggregate information from the PST, PUT, PIOT and Sankey                      uncertainty due to EM by selecting the most representative
                                                                                                              diagrams developed, key material flow characteristics of the                  process for the sectors in the state of Illinois (see SI-2, ESI†).
                                                                                                              physical economy of Illinois has been identified as shown in                  This information was based on underlying mechanisms of
                                                                                                              Table 7. The highest material inputs are for the urea manufacturing           material transformation in the region. For example, the process

                                                                                                              This journal is © The Royal Society of Chemistry 2021                                            Energy Environ. Sci., 2021, 14, 5017–5034 | 5027
View Article Online

                                                                                                              Paper                                                                                                   Energy & Environmental Science

                                                                                                              Table 7   Physical economy characteristics for Illinois from PST, PUT and PIOT

                                                                                                              Physical characteristics                              Industry name                                 Value                        Units
                                                                                                                                                                                                                               8
                                                                                                              Highest mass output                                   Urea sector                                   5.52      10                tons   per   oper-yr
                                                                                                                                                                                                                            105
          This article is licensed under a Creative Commons Attribution-NonCommercial 3.0 Unported Licence.

                                                                                                              Least mass output                                     Bean farming                                  1.30                         tons   per   oper-yr
                                                                                                              Highest known elemental C output                      Urea sector                                   1.07      108               tons   per   oper-yr
                                                                                                              Least known elemental C output                        Bean farming                                  3.90      104               tons   per   oper-yr
                                                                                                              Highest known elemental C input                       Urea sector                                   8.25      107               tons   per   oper-yr
                                                                                                              Least commodity use intensity                         Bean farming                                  3.00      10 2              tons   per   ton
                                                                                                              Highest waste flows                                   Corn ethanol manufacturing                    1.60      108               tons   per   oper-yr

                                                                                                              of dry corn milling is fairly homogenized in terms of technology            as an input to the recycling industry where it transforms them into
Open Access Article. Published on 26 July 2021. Downloaded on 1/2/2022 7:34:55 PM.

                                                                                                              in the US mid-west. Hence, for the selected year, the developed             valuable commodities. To study the impact of this strategy, new
                                                                                                              EM was considered a close representation of processing in the               EMs can be developed for the new recycling technology and
                                                                                                              state and other technology scenarios were not modeled. Within               included in the PST, PUT and PIOT construction to reflect the
                                                                                                              the scope of assumed technology/production methods,                         recycling of materials in a physical model of the economy. We
                                                                                                              computational models such as the EMs described in this work                 utilize this approach for transitioning the Illinois economy towards
                                                                                                              are proven to simulate material flows close to experimental                 a CE by adopting technologies for recycling industrial waste water
                                                                                                              data.35 Since experimental validation of each of the EM                     and hog manure, and evaluating their impact on physical material
                                                                                                              developed can be potentially an independent study by themselves,            flows in the economy along with inter-industry dependence
                                                                                                              it was not considered in the scope of this study. However, the              changes. However, we acknowledge the lack of uncertainty
                                                                                                              outputs of EMs were compared with existing empirical data such              quantification on material flows and waste flows that can affect
                                                                                                              as government agricultural records30 wherever available and                 the actual impact of implementation of the CE strategies described
                                                                                                              percentage differences are reported in Table 6, providing confidence         in this work. Therefore, the results presented only pertain to the
                                                                                                              in the estimation of material flows using these EMs.                        waste quantities (see SI-1, ESI†) modeled with particular EM
                                                                                                                  The second source of uncertainty can arise from the input/              models (see SI-2, ESI†) and scaling values used.
                                                                                                              output scaling data provided to all the developed EMs. While                    Based on the waste data obtained from the PST (see SI-1,
                                                                                                              information such as coefficient of variation (CV) was provided                ESI†), the manure flow from hog farming and industrial waste
                                                                                                              in some model output sources in USDA census data,30 the                     from corn-ethanol manufacturing and soybean crushing were
                                                                                                              required uncertainty parameters for all the input data was                  identified as flows which can be potentially recyclable.
                                                                                                              unavailable to fit a probability distribution and perform                   A manure recycling industry and water recycling industry was
                                                                                                              detailed uncertainty analysis such as Monte Carlo.22 Hence,                 introduced in the economy to process these streams and the
                                                                                                              we did not quantify uncertainty propagation due to uncertainty in           entire process of constructing PST, PUT and PIOT was repeated
                                                                                                              scaling data. However, if such detailed uncertainty information is          as in the previous section. Each recycling sector was represented
                                                                                                              available for all scaling variables, it then becomes possible to            as an EM. One EM was developed using Aspen Plus to recycle
                                                                                                              quantify how uncertainty can propagate throughout the material              waste-water flows coming from different sectors. The EM was
                                                                                                              flow modeling framework to the estimation in PSTs/PUTs/PIOTs.               based on the work by Rajendran et al.36 where a modified
                                                                                                                                                                                          Anaerobic Digestion Model 1 (ADM 1) was used to simulate the
                                                                                                              3.3 Identifying and quantifying the impact of circular                      biochemical reactions of treating wastewater under anaerobic
                                                                                                              economy strategies                                                          conditions. The wastewater recycling EM divides the digestion
                                                                                                              Since it was possible to capture highly detailed chemical                   or fermentation reactions into two groups of reaction-sets: (a) the
                                                                                                              characteristic information of individual material flows across              reactions of hydrolysis operating based on the extent of
                                                                                                              the physical economy model, we used the compositions and                    the reaction, and (b) reactions of other phases (acidogenic,
                                                                                                              stream flow information to determine the recycling potential                acetogenic, and methanogenic reactions) in AD functioning on
                                                                                                              and appropriate technologies for various waste flows. The                   a kinetic basis. Hydrolysis is one of the rate-limiting steps in AD,
                                                                                                              identified waste flows can then be recycled to implement a                  and henceforth a separate reaction-set was added. The second EM
                                                                                                              circular economy strategy by selecting appropriate recycling                was an operations model that empirically converted hog manure
                                                                                                              technology. It has to be noted that some waste flows may have               into fertilizer, developed using a manure composting technology
                                                                                                              very high concentrations of a valuable chemical, but the                    assumption. Details on both the recycling EMs are provided in the
                                                                                                              required recycling/extraction technology may not be available.              ESI† (SI-2, Tabs-‘‘Water Recycling’’, ‘‘Manure Recycling’’). Both the
                                                                                                              Hence, the available recycling technologies could constrain the real        EMs were scaled from the input side with each EM taking in the
                                                                                                              potential of recycling and proper techno-economic assessment                waste flows it can process, data for which was available from PST
                                                                                                              (TEA) of the recycling technologies must be done for selection of           developed for mapping the waste in the Illinois economy.
                                                                                                              appropriate technology to be adopted at scale. However, TEA is not          This scaling was chosen as no empirical data was available to
                                                                                                              the focus of our work and we assume that the technology selected is         scale the introduced recycling EMs with CE implementation
                                                                                                              economically viable for adoption at the required scale. If the              scenario. Since water is a natural resource, no industry had to
                                                                                                              technology is available and viable, the waste flows can be supplied         be scaled down to ensure water final demand. The major changes

                                                                                                              5028 | Energy Environ. Sci., 2021, 14, 5017–5034                                           This journal is © The Royal Society of Chemistry 2021
View Article Online

                                                                                                              Energy & Environmental Science                                                                                                         Paper

                                                                                                              observed were the reduced dependence on water as a natural                The heatmap also shows how the sectors are interacting with
                                                                                                              resource by industries and the availability of recycled fertilizer        each other and the newly introduced recycling sector.
                                                                                                              commodity that can be used by farming sectors.                               It can be observed from the heatmap (Fig. 7) that the
                                                                                                                 During CE implementation, it was assumed that the final                recycling sectors, water recycling and manure recycling, is
          This article is licensed under a Creative Commons Attribution-NonCommercial 3.0 Unported Licence.

                                                                                                              demand of commodities will remain the same. This was done to              taking inputs from corn-ethanol manufacturing, soybean oil
                                                                                                              specifically understand the role of the recycling sector in               manufacturing and hog farming sectors. The recycling sector is
                                                                                                              changing the material exchanges between industries in the                 also supplying recycled materials such as water and fertilizer to
                                                                                                              simulated CE physical model while meeting the same level of               other sectors such as corn-ethanol manufacturing, soybean
                                                                                                              production demand from the economy. Since the recycling                   biodiesel, bean farming, corn farming, pea farming, soybean
                                                                                                              industry is now supplying water and fertilizer to the economy,            farming, and hog farming. Additionally, the recycling sector
                                                                                                              interaction with other industries that provide water and fertilizer       provides biogas as a new commodity to the economy. Fig. 8
Open Access Article. Published on 26 July 2021. Downloaded on 1/2/2022 7:34:55 PM.

                                                                                                              changes in the economy while ensuring that the economy meets              shows how the material requirements of industries to produce
                                                                                                              the same final demand even after implementing a CE. Since water           a unit output changed as a result of introducing the recycling
                                                                                                              is a natural resource, using recycled water implies lower water           sector. It can be observed that the farming industries (bean,
                                                                                                              withdrawal from nature to meet the demand of water require-               corn, peas, soybean, and hog) are now requiring fewer materials
                                                                                                              ments to the same production level in all sectors in the economy.         from the remaining agro-based industries in the region and the
                                                                                                              As seen in Fig. 8, the input requirements of all the sectors change       rest of the economy. This deficit is now being contributed by the
                                                                                                              as a result of introducing new technologies in the economy. This          recycling industry. The recycling industry is also supplying
                                                                                                              increase or decrease in input requirements can depend on the              recycled water to sectors such as corn-ethanol, soybean processing
                                                                                                              inherent mechanistic methods used to model and also the                   and hog farming, which reduces water withdrawal from natural
                                                                                                              economies of scale. The PIOT heatmap for the newly created                systems.
                                                                                                              recycling economy is shown in Fig. 7 and captures these nonlinear            Furthermore, to study the impact of restructuring the
                                                                                                              changes in industrial exchanges under CE implementation.                  economy on total material requirements for meeting the final

                                                                                                              Fig. 7 The heatmap of PIOT after implementing CE (numerical table in SI-2, ESI†).

                                                                                                              This journal is © The Royal Society of Chemistry 2021                                      Energy Environ. Sci., 2021, 14, 5017–5034 | 5029
You can also read