Engaging the Business and Tourism Industry in Visualizing Sea Level Rise Impacts to Transportation Infrastructure in Waikiki, Hawaii - Charles E ...
←
→
Page content transcription
If your browser does not render page correctly, please read the page content below

MARITIME TRANSPORTATION RESEARCH AND EDUCATION CENTER
         TIER 1 UNIVERSITY TRANSPORTATION CENTER
            U.S. DEPARTMENT OF TRANSPORTATION

         Engaging the Business and Tourism Industry
   in Visualizing Sea Level Rise Impacts to Transportation
                Infrastructure in Waikiki, Hawaii

                              Research Dates
                    September 1, 2019 – December 3, 2020

                             Principal Investigators:
            John L. Renne, Ph.D., AICP, Florida Atlantic University and
           Brian Wolshon, Ph.D. P.E., PTOE, Louisiana State University

                              Additional Authors:
                         Serena Hoermann, Paula Lopez

                                December 2020

                              Final Research report
      Prepared for: Maritime Transportation Research and Education Center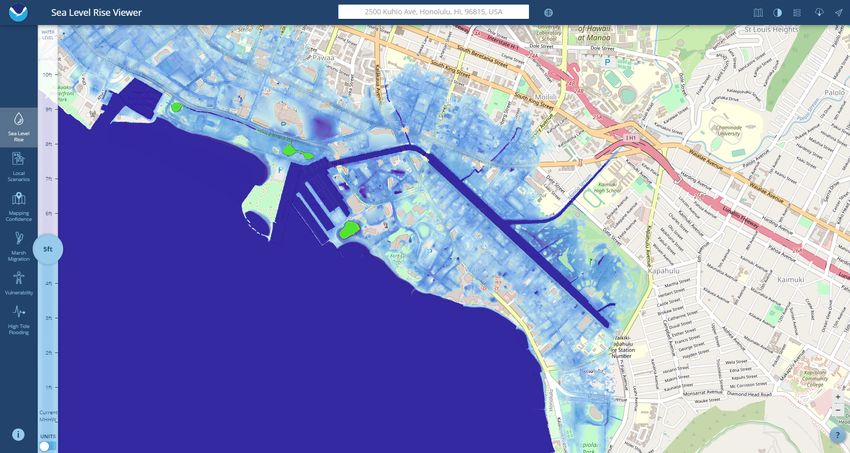
ACKNOWLEDGMENTS
       The authors would like to acknowledge the support of Louisiana State University and the
Maritime Transportation Research and Education Center (MarTREC) at the University of
Arkansas. For their assistance in site selection, protocol development and survey distribution, we
acknowledge the thoughtful support of Karl Kim, Ph.D., Eric Yamashita, Roberto Porro, and
Jiwnath Ghimire, Ph.D. at the University of Hawaii. We are also appreciative of technical and
research support from Colin Polsky, Ph.D. of the Florida Center for Environmental Studies at FAU
and Hank Savitch, Ph.D. of FAU. We thankfully acknowledge Jeremy Hajek, Industry Associate
Professor of Information Technology and Management, Smart Tech and Embedded Systems Lab
Director at the Illinois Institute of Technology (IIT) and Arjun Chakravarti, Ph.D., former Assistant
Professor of Management and Marketing at IIT.
       This material is based upon work supported by the U.S. Department of Transportation
under Grant Award Number 69A3551747130. The work was conducted through the support of
the Maritime Transportation Research and Education Center at the University of Arkansas but
any errors or omissions in this report are the responsibility of the authors.

DISCLAIMER
       The contents of this report reflect the views of the authors, who are responsible for the
facts and the accuracy of the information presented herein. This document is disseminated in the
interest of information exchange. The report is funded, partially or entirely, by a grant from the
U.S. Department of Transportation’s University Transportation Centers Program. However, the
U.S. Government assumes no liability for the contents or use thereof.

                                                                                                    i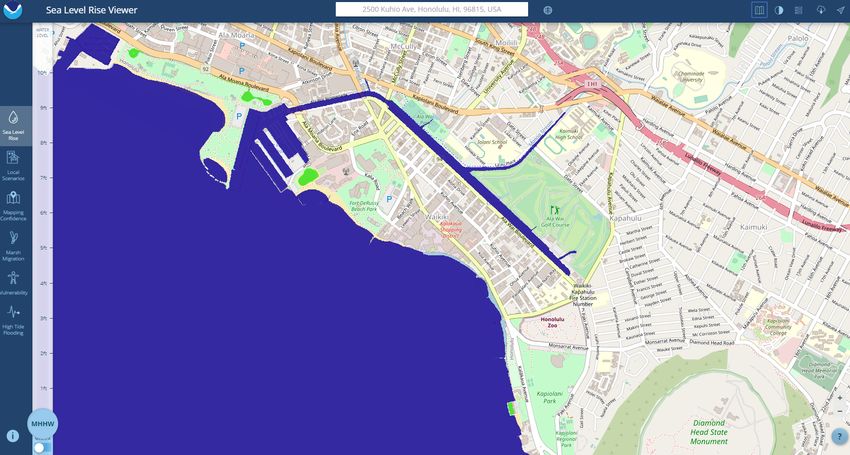
CONTENTS

ACKNOWLEDGMENTS ................................................................................................... I
DISCLAIMER ..................................................................................................................... I
CONTENTS ..................................................................................................................... II
PROJECT DESCRIPTION ................................................................................................ 3
   RESEARCH OBJECTIVES ................................................................................................................................................... 3
   LITERATURE REVIEW ...................................................................................................................................................... 3

METHODOLOGICAL APPROACH .................................................................................. 7
   SELECTION OF STUDY AREA ............................................................................................................................................. 7
   VISUALIZATION AND SURVEY DISTRIBUTION ....................................................................................................................... 9

RESULTS ........................................................................................................................ 10
   OVERVIEW OF STUDY PARTICIPANTS................................................................................................................................ 10
   OPINIONS ON EFFECTIVENESS OF IMMERSIVE VISUALIZATION ................................................................................................ 12
   OPINIONS BASED ON POLITICAL VIEWS ............................................................................................................................. 19

CONCLUSIONS ............................................................................................................. 20
REFERENCES ................................................................................................................ 21

                                                                                                                                                                          ii
PROJECT DESCRIPTION
       Transportation planners in coastal communities plan for future hazards and risks of sea-
level rise (SLR), and often, they communicate risk in public meetings via PowerPoint
presentations with charts as well as two-dimensional (2D) maps that visualize information using
Geographic Information Systems (GIS) technologies. The planned outcomes of this project
include the development of an immersive three-dimensional (3D) model (which was displayed in
2D video format) for community engagement in the Waikiki neighborhood of Honolulu, Hawaii.
       Due to the COVID-19 pandemic, the team pivoted to creating and implementing an
internet-based survey instrument with embedded 2D charts and 3D video. The flooding
projections were derived from National Oceanic and Atmospheric Administration (NOAA) data.
NOAA supplies the SLR Viewer, a screening-level tool that uses the best-available national
projections to map areas vulnerable to current and future flood risks.

RESEARCH OBJECTIVES

   A. To test if immersive visualizations of sea-level rise (SLR) results in a deeper
       understanding of impacts to streets in the Waikiki section of Honolulu, Hawaii
   B. To test if immersive visualizations can be conducted and effective using a video-
       embedded survey, as a result of the COVID-19 pandemic, that prevented in-person
       meetings and workshops that would have utilized a virtual reality (VR) model

LITERATURE REVIEW

       A critical part of modern urban planning and its development projects is active community
outreach and engagement. Planners have the responsibility, not only to listen, but to take into
consideration what the community wants or needs and whether the new design proposal is
compatible with current surrounding establishments. However, as Ford (2020) stated in her article
Innovating Community Involvement in Urban Design, “Traditional forms of outreach (i.e., the
public meeting) often fall short of reaching the increasingly diverse and information-saturated
citizens of today's American cities.”
       Fortunately, with advances in virtual reality (VR) and augmented reality (AR) technology,
new tools have been introduced into the urban planning and design fields to aid the collection of
data from community residents. In 2017, Kamel Boulos and colleagues focused on the benefits

                                                                                               3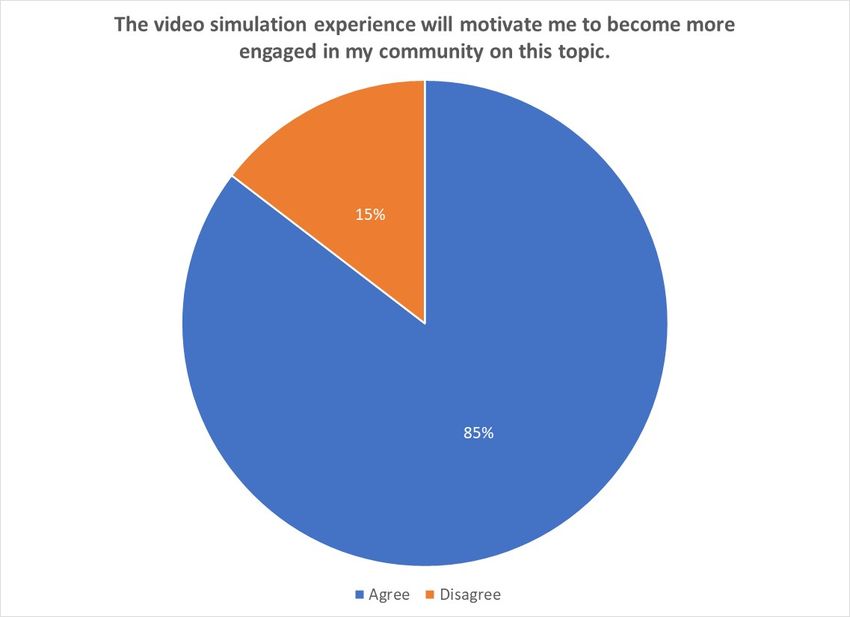
of implementing both virtual reality Geographic Information Systems (VRGIS) and augmented
reality GIS (ARGIS) in new project opportunities, especially focused on public health, the
environment, and higher-quality housing options for individuals and communities. One of the main
benefits of using VR combined with the GIS database is its unique capacity to visualize 3D
projects from all possible perspectives, and users including city managers and community
residents can actually see and experience the design (Kamel Boulos et al., 2017).

DEFINING AUGMENTED, VIRTUAL, AND MIXED-USE REALITY
       Immersive environments are the environments created by immersive technologies (Bach
et al., 2016), including virtual reality (VR), augmented reality (AR) and mixed reality (MR). While
VR completely occludes the natural environment and immerses users into digital environments,
AR and MR superimpose virtual information into the user’s natural surroundings in real time
(Millgram and Kashino, 1994). MR distinguishes itself further by enabling interaction and
manipulation between physical and virtual content (Foundry, 2017). AR and MR technologies
supplement our perception of the real world rather than supplant.
       Immersive technologies use stereoscopic techniques, thereby creating an engaging and
immersive visual environment (Bach et al., 2016). VR/AR/MR head-mounted displays and mobile
systems are becoming increasingly accessible, spanning a wide range of prices, levels of
sophistication and functionalities such as Google Cardboard, Microsoft HoloLens, HTC VIVE, and
Samsung Oculus Rift and others. The low-cost hardware technologies are expanding the
opportunities for practical applications and scientific insights. Immersive environments have
already started to transform how individuals learn, make decisions, and interact with the physical
world across the fields of visualization, construction, architecture, urban and environmental
planning.

VIRTUAL & AUGMENTED REALITY IN URBAN PLANNING
       Real-time 3D visualization provides an in-depth analysis of the current urban fabric of a
city, as well as future development. This software can also be used to present simulations of
landscape structure flood disasters and other natural emergency scenarios, to better understand
the impacts these may have on one community or several. To support the stated benefits that VR
has on flood and natural disaster planning, Haynes, Hehl-Lange, and Lange (2018) introduced
and studied a new prototype browsing and authoring tool used for in-situ flood visualization named
Mobile Augmented Reality (MAR). The MAR application is available to run on most smart phones
and gives users the opportunity to immerse themselves in real time visualization. The software

                                                                                                 4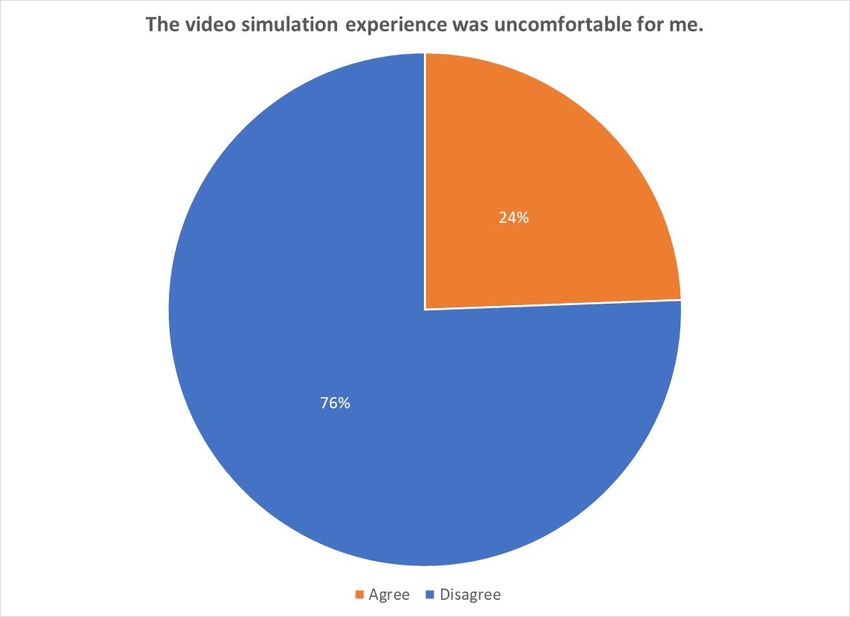
accesses live sensor readings that provide real time annotations. The overall conclusion of the
study was that VR apps could prove to be a valuable tool for planning, design, and emergency
management.
       With proper tools like the MAR app, significant access to different platforms of information
and involving the community in the planning process is now easier and more important than ever.
Schrom-Feiertag et al (2020) focus on the role of VR technology in participatory planning and
integrating local residents in new project development. In one case, the users explored a virtual
environment presenting a multi-modal traffic simulation using what the researchers called a
“gamified approach with story-telling” (p. 119). Once the users were immersed into the virtual
world, they encountered virtual questionnaires for in-situ feedback that helped city planners
understand how the users both saw and felt the surrounding environment. Employing this
technique and using the VR technology facilitated the site planning process and also simplified
the community’s analysis via immersion and real time feedback from the participating users in the
virtual scenario.
       Van Leeuwen et al (2018) presented a case study and controlled experiment
demonstrating the effectiveness of VR in participatory urban planning in The Hague, Netherlands.
The researchers employed human-centered computing, meaning an equal combination or
interaction of virtual reality with participatory design and its users. The study incorporates a novel
approach, focusing on how VR can help direct essential municipal investments and justify them
in the redesign of public spaces. The process incorporated 3D modeling tools and VR,
empowering citizens to co-create and negotiate design decisions in collaboration with planning
experts. The VR headsets provided a higher engagement with planners and successfully
integrated the municipal process of citizen outreach and planning.

USE OF 2D VIDEO FOR PARTICIPANT ENGAGEMENT
       Further research on the complementary effects of digital technologies on the public
participation process were developed by the Meenar and Kitson (2020). Their New Jersey case
study found that the level of participation and emotional response are much higher when
multisensory or multi-dimensional VR simulations (immersive virtual reality) are used in contrast
with simple 2D presentations or verbal explanations. Immersive virtual reality (IVR) technologies
include 4D auditory and olfactory stimulation cues that fully immerse the user in the proposed
model. In the current digital era where public engagement has become a higher priority in the
planning agenda, multi-sensory 3D and 4D immersive virtual reality technologies offer urban
planners and policy makers opportunities to expand and supplement public engagement

                                                                                                    5
simulations and participation. In a similar study conducted in Virginia, Polys et al (2018) found
that the 3D models and videos are superior planning tools to support decision making and
community outreach when compared with 2D presentations and survey questions, even though
the latter remain relevant and useful tools.
Although the use of visual aids in the urban planning context has been used for over 20
years, VR and AR technologies offer new opportunities for community participation. For the
project, Visual Learning Spaces for Fieldwork in Urban Planning (VLF-BY), students, teachers
and research faculty collaborated to explore the role of visual and digital engagement tools in
Bhopal and Trondheim (Vrebos, H., Nielson, B., & Styve, A, 2019). The VLF-BY project suggests
the introduction of new tools such as mobile ethnography, app/web-based data collection, and
the use of video and interactive 3D imagery in immersive technologies can innovate participation.
Furthermore, the project explored how visualization and digitalization facilitates learning and
participation for users and planners at a much higher level than previously observed, creating a
“common language” between all parties involved.
Even though conventional methods of public participation can be improved with the
introduction of new VR/AR technology, given the current circumstances of the COVID-19
pandemic, bringing community members and the administrative team together to test and
experience the VR and AR technology was no longer a viable option. Nevertheless, the
digitalization of the data facilitates both learning and public participation, even if in a 2D format.
The 2D immersive video display helps participants better understand the proposal while still
providing a reliable communication platform. This interaction will allow a distanced participatory
process. Technology, and more specifically the video, will facilitate collaborative distant work and
citizen participation (Hanzl, 2007). A 2009 digital workshop in Bowen Island, British Columbia
proved the benefits of using digital visualizations for planning proposals and participant feedback.
The workshop concluded that the abilities to “dynamically explore the visualizations of planning
proposal” and to be able to see “real- time changes” were very informative to community member
and administration (Salter et al, 2009). Additionally, the video interaction increased participants’
overall understanding of the plan, allowing them to develop a better judgement of the plan’s effects
on the community.
SHORT- AND LONG-TERM EFFECTS OF VR/AR/MR ON CIVIC ENGAGEMENT
Community feedback is an integral component of the planning process. Participatory
planning stands to significantly benefit from developments in VR/AR/MR technologies by
enhancing stakeholder understanding of the existing and future built environment and increasing
6levels of informed deliberation about spatial and policy variables. However, the question remains:
can VR/AR/MR visualizations motivate stakeholders, to not only participate in the immediate
experience, but to stay involved in community planning activities in the short- and long-term? At
present, further research is needed that focuses on whether VR/AR/MR technologies affect the
sustainability of civic engagement.
METHODOLOGICAL APPROACH
This section describes the study area and the development of quasi-experiment, which includes
the visualization and survey distribution.
SELECTION OF STUDY AREA
The study area was located in Waikiki, a neighborhood in Honolulu, Hawaii. The study focused
on Liliuokalani Ave. from Ala Wai Blvd. to Kalakaua Ave with a focus on the intersection at Kuhio
Ave. The flooding projections compared current conditions (see Figure 1) with those projected for
the year 2100 based on data from NOAA presented by their NOAA Sea Leve Rise Viewer (see
Figure 2).
Figure 1: Current Conditions in Waikiki, Honolulu, Hawaii from the NOAA SLR Viewer
7Figure 2: Five Foot SLR based on Worse-Case Scenario for Year 2100
Figure 3: Snapshot from Immersive 3D Model of SLR in Waikiki
8VISUALIZATION AND SURVEY DISTRIBUTION
The research team developed two visualizations embedded into a quasi-experimental
online survey. After participants consented to participate in the study, they viewed a four-minute,
recorded PowerPoint lecture which included the maps shown in Figures 1 and 2, along with
supplemental information to describe the timing of the worse case flooding by the year 2100. This
video was embedded in a Qualtrics online survey and participants were asked to complete Survey
1 after watching the first video. After they completed Survey 1, they watched a 2 minute 30 second
video that provided a narrated, immersive experience with the flood water shown in video 1
depicted in 3D model (see snapshot from video in Figure 3).
The survey was distributed to residents, the business community, civic organizers, coastal
planners and managers including the following: the Waikiki Business Improvement District
Association network of businesses, to neighborhood groups such as the Waikiki Neighborhood
Board to distribute in their sub-districts, Waikiki Community Center and local interest groups such
as After Oceanic and Protect Our Ala Wai Watersheds organization, coastal management
professionals at the Department of Land and Natural Resources, University of Hawaii Sea Grant
network, and the Office of Coastal and Conservation Lands (OCCL), who coordinate the state
climate commission activities and manage much of the coastal planning work in Waikiki, and to
the Hawaii Shore and Beach Preservation Association (HSBPA), consisting of many of the coastal
management professionals in the state (including Sea Grant and OCCL representatives).
9RESULTS
This section summarizes the results of the study, including an overview of the study participants,
opinions about the immersive visualization quasi-experiment, and findings about opinions based
on political views.
OVERVIEW OF STUDY PARTICIPANTS
The quasi-experiment conducted using the online survey format yielded 82 completed responses.
Table 1 reports that the males accounted for two-thirds of the sample and females accounted for
nearly 30% while 5% responded as other or did not respond. Table 2 shows the age distribution
of the participants. The largest segment (37%) was in the 56-70 cohort followed by 22% in the
41-55 cohort and 20% in the 26-40 cohort. Ages 18-25 constituted 11% of participants followed
by 8.5% 71 or older. Table 3 reports the race and ethnic profile of participants. The largest group
(41%) identified as Asians followed by Whites (40%). Indigenous Hawaiian/Native
American/American Indian constituted 11% followed by Hispanic/Latino at 4.4%. Collectively,
Caribbean/Islander and Other were approximately 3% of participants.
As shown in Table 4, the vast majority of participants were highly educated, with 38% having
bachelor’s degrees and 49% having graduate degrees or higher. Table 5 shows the self-reported
pollical profile of participants with 55% of the respondents identifying on the left, 23% as
independent and 18% on the right. Approximately 4% did not respond to this question. Finally,
Table 6 shows that the majority of participants are comfortable with technology. Only 9.7%
indicated that they were not comfortable with technology.
10Table 1: Sex of Participant
Frequency Percent
Male 54 65.8
Female 24 29.3
Other/prefer not to respond 3 3.7
Missing 1 1.2
Total 82 100
Table 2: Age Distribution of Participants
Frequency Percent
18-25 9 11.0
26-40 16 19.5
41-55 18 22.0
56-70 30 36.6
71+ 7 8.5
Missing 2 2.4
Total 82 100
Table 3: Race and Ethnicity of Participants
Frequency Percent
Asian 37 41.2
Caribbean/Islander 1 1.1
Hispanic/Latino 4 4.4
Indigenous Hawaiian Islander/Native American/American Indian 10 11.1
White 36 40.0
Other 2 2.2
1
Total 90 100
Note: Respondents were allowed to check more than one primary race/ethnicity.
Table 4: Educational Profile of Participants
Frequency Percent
High school graduate 2 2.4
Some college but no degree 5 6.1
Associate/Junior College Degree 4 4.9
Bachelor’s Degree 31 37.8
Graduate Degree or Higher 40 48.8
Total 82 100
11Table 5: Self-Identified Political Profile of Participants (Question: Where do you consider yourself
of the political spectrum?)
Frequency Percent
Very liberal 16 19.5
Somewhat liberal 29 35.4
Independent 19 23.2
Somewhat conservative 13 15.9
Very conservative 2 2.4
Missing 3 3.7
Total 82 100
Table 6: Self-Reported Comfort with Technology (Statement: I am comfortable with technology.)
Frequency Percent
Strongly Disagree 1 1.2
Disagree 7 8.5
Somewhat Agree 35 42.7
Strongly Agree 39 47.6
Total 82 100
OPINIONS ON EFFECTIVENESS OF IMMERSIVE VISUALIZATION
Participants answered a number of questions regarding the effectiveness of the immersive
visualization. Tables 7 and 8 and Figures 4 and 5 report the findings on understandability. As
shown in Table 7 and Figure 4, 87% of participants agreed with the statement that after visualizing
the street in the video simulation, the respondent was better able to understand the data depicted
in the charts/graphs, which was shown earlier in the study. Table 8 and Figure 5 found that 88%
reported better understanding the data depicted presentation. In the first part of the survey, data
were shown using 2D maps, therefore for the vast majority of respondents, the immersive
visualization provided strong benefits for improving understandability.
12Table 7: Understandability (Statement: After visualizing the street in the video simulation, I am
better able to understand the data depicted in the charts/graphs.)
Frequency Percent
Strongly Disagree 1 1.2
Disagree 10 12.2
Somewhat Agree 32 39.0
Strongly Agree 39 47.6
Total 82 100
Figure 4: Understandability
13Table 8: Understandability (Statement: After visualizing the street in the video simulation, I am
better able to understand the data depicted in the presentation.)
Frequency Percent
Strongly Disagree 1 1.2
Disagree 9 11.0
Somewhat Agree 33 40.2
Strongly Agree 39 47.6
Total 82 100
Figure 5: Understandability
The quasi-experiment showed participants a video at the beginning with a narration showing
NOAA SLR maps (shown in Figure 1 and 2) that indicated flooding in the Waikiki study area.
Afterward, participants viewed a second video showing the same Waikiki data modelling in a video
with a 3D life-like model of the intersection at Liliuokalani Ave. and Kuhio Ave. (shown in Figure
3). Even though new data were not presented to the participants, 75% agreed that the video
simulation provided them with new information on the topic (see Table 9 and Figure 6). This
powerful finding speaks to the impact of the immersive 3D visualization.
14Table 9: Visualizing “New” Data (Statement: The video simulation provided me with new
information on the topic of sea-level rise.)
Frequency Percent
Strongly Disagree 1 1.2
Disagree 19 23.2
Somewhat Agree 39 47.6
Strongly Agree 22 26.8
Missing 1 1.2
Total 82 100
Figure 6: Visualizing “New” Data
Table 10 and Figure 7 report that 95% of the participants agreed with the statement that people
in their community would benefit from the video simulation. Table 11 and Figure 8 show that
76% of the participants did not agree that the experience was uncomfortable, and Table 12 and
Figure 9 show that 93% of participants would participate in a video simulation experience again.
15Table 10: Community Benefits (Statement: People in my community would benefit from the
video simulation.)
Frequency Percent
Strongly Disagree 1 1.2
Disagree 3 3.7
Somewhat Agree 37 45.1
Strongly Agree 41 50.0
Total 82 100
Figure 7: Community Benefits
16Table 11: Discomfort (Statement: The video simulation experience was uncomfortable for me.)
Frequency Percent
Strongly Disagree 20 24.4
Disagree 42 51.2
Somewhat Agree 16 19.5
Strongly Agree 4 4.9
Total 82 100
Figure 8: Discomfort
17Table 12: Motivation (Statement: The video simulation experience will motivate me to become
more engaged in my community on this topic.)
Frequency Percent
Strongly Disagree 2 2.4
Disagree 10 12.2
Somewhat Agree 50 61.0
Strongly Agree 20 24.4
Total 82 100
Figure 9: Motivation
18OPINIONS BASED ON POLITICAL VIEWS
Table 12 shows the results of opinions in survey 1 (before the immersive video) and in survey 2
(after the immersive video). When looking at all respondents, the percentage who strongly agreed
that SLR is a major threat to residents and businesses located in the study area increased from
73.4% to 77.2% (an absolute change of 3 people). When looking at this change based on political
category, two on the left and one independent changed their views, and no changes were evident
for those on the right side of the political spectrum. Other analyses were conducted which looked
at before and after changes in opinions based on age and education level, but no patterns were
detected.
Table 12: Before and After Opinions on SLR based on Political Views
Survey 1 (Before Immersive Video)
Sea-level rise is a major
Political Category
threat to the residents
and businesses located in
the study area.
Left Independent Right All
Number Percent Number Percent Number Percent Number Percent
Disagree 0 0% 1 5% 1 6.7% 2 2.6%
Somewhat Agree 10 22.2% 6 31.6% 3 20.0% 19 24.1%
Strongly Agree 35 77.8% 12 63.2% 11 73.3% 58 73.4%
Total 45 100% 19 100% 15 100% 79 100%
Survey 2 (After Immersive Video)
Number Percent Number Percent Number Percent Number Percent
Disagree 0 0% 2 10.5% 1 6.7% 3 3.8%
Somewhat Agree 8 17.8% 4 21.1% 3 20.0% 15 19.0%
Strongly Agree 37 82.2% 13 68.4% 11 73.3% 61 77.2%
Total 45 100% 19 100% 15 100% 79 100%
19CONCLUSIONS
This conclusion will revisit the research questions of this study, which include: A. To test
if immersive visualizations of sea-level rise (SLR) results in a deeper understanding of impacts to
streets in the Waikiki section of Honolulu, Hawaii and B. To test if immersive visualizations can
be conducted and effective using a video-embedded survey, as a result of the COVID-19
pandemic, that prevented in-person meetings and workshops. This section will also discuss some
of the limitations of this study.
This study found that participants were better able to understand the data about flood
impacts in the future due to SLR after watching a 3D video depicting the extent of the flooding at
an intersection within the study area. Seventy-five percent (75%) of participants reported that the
video simulation provided them with “new” data on the topic, when in fact the visualization
provided the same data shown earlier in 2D maps. The visualization was so impactful that 95%
reported that other people in their community would benefit from watching the video and 85%
reported that they would become more engaged on the topic of SLR as a result of watching the
video. The study also found that those on the left and center of the political spectrum were more
likely to change their opinions compared to respondents on the right side of the spectrum, but the
sample size only included 15 participants that identified as conservative, so more research is
needed before any conclusions can be drawn about political identity and how fixed opinions are
on this topic. The other study in Fort Lauderdale found some shifting of opinions for those on the
right.
In conclusion, this study provides evidence for the use of immersive video visualizations
for improving the comprehensive of the impacts of SLR on communities. This quasi-experiment
was initially supposed to be conducted at in-person workshops in the study area, but due to
COVID-19 restrictions, the methodology was changed to include online, immersive videos. In
comparison to a recent study led by the same team in Fort Lauderdale that used in-person virtual
reality (VR) googles, the online video format seemed to work well, and results were comparable
to the VR model. This does not mean that VR is not an effective tool for planners to use in
educating communities about SLR, but findings from this study indicate the immersive videos can
also work well.
Limitations of this study included the need to change the study from an in-person VR
experience to an online, video driven experience due to COVID-19. The participants who
responded over-represented males, highly educated members of the community and individuals
on the left side of the political spectrum.
20REFERENCES
Bach, B., Dachselt, R., Carpendale, S., Dwyer, T., Collins, C., Lee, B. (2016). Immersive
analytics: Exploring future interaction and visualization technologies for data
analytics. In: ACM Proceedings on Interactive Surfaces and Spaces.
Foundry Insights Hub. (2017). VR? AR? MR? Sorry, I’m confused.
https://www.foundry.com/industries/virtual-reality/vr-mr-ar-confused
Ford, G., Canter, A., & Hensold, B. (2020). Innovating Community Involvement in Urban
Design. SmartCitiesDive.
https://www.smartcitiesdive.com/ex/sustainablecitiescollective/innovative-
outreach-key-urban-design/115086/
Hanzl, M. (2007). Information technology as a tool for public participation in urban
planning: A review of experiments and potentials. In Design Studies (3rd ed., Vol.
28, pp. 289-307). Lodz: Institute of Architecture and Town Planning, Technical
University of Lodz. doi:https://doi.org/10.1016/j.destud.2007.02.003
Haynes, P., Hehl-Lange, S., & Lange, E. (2018). Mobile Augmented Reality for Flood
Visualization. Environmental Modelling & Software, 109, 380-389.
doi:10.1016/j.envsoft.2018.05.012
Kamel Boulos, M. N., Lu, Z., Guerrero, P., Jennett, C., & Steed, A. (2017). From urban
planning and emergency training to Pokémon Go: Applications of virtual reality
GIS (VRGIS) and augmented reality GIS (ARGIS) in personal, public and
environmental health. International Journal of Health Geographics, 16(1).
doi:10.1186/s12942-017-0081-0
Meenar, M., & Kitson, J. (2020). Using Multi-Sensory and Multi-Dimensional Immersive
Virtual Reality in Participatory Planning. Urban Science, 4(3), 34.
doi:10.3390/urbansci4030034
Milgram, P., & Kishino, F. (1994). A taxonomy of mixed reality visual displays. IEICE
TRANSACTIONS on Information and Systems, 77(12), 1321-1329.
21Polys, N., Newcomb, C., Schenk, T., Skuzinski, T., & Dunay, D. (2018, June). The value of
3D models and immersive technology in planning urban density. In Proceedings of
the 23rd International ACM Conference on 3D Web Technology (pp. 1-4).
https://doi.org/10.1145/3208806.3208824
Salter, J. D., Campbell, C., Journeay, M., & Sheppard, S. R. (2009). The digital workshop:
Exploring the use of interactive and immersive visualisation tools in participatory
planning. Journal of Environmental Management, 90(6), 2090-2101.
https://www.sciencedirect.com/science/article/pii/S030147970800114X
Schrom-Feiertag, H., Stubenschrott, M., Regal, G., Matyus, T., & Seer, S. (2020). An
interactive and responsive virtual reality environment for participatory urban
planning. In Proceedings of the Symposium on Simulation for Architecture and
Urban Design SimAUD (119-125). http://simaud.org/2020/preprints/67.pdf
van Leeuwen, J. P., Hermans, K., Jylhä, A., Quanjer, A. J., & Nijman, H. (2018).
Effectiveness of virtual reality in participatory urban planning. In Proceedings of
the 4th Media Architecture Biennale Conference on - MAB18.
doi:10.1145/3284389.3284491
Vrebos, H., Nielsen, B. F., & Styve, A. (2019). Challenges and opportunities for visual
learning spaces for fieldwork in Urban Planning: Lessons from Bhopal and
Trondheim Læring om læring, 3(1).
https://www.ntnu.no/ojs/index.php/lol/article/view/3042
22You can also read