Environmental impact of disruptions and airspace inefficiencies in Europe
←
→
Page content transcription
If your browser does not render page correctly, please read the page content below
Amsterdam, March 2019
 Commissioned by Airlines for Europe (A4E)

 Environmental impact of disruptions and
 airspace inefficiencies in Europe

 Final report

 Rogier Lieshout (SEO)
 Gerben de Jong (SEO)
 Tom Verboon (To70)
 Xander Mobertz (To70)

SEO Amsterdam Economics - Roetersstraat 29 - 1018 WB Amsterdam - T (+31) 20 525 1630 - www.seo.nl - secretariaat@seo.nl
 ABN-AMRO IBAN: NL14ABNA0411744356 BIC: ABNANL2A - ING: IBAN: NL96INGB0004641100 BIC: INGBNL2A
 KvK Amsterdam 41197444 - BTW NL 003023965 B01
“Solid research, Sound advice”

 SEO Amsterdam Economics carries out independent applied economic research on behalf of national and international
 clients – both public institutions and private sector clients. Our research aims to make a major contribution to the
 decision-making processes of our clients. Originally founded by, and still affiliated with, the University of Amsterdam,
 SEO Amsterdam Economics is now an independent research group but retains a strong academic component.
 Operating on a nonprofit basis, SEO continually invests in the intellectual capital of its staff by granting them time to
 pursue continuing education, publish in academic journals, and participate in academic networks and conferences. As
 a result, our staff is fully up to date on the latest economic theories and econometric techniques.

SEO report no. 2019-13

Copyright © 2019 SEO Amsterdam Economics, Amsterdam. All rights reserved.

 SEO AMSTERDAM ECONOMICS

ENVIRONMENTAL IMPACT OF DISRUPTIONS AND AIRSPACE INEFFICIENCIES IN EUROPE i Key findings Fuel efficiency improvements through airline investments Investments in new aircraft technology and operations improve fuel efficiency on intra-EEA flights by 1.9% per year; Over the 2015-2017 period, these investments saved 3.9 Mt (Megatonnes) of fuel and 12.2 Mt of CO2, corresponding to around 1 million commercial passenger flights or two months of flying within the EEA. Environmental impact of ATC-strikes and technical failures at European ANSPs Europe faced 33 strikes at Air Traffic Control (ATC) and 64 technical failures at Air Navigation Service Providers (ANSPs) over the 2015-2017 period, most of which occurred in France; ATC-strikes on average affect more flights (3,468 per day) than technical failures (1,329 per day); The impact of ATC-strikes on flight efficiency was also larger than that of technical failures: An average strike increased flight distance by 70,000 kilometres per day requiring 200 tonnes of additional fuel; An average technical failure increased flight distance by 3,000 kilometres per day, requiring 10 tonnes of additional fuel; Together ATC-strikes and technical failures increased flight distance by 4.6 million kilometres over the 2015-2017 period. As a result, fuel consumption and CO2-emissions increased by 13.7 kt (kilotonnes) and 43.0 kt respectively, corresponding to around 3,500 commercial passenger flights within the EEA; ATC-strikes were responsible for most of the increases in flight distance (4.4 million kilometres), fuel consumption (12.9 kt) and CO2-emissions (40.7 kt); French strikes and technical failures were responsible for almost 98% of this increase in fuel consumption and emissions. This is explained by the relatively high number of French strikes and technical failures, the central geographic location of France in Europe, the relatively long duration of French strikes (2 days on average) and the fact that not all overflights are accommodated. Environmental impact of ATM-inefficiencies in European airspace Due to inefficiencies in European Air Traffic Management, flight distances for intra-EEA flights were 0.61-0.76% longer than technologically possible over the 2015-2017 period; These inefficiencies resulted in 229 kt of additional fuel burn and 721 kt of additional CO2 over the 2015-2017 period, corresponding to around 60,000 commercial passenger flights or 4 days of flying within the EEA. SEO AMSTERDAM ECONOMICS
ENVIRONMENTAL IMPACT OF DISRUPTIONS AND AIRSPACE INEFFICIENCIES IN EUROPE i Executive summary Climate change is one of the major challenges facing our generation. The aviation industry has committed itself to reduce its impacts on the climate. Airlines continuously invest in more fuel- efficient aircraft and improving their flight operations. Their achievements are (partly) offset by inefficient flight operations caused by disruptions (strikes and technical failures) at European Air Navigation Service Providers (ANSPs) and the fragmented design of European airspace. Such inefficiencies result in suboptimal flight paths causing additional fuel consumption and CO2- smissions. Previous studies have analysed the economic impacts of disruptions and the design of European airspace. This study for the first time provides an in-depth analysis of the environmental impact of disruptions and Europe’s fragmented airspace. First, the study describes the technological and operational measures that airlines have taken to improve their fuel-efficiency and quantifies their environmental impact for intra-EEA flights over the 2015-2017 period. Second, it outlines which disruptions have occurred at European ANSPs over the same time period and estimates their impact on the environment. Third, the study describes the progress made in reforming European airspace design, the inefficiencies that remain and their impact on the environment. Airline measures to improve efficiency In 2009, the aviation industry recognized the need to address climate change and adopted a set of goals for the short-, medium- and long-term reduction of its CO2-emissions: Short-term (by 2020): improve fuel efficiency and CO2 emissions by 1.5% per annum; Medium-term (after 2020): cap emissions providing carbon-neutral growth (CNG2020); Long-term (by 2050): reduce net CO2 emissions by 50% compared to 2005 levels. Airlines contribute to these goals by investing in more fuel efficient technologies and operations. Due to technological innovations new generation aircraft are around 15% more fuel efficient than the models they replace. Furthermore, airlines optimize operations, for instance by increasing load factors. Over the past decade, the average load factor for intra-EEA flights increased by almost 10 percentage points to around 82%. Methodology First we determine to what extent fuel efficiency for intra-EEA flights has increased as a result of technical and operational (higher load factors) measures taken by airlines. For all scheduled passenger flights sourced from OAG’s Schedule Analyser, we calculated the associated fuel consumption per seat kilometre in the various flight phases using our in-house emissions model. The development in the fuel consumption per seat kilometre represents the contribution of investments in new aircraft technology on fuel efficiency. Next, we use average industry load factors for the EEA to estimate fuel consumption per passenger kilometre. This shows the added contribution of higher load factors to fuel efficiency. Based on the increases in fuel efficiency we SEO AMSTERDAM ECONOMICS
ii

calculate how much fuel and emissions were saved within the EEA over the 2015-2017 period
because of technological and operational measures taken by airlines.

Results
The average fuel efficiency of intra-EEA flights has improved by almost 2% per year over the last
decade. Technological and operational measures both contributed to higher fuel efficiency. Figure
S.1.1 shows the fuel and emissions savings through technical and operational measures taken by
airlines for intra-EEA flights in the 2015-2017 period. Fuel and emissions savings increase year by
year, reflecting continuous technological and operational improvements. The fuel savings over the
2015-2017 period cumulate to 3.9 Mt (Megatonnes)1, translating into over 12.2 Mt of CO2. This
corresponds to the fuel consumption and emissions of around 1 million commercial passenger
flights or two months of flying within the EEA.

Figure S.1.1 Technological and operational measures saved over 12 Mt of CO2

 3
 Operational (load factors) 9
 Fuel saving compared to 2014 (mln tonnes)

 CO2-saving compared to 2014 (mln tonnes)
 Technological

 2
 6

 1 3

 0 0
 2015 2016 2017

Source: SEO/To70 analysis

Disruptions
Disruptions due to strikes at Air Traffic Control (ATC) and to technical failures at ANSPs may
lead to the temporary closure or limitation of available capacity of certain airspace sectors. Such
capacity reductions may cause delays, flight cancellations and the rerouting of aircraft, negatively
impacting passengers, airlines and the environment. Passengers are confronted with longer travel
times disrupting their travel plans. Airlines are confronted with cost increases as a result of
compensation payments to passengers, the implementation of contingency plans, extended
working time for personnel and increased fuel consumption. The latter also translates into more
CO2-emissions, which negatively impacts the environment.

1 One Megaton equals 1,000 kilotonnes or 1,000,000 tonnes.

SEO AMSTERDAM ECONOMICS
EXECUTIVE SUMMARY iii

Previous studies have assessed the economic impacts of ATC-strikes at ANSPs. One study assessed
the impact of strikes on flight distance. No study estimated the impacts of technical failures at
ANSPs on flight efficiency yet, nor did the studies assess the environmental impact of disruptions.
This study is the first to provide an in-depth analysis of the impacts of strikes and technical failures
at ANSPs on flight efficiency and the environment.

Methodology
To estimate the EEA-wide environmental impact of ATC-strikes and technical failures at ANSPs
we use a four-step approach:

1. Identification of affected flights. For each disruption, we identify which airspace sectors
 were affected using Eurocontrol’s DDR/NEST data. Next we analyse which routes crossed
 these sectors one week before the disruption actually took place. All flights that also operated on these
 routes on the day of the disruption were identified as affected flights;
2. Estimation of additional flight distance per affected flight. Second, we estimate the
 additional horizontal flight distance of the affected flights due to the airspace disruptions. For
 this estimation we use an econometric method called difference-in-difference (DiD). This method
 allows us to compare the horizontal flight distance of the affected flights with the flight
 distance one week before, while controlling for possible time trends;
3. Translation of additional flight distance into fuel consumption. Third, we use
 Eurocontrol BADA data to translate the increases in horizontal flight distance into additional
 fuel consumption;
4. Translation of additional fuel consumption into additional CO2-emissions. Finally we
 translate the additional fuel burn into CO2-emissions.

Results
Over the 2015-2017 period, traffic controllers at European ANSPs went on strike 33 times (see
Figure S.1.2).2 The French controllers at DSNA were responsible for the majority of all strikes
(60%), followed by the Italian controllers (18%). The majority of the strikes in France were so-
called ‘solidarity strikes’, supporting national labour disputes. Solidarity strikes in France were in
many cases supported by DSNA staff. The strikes in Italy had to do with the privatisation of the
national ANSP: ENAV.

ATC-strikes in France are normally full day strikes (midnight to midnight) and often cover multiple
days, whereas strikes in other Member States, such as Italy and Greece, are generally limited to a
few hours. In terms of strike days, France is therefore responsible for an even larger share (74%)
than in terms of number of strikes.

2 See Appendix A for an overview of all strikes at ATC-organizations between 2015-2017.

 SEO AMSTERDAM ECONOMICS
iv

Figure S.1.2 Most ATC-strike(day)s took place at the French ANSPs between 2015 and 2017

 35 35
 France Greece Italy
 Romania Spain
 30 30

 Number of strikedays
Number of strikes

 25 25

 20 20

 15 15

 10 10

 5 5

 0 0
 2015 2016 2017 2015 2016 2017

Source: Eurocontrol (2016a, 2017c, 2018a), analysis by SEO/To70
Note: The data includes only strikes by air traffic controllers. Strikes by other categories of staff, such as ATC-
 technicians, are not included. Also strikes by air traffic controllers that are called on short notice may
 sometime be recorded as ‘staffing issues’ and therefore may not be included in the data.

Over the 2015-2017 period, Eurocontrol recorded 64 technical failures, more than half of which
occurred in 2017. One in every three technical failures occurred at the French ANSP. Most failures
were caused by radar or communication failure. Technical failures on average took 2.5 days to
solve. As an exception, the Swiss ATC centres of Geneva and Zurich in 2017 experienced radar
instability issues for 30 days. When we exclude these Swiss failures, the average technical failure
prolongs for 1.5 days.

Figure S.1.3 Most technical failures take place at French ATC-organizations

 40 140
 France Germany Portugal
 Sweden Other
 35 120
Number of technical failures

 Days with technical failures

 30
 100
 25
 80
 20
 60
 15
 40
 10

 5 20

 0 0
 2015 2016 2017 2015 2016 2017

Source: Eurocontrol (2016a, 2017c, 2018a), analysis by SEO/To70

The average number of flights affected by a disruption is 2,310. Strikes on average affected more
flights (3,468) than technical failures (1,329). Differences between individual disruptions are large,

SEO AMSTERDAM ECONOMICS
EXECUTIVE SUMMARY v

ranging between 68 and 7,000 flights. French strikes generally affected a relatively large number of
flights. This is explained by (1) the central location of France in Europe, (2) the fact that French
strikes generally last for an entire day and (3) that not all overflights are accommodated.

During a disruption flight distances of flights through affected airspace increase by 9.8 kilometres
on average. This constitutes a 0.7% increase in total flight distance. For strikes, the increase in flight
distance is significantly larger (+17.1 kilometres) than for technical failures (+3.7 kilometres). Again
impacts differ significantly between individual strikes and technical failures. The French strike on
March 6th 2017 for instance increased the average flight distance of affected flights by 76.1
kilometres (+4.7%). There are however also cases in which disruptions led to reductions in flight
distance. This may be explained by the fact that cancellation of flights reduce congestion, which
allows flights that are not cancelled to follow a more optimal flight path. French strikes led to the
largest increases in flight distance. This is explained by the central geographic location of France in
Europe, the relatively long duration of French strikes (2 days on average) and the fact that not all
overflights are accommodated.

By combining the number of affected flights with the increase in flight distance per affected flight,
we estimate the total additional flight distance caused by disruptions. Table S.1 shows that strikes
and technological failures at European ANSPs increased flight distances for intra-EEA flights by
4.6 million kilometres over the 2015-2017 period. Unsurprisingly, given that both the number of
affected flights and the impact per affected flight is substantially higher for strikes than for technical
failures, the strikes account for the majority (95%) of additional kilometres flown. On average each
strike day resulted in over 70,000 additional flight kilometres; each day with a technical failure on
average led to an additional 3,000 kilometres flown.

Table S.1 Strikes on average increase flight distances by 70,000 kilometres per day

Additional kilometres flown (2015-2017) Full sample Strikes Technical failures
Total 4,619,788 4,377,591 242,198
Mean per disruption day 34,735 71,764 3,364
Minimum per disruption day -16,679 -13,840 -16,679
Maximum per disruption day 314,257 314,257 51,965

Source: SEO/To70 analysis

These increases in flight distance lead to additional fuel consumption and CO2-emissions. Figure
S.1.6 shows the additional consumption and CO2-emissions caused by strikes and technical failures
for intra-EEA flights over the 2015-2017 period. The grand total for the three year period adds up
to 13.7 kt (kilotonnes)3 of kerosene and 43.0 kt of CO2. To put this into perspective, this
corresponds to the fuel consumption and emissions of around 3,500 commercial passenger flights
within the EEA.

3 One kiloton equals 1,000 tonnes or 1,000,000 kilograms.

 SEO AMSTERDAM ECONOMICS
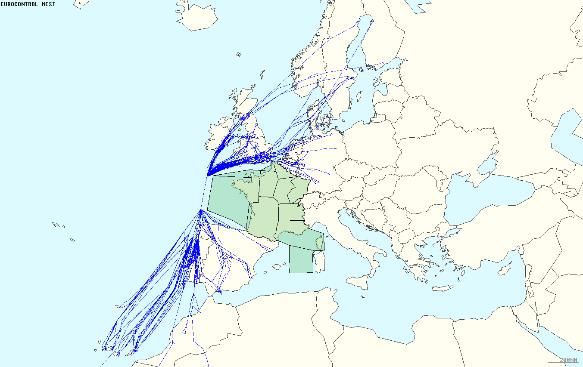
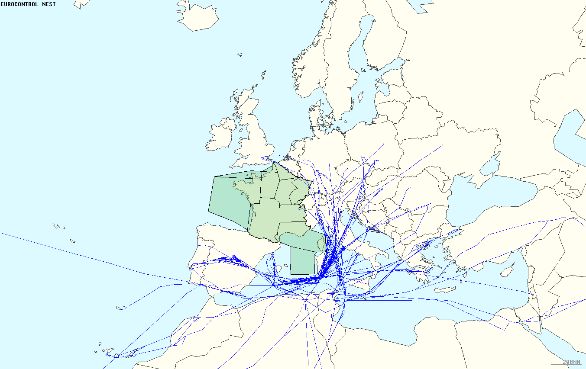
vi

 Case study: French ATC strike on March 22nd 2018
 Multiple trade unions in France representing public sector workers and airline personnel called
 for strikes on the 22 nd and 23 rd of March 2018. On the first day air traffic controllers joined
 the strike. On that day, 28,252 flights operated in European airspace. Of these flights, 5,405
 intra-EEA operated in or near French airspace, almost 1,000 less than the week before the strike.
 Especially short-haul flights were less operated on the day of the strike. Over 200 flights were
 re-routed around French airspace, either westbound or eastbound (see Figure S.1.4). This
 resulted in flight extension of 14% and 21% respectively. The average route extension in the
 area of interest was 5.22%, an increase of 1.8% compared to the week prior to the strike.

 Figure S.1.4 Re-routings around French airspace

 Westbound Eastbound

 Source: SEO/To70 analysis based on Eurocontrol DDR/NEST

 For specific flights the extensions were much larger. A flight from Frankfurt to Lisbon for
 instance was re-rerouted westbound around France, resulting in a 637 kilometre increase in flight
 distance (+33%), requiring an additional 1.9 tonnes of fuel and 6.0 tonnes of CO2 (see Figure
 S.1.5). A flight from Barcelona to Prague was re-routed eastbound, adding 741 kilometres to
 total flight distance (+56%). This required 2.7 tonnes of extra fuel and 8.6 tonnes of CO2.

 Figure S.1.5 Strikes may severely impact specific flights

 Frankfurt Main to Lisbon (+637km, 33%) Barcelona to Prague (+741km, 56%)

 Source: SEO/To70 analysis based on Eurocontrol DDR/NEST

SEO AMSTERDAM ECONOMICS
EXECUTIVE SUMMARY vii

Figure S.1.6 Disruptions in 2016 caused most additional fuel consumption and CO2-emissions

 8 25
 Technical failures Strikes
 Additional fuel consumption (x1,000 tonnes)

 Additional CO2-emissions (x1,000 tonnes)
 7
 20
 6

 5
 15

 4

 10
 3

 2
 5
 1

 0 0
 2015 2016 2017

Source: SEO/To70 analysis

Disruptions in French airspace account for the vast majority of all additional fuel consumption and
CO2-emissions (97.6 percent). The large contribution of French disruptions to additional fuel
consumption and CO2-emissions is explained by the large number of ANSP-strikes in France and
their relatively large impact. Portugal appears to be the second contributor to additional fuel
consumption and CO2-emissions, which is completely driven by equipment issues.

 Case study: Understaffing at Karlsruhe UAC on 22nd December 2018
 In December 2018, Karlsruhe UAC was the biggest generator of en-route delays due to
 understaffing (Eurocontrol, 2019d). Furthermore, Karlsruhe generated 37.4% of ATC capacity
 delays in the European network. Due to the staffing and capacity issues it had a limited number
 of sectors available in 2018, up to 10 less than required and 6 less than in 2017 (Eurocontrol,
 2018b).

 Eurocontrol (2019d) labelled Saturday 22nd of December 2018 as a day with high ATC
 understaffing and capacity issues Karlsruhe. On this day 29 regulations applied causing 18,000
 minutes or delay. The causes of these delays were labelled as ‘ATC staffing’ (around 1,200
 minutes) and ‘ATC capacity’ (around 16,800 minutes).4

 In the week after5 the 22nd of December, flights passing through the Karlsruhe airspace already
 showed a higher flight inefficiency (2.44%) than flights that exclusively passed through adjacent
 airspace (2.33%). On the 22nd of December the flight inefficiency for Karlsruhe airspace

4 As understaffing at Karlsruhe UAC has become a structural issue, operational configurations are now
 planned considering the staff limitations. This means that part of structural understaffing is now regulated
 as a capacity issue, i.e. labelled as ‘ATC capacity’.
5 We did not choose the week before the 22nd, as this week was characterized by many regulations and
 therefore was not considered a good reference.

 SEO AMSTERDAM ECONOMICS
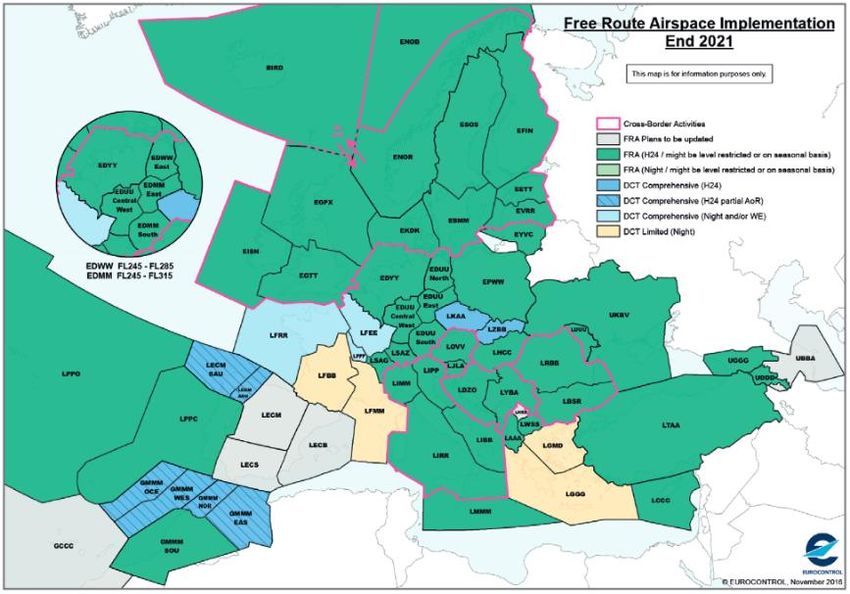
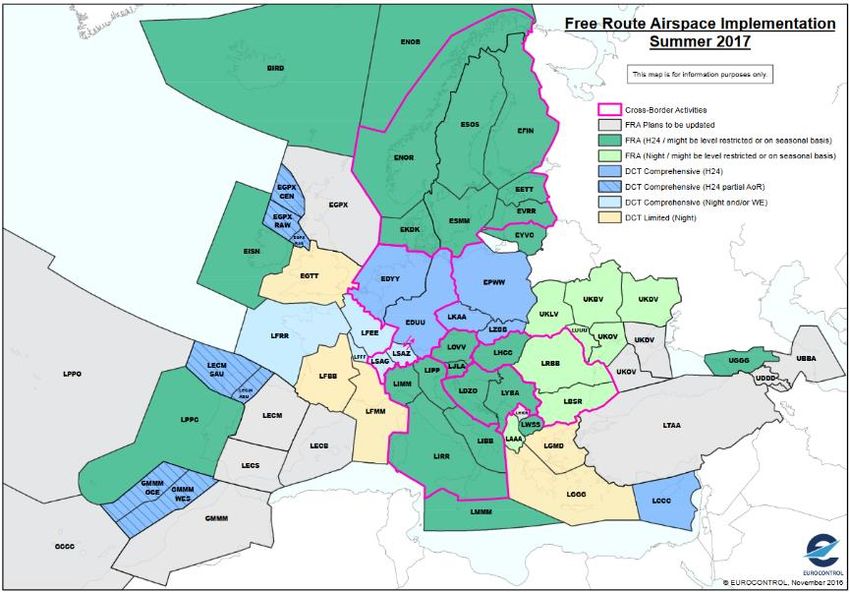
viii

 deteriorated by 0.14 percentage points, whereas flight inefficiency in adjacent airspace
 deteriorated by 0.08 percentage points.

 Apart from airspace regulations, traffic scenarios can be implemented to reduce airspace
 complexity and therefore the workload of the understaffed ATC. Such scenarios may include
 level capping whereby flight level restrictions are applied to specific airspace sectors. This may
 lead to suboptimal vertical flight trajectories, increasing fuel consumption and CO2-emissions.
 These level caps scenarios are also used in Karlsruhe. On the Dusseldorf to Munich route such
 caps increase fuel consumption by 120 kilograms and CO2-emissions by 400 kilograms.

ATM-inefficiencies
Air transport came of age and grew rapidly during the fifties and sixties because of the introduction
of radar technology and jet aircraft. European airspace in this period largely followed national
borders and this is largely still the case. Back in the days civil air traffic routes were designed as
direct routes between the largest centres of population. Military training areas were designed around
the civil route network. To navigate through the route network, ground-based equipment along
these routes was required. Thanks to technological development routes do not fully rely on ground
equipment anymore, nevertheless these routes largely remain in use today. The fragmented airspace
and original route design appears inefficient in managing current and future number of air traffic
movements.

An initiative to reform the architecture of ATM was first launched by the European Commission
in 1999 known as Single European Sky (SES). On the technological side, SES is supported by the
Single European Sky ATM Research (SESAR) Programme launched in 2004. SESAR’s high-level
goals are to increase capacity, reduce delays, improve safety, reduce costs for airspace users and
reduce emissions by 10%.

These goals should be achieved through innovative technical and operational solutions, such as
Functional Airspace Blocks (FABs), Flexible Use of Airspace (FUA) and Free Route Airspace
(FRA). Their of implementation status differs across Europe; general progress has been relatively
low due to political, legal and technical impediments.

Methodology
Based on the performance indicators published by the Performance Review Body of the SES we
estimate the inefficiencies that remain within en-route airspace due to ATM-inefficiencies. These
estimates are used to assess to what extent these inefficiencies increased flight distances for intra-
EEA flights over the 2015-2017 period. Finally, we calculate the associated additional fuel
consumption and CO2-emissions using our in-house emissions model.

Results
In 2015, 2016 and 2017, ATM-inefficiencies caused flight distances to be respectively 0.60%, 0.76%
and 0.61% longer than technologically possible. These inefficiencies led to additional fuel
consumption for intra-EEA flights ranging between 65-88 kt per year (see Figure S.1.7).

SEO AMSTERDAM ECONOMICS
EXECUTIVE SUMMARY ix

Over the entire 2015-2017 period additional fuel burn of intra-EEA flights cumulates to 229 kt,
resulting in 721 kt of additional CO2, corresponding to around 60,000 commercial passenger flights
or 4 days of flying within the EEA.

Figure S.1.7 ATM-inefficiencies lead to unnecessary fuel consumption and CO2-emissions

 100
 300
Additional fuel consumption (x1,000 tonnes)

 Additional CO2-emissions (x1,000 tonnes)
 80 250

 200
 60

 150
 40
 100

 20
 50

 0 0
 2015 2016 2017

Source: SEO/To70 analysis

 SEO AMSTERDAM ECONOMICS
ENVIRONMENTAL IMPACT OF DISRUPTIONS AND AIRSPACE INEFFICIENCIES IN EUROPE i

Contents
Key findings ......................................................................................................................... i

Executive summary.............................................................................................................. i

1 Introduction ...............................................................................................................1

2 Airline measures to improve efficiency ..................................................................... 3
 2.1 Literature review .................................................................................................................... 4
 2.2 Analysis .................................................................................................................................10

3 Disruptions .............................................................................................................. 15
 3.1 Literature review ..................................................................................................................15
 3.2 Disruptions between 2015-2017 .......................................................................................19
 3.3 Analysis .................................................................................................................................21
 3.4 Case studies ..........................................................................................................................32

4 ATM-inefficiencies .................................................................................................. 41
 4.1 Literature review ..................................................................................................................41
 4.2 Analysis .................................................................................................................................49

5 Literature ................................................................................................................ 55

Appendix A ATC-strikes: 2015-2017 .............................................................................. 65

Appendix B Technical failures: 2015-2017 ..................................................................... 67

Appendix C Relationship between flight parameters ................................................... 69

Appendix D A4E member airlines ................................................................................. 73

Appendix E EEA countries and ICAO codes ............................................................... 75

Appendix F Affected flights by disruption .................................................................... 77

 SEO AMSTERDAM ECONOMICS
ENVIRONMENTAL IMPACT OF DISRUPTIONS AND AIRSPACE INEFFICIENCIES IN EUROPE 1

1 Introduction

The aviation industry has committed itself to reduce its impacts on the environment. Airlines continuously invest in
more fuel-efficient aircraft and flight operations. Their achievements are (partly) offset by inefficiencies caused by
disruptions at ANSPs and the fragmented design of Europe’s airspace. This study quantifies the environmental
achievements by the airline industry as well as the environmental impact of disruptions and the fragmented nature of
Europe’s airspace.

Climate change is one of the major challenges facing our generation. In 2015 the 196 member
states of the United Nations Framework Convention on Climate Change (UNFCCC)
demonstrated real commitment to reduce climate change by signing up to the Paris Agreement.
The agreement aims to limit the rise in global average temperature to well below 2°C compared to
pre-industrial levels.6 The aviation industry recognizes the need to flight climate change and set
itself various targets to reduce its CO2-emissions. Airlines reduce their impact on the climate by
investing in more fuel-efficient aircraft and improving flight operations.

Their achievements are (partly) offset by inefficient flight operations caused by disruptions at
European ANSPs and the fragmented design of European airspace. Such inefficiencies result in
suboptimal flight paths resulting in additional fuel consumption and CO2-smissions. Previous
studies have analysed the economic impacts of disruptions and the design of European airspace,
few have assessed their environmental impact.

For intra-EEA flights, this study first estimates the environmental impact resulting from technical
and operational measures taken by airlines over the 2015-2017 period. Second, it provides an in-
depth analysis of the environmental impact caused by disruptions (strikes and technical failures) at
European ANSPs. Third, it shows the environmental impact that are caused by inefficiencies in
Europe’s airspace design.

Reading guide
The next chapter describes the technological and operational measures that airlines have taken to
improve their fuel-efficiency and quantifies their environmental impact for intra-EEA flights over
the 2015-2017 period. Chapter 3 outlines which disruptions have occurred at European ANSPs
over the same time period and estimates their impact on the environment. Chapter 4 presents the
progress made in reforming European airspace design, the inefficiencies that remain and their
impact on the environment.

6 ICAO, the UN agency dealing with aviation is responsible for reducing the impact of international aviation
 on climate change.

 SEO AMSTERDAM ECONOMICS
ENVIRONMENTAL IMPACT OF DISRUPTIONS AND AIRSPACE INEFFICIENCIES IN EUROPE 3 2 Airline measures to improve efficiency In 2009, the aviation industry set itself various goals to reduce their impact on the climate. Airlines contribute to these goals by investing in more fuel efficient technology and operations. As a result the average fuel efficiency of intra- EEA flights has increased by 1.9% per year over the last decade. Over the 2015-2017 period this translated into 3.9 Mt (Megatonnes) of fuel saved and 12.2 Mt less CO2-emissions, corresponding to around 1 million commercial passenger flights or two months of flying within the EEA. In 2009, the aviation industry recognized the need to address climate change and adopted a set of goals for the short-, medium- and long-term to reduce its CO2-emissions (IATA, 2013a; 2015; 2013b; 2018a): Short-term (by 2020): improve fuel efficiency and CO2 emissions by 1.5% per annum;7 Medium-term (after 2020): cap emissions providing carbon-neutral growth (CNG2020);8 Long-term (by 2050): reduce net CO2 emissions by 50% compared to 2005 levels. The goals are supposed to be achieved by a 4-pillar strategy: 1. Investment in new technology: More efficient airframe, engines and equipment, sustainable biofuels, new energy sources;9 2. Efficient flight operations: Drive for maximum efficiency and minimum weight; 3. Effective infrastructure: Improve air routes, air traffic management and airport procedures; 4. Positive economic measures: Carbon offsets, global emissions trading to fill the remaining emissions gap.10 Airlines can mainly influence the first two, i.e. invest in more fuel efficient aircraft technology and flight operations. Section 2.1 provides a literature review describing which technological and operational measures airlines have taken to improve fuel efficiency. Section 2.2 quantifies to what extent fuel-efficiency of intra-EEA has improved due to such measures. This increase in fuel- efficiency is translated into fuel and emission savings realised over the 2015-2017 period. 7 In 2010, the EU and EFTA States agreed to work through ICAO to achieve a global annual fuel efficiency improvement of 2% and to cap the global carbon emissions of international aviation at 2020 levels (European Environment Agency et al., 2019). 8 Multiple studies have indicated that keeping aviation emissions below 2020 levels can only be achieved by a combination of these factors: technological, operational and policy measures and the use of alternative jet fuels (Hileman, et al., 2013; Dray et al., 2010; Sgouridis et al., 2011). 9 To stimulate investments in new technology, the ICAO Committee on Environmental Protection (CAEP) established a standard for aircraft CO2 emissions (ICAO, 2016). CAEP recommends CO2 emission standards for new aircraft designs as of 2020, as well as deliveries of in-production models by 2023. CAEP also recommends to phase-out aircraft that do not meet the new standards by 2028 (ICAO, 2016). 10 ICAO developed a global Market Based Measure (CORSIA) designed to offset emissions exceeding the 2020 level (Amizadeh et al., 2016). SEO AMSTERDAM ECONOMICS
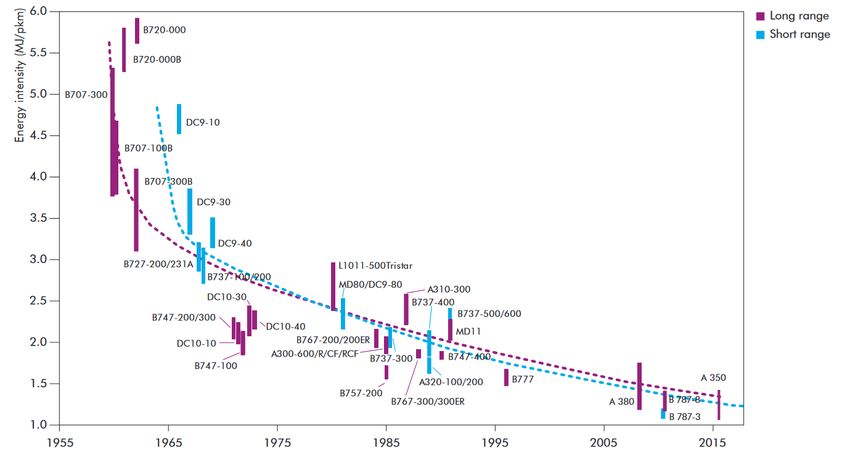
4 CHAPTER 2

2.1 Literature review

2.1.1 Technological measures

More fuel-efficient aircraft
Fuel is one of the major cost components for airlines. These costs act as a continuous incentive to
reduce fuel consumption and CO2-emissions. The recent rise in the price of ETS-allowances acts
as another incentive to reduce fuel consumption and CO2-emissions. In their quest to reduce fuel
consumption and emissions, airlines demand from the aircraft manufacturers to develop ever more
efficient aircraft. Of the estimated $20 billion spent each year on research by aircraft and engine
manufacturers, 70% is used for measures that improve fuel efficiency (ATAG, 2014).

Figure 2.1 shows the extent to which jet aircraft have become more efficient since the 1960s. Since
the 1960s fuel consumption per passenger kilometer has been reduced by 70% (Peeters and Middel,
2007; ATAG, 2014). The efficiency of aircraft has steadily and substantially improved through
more fuel-efficient engines, better aerodynamics and more lightweight materials (Graham et al.
2014; Cansino and Roman, 2017; Schäfer et al., 2016).

Figure 2.1 Aircraft are still becoming more fuel-efficient

Note: Range for specific aircraft types reflect varying configurations. Dots show estimated trends for short-
 and long-range aircraft types
Source: International Energy Agency, 2009

Although the pace of efficiency improvements is slower than in the 1960s, aircraft are still
becoming more efficient. According to Müller et al. (2018), technological improvements, such as
geared turbofan and the use of composite materials allow for emission savings of up to 15%
compared to previous aircraft generations. It is essential to consider that aircraft have a technical
lifespan exceeding 20 years, meaning that different generation of aircraft will be operated alongside
each other. The table below indicates that savings differ per aircraft type and range between 10-
25%, whereby the largest savings are achieved when a new aircraft replaces a relatively old models.

SEO AMSTERDAM ECONOMICS
AIRLINE MEASURES TO IMPROVE EFFICIENCY 5

Table 2.1 New generation aircraft are 10-25% more fuel efficient than the models they replace
 New generation Introduction Previous generation Fuel efficiency improvement
 Airbus A320neo 2016 Airbus A320 15-20%
 Airbus A350XWB 2014 Airbus A340 25%
 Boeing 737MAX 2017 Boeing 737NG 14%
 Boeing 777X 2020 Boeing 777-300ER 13%
 Boeing 787 2011 Boeing 767 20%
 Embraer E190 2005 Fokker 100 10%
 Airbus A220 2016 Embraer E190 20%

Sources: Airbus (2016, 2019), Lufthansa Group (2019), Boeing (2019a, 2019b, 2019c), Thomas (2008).

The efficiency improvements for the Airbus A320neo and Boeing 737MAX are confirmed by the
econometric models developed by Rosskopf (2013). His models show that the Airbus A320neo
and A321neo are 15-16% more fuel efficient than their predecessors. The Boeing 737MAX appears
8-13% more fuel efficient than the 737-300, depending on flight distance (see Figure 2.2).

Figure 2.2 Fuel savings of new generation narrow body aircraft compared to previous generations

 25,000
 Airbus A320
 Airbus A320neo
 Airbus A321-200
 20,000
 Airbus A321-200neo
 Fuel consumption (kgs)

 15%
 Boeing 737-300
 Boeing 737-8MAX
 15,000 8-13%
 15-16%

 10,000

 5,000

 0
 1,000

 1,500

 2,000

 2,500

 3,000

 3,500

 4,000

 4,500

 5,000

 5,500
 500

 Flight range (kms)

Source: SEO/To70 based on Yanto and Liem (2018) and Rosskopf (2013)

Based on an analysis for 16 US airlines over the period 1995-2015, Brueckner and Abreu (2017)
found that airline emissions were on average 2.2% lower for every three year reduction in the age
of the fleet. The International Council on Clean Transportation (2015) analyzed the fuel efficiency
of 20 airlines on the transatlantic market. Norwegian Air Shuttle was found to be the most efficient
(with a fuel burn of 40 passenger kilometres per litre). This this was mainly attributable to its young
fleet of Boeing 787 aircraft.

The box below describes specific measures taken by the five largest European airlines over the past
decade as well as intended renewals in upcoming years.

 SEO AMSTERDAM ECONOMICS
6 CHAPTER 2

 Investments by five largest European airlines

 Lufthansa Group
 Since 2011 Lufthansa (2019) has been undergoing a fleet modernization that is expected to be
 finished by 2025. The airline currently operates over 750 aircraft and has 205 aircraft on order;
 the majority of which (149 in total) are A320neo’s and A321neo’s. Their innovative engine
 technology combined with the improved aerodynamics (wingtips/sharklets) reduce fuel
 consumption by 15% to 20% per seat kilometer, depending on the cabin configuration.
 Furthermore, Lufthansa replaces its Airbus A340s with A350-900s which are one of the most
 fuel efficient aircraft currently available. The four-engined Boeing 747-400s are replaced by the
 much more fuel efficient two-engined Boeing 777-9X. The fleet renewal program is expected to
 reduce Lufthansa’s fuel consumption by 25%. In 2017, Lufthansa reduced its fuel consumption
 by 4.5 percent to 3.68 liters per 100 passenger kilometers.

 Ryanair
 Due to its young fleet (6.5 years on average), high load factors and efficient aircraft, Ryanair
 (2019) was found to be the most efficient in terms of fuel efficiency in 2011 (measured in pounds
 of CO2 per passenger mile) by Brighter Planet in its Air Travel Carbon and Energy Efficiency
 Report. The fuel burn for a Ryanair aircraft is 1.9 liters per 100 passenger kilometers. Ryanair
 commits to further reduce its fuel consumption and emissions. It does so by (among other
 things), by renewing its fleet of Boeing 737-800’s with Boeing 737MAX-8’s. Ryanair (2018)
 expects that the ordered aircraft with new engines and winglets, slim line seats and aerodynamic
 improvements reduce fuel consumption by 16%.

 IAG
 By the end of 2017, IAG’s (2019a) fleet was composed of 546 aircraft (72% Airbus aircraft, 24%
 Boeing and 4% Embraer). IAG is expecting 179 future deliveries and has 198 aircraft purchase
 options of the mentioned aircraft models. These consist mainly of new generation aircraft such
 as the Airbus A320neo, A350 and Boeing 787 Dreamliner. In 2017, 13 new aircraft joined the
 fleet which were at least 20% more efficient than the models they replaced (IAG, 2019b).
 Together with the installation of Honeywell’s GoDirect Fuel Efficiency software this improved
 IAG’s carbon efficiency by 2.6% in 2017.
 By 2022, 37 new generation aircraft will enter the long-haul fleet. These aircraft are
 approximately 30 per cent more fuel efficient than the Boeing 747s that they replace. In addition,
 half of the Airbus A319s fleet is replaced by larger Airbus A320/A321neos, reducing fuel
 consumption and emissions per seat.

 Air France-KLM
 In 2017, Air France-KLM (2018) replaced three Airbus A340s by four new Boeing 787-9s and
 of three old generation A320s by two new Airbus A320s with sharklets. KLM added 10 B787-9
 aircraft and two new B777-300 to its fleet and retired four Boeing 747-400s. HOP! replaced
 three ATR42/72-500s by one ATR72-600. Transavia France received four new B737-800 and
 KLM Cityhopper retired the last 11 Fokker 70s and replaced them with eight new Embraer
 175s. Since 2011, Air France-KLM reduced its fuel consumption by 11% to 3.30 liters per 100
 passenger kilometers.

SEO AMSTERDAM ECONOMICS
AIRLINE MEASURES TO IMPROVE EFFICIENCY 7

 easyJet
 easyJet (2019) has started to replace its fleet of Airbus A319 and A320 aircraft with larger and
 more fuel efficient A320neo’s and A321neo’s. easyJet expects that its new aircraft with new
 engines and wingtip ‘Sharklets’ are 15% more fuel efficient than its current aircraft. By the end
 of 2022, the airline expects to operate 100 of such new generation aircraft. The new aircraft are
 expected to be 15% more fuel efficient than current generation aircraft. Budd and Suau-Sanchez
 (2016) showed that the A320neo is as fuel efficient as the smaller A319, which means that fuel
 consumption and CO2 emissions per seat are reduced.
 Furthermore, easyJet continues to use operational measures to reduce fuel usage and carbon
 emissions. These measures include the use of one engine taxiing, installation of lightweight
 Recaro seats, and the use of electronic devices. In 2017, easyJet reduced its carbon emissions
 per passenger kilometer by 1.7% (from 79.98 grams to 78.62 grams per passenger kilometre).
 The airline aims to reduce emissions by 10% in 2022 compared to 2016 levels.

It is expected that the trend of efficiency-gains will continue. Aircraft engines can become even
more fuel-efficient by increasing temperatures and pressures11 and applying open rotor designs.
Much of the current efforts by aircraft manufacturers to reduce fuel consumption focus on weight
reduction, by applying new materials and composites. Over the longer-term, improving
aerodynamics will be the most effective way of reducing fuel consumption. The International
Energy Agency (2009) predicts that improved aerodynamics and weight reductions could both
reduce fuel consumption by 20-30% in the 2010-2030 timeframe. This constitutes a fuel efficiency
improvement of 0.9-1.3% per year.

Retrofitting new technologies
New technologies can also be retrofitted to in-service aircraft. According to Müller et al. (2018)
low-cost carriers and network carriers can reduce their emissions by 7-12% until 2025 by
retrofitting their aircraft with blended winglets, reducing aircraft weight, installing electric taxiing
systems and re-engining. This corresponds to estimations by IATA (2013a) which expects that
retrofits may reduce fuel consumption by 5-12%.

Winglets / sharklets
In-service aircraft can be retrofitted with blended winglets and wingtip extensions to reduce drag.
Blended winglets are angled extensions installed to the wingtip of aircraft to reduce drag over the
wingtip. This yields fuel savings in the order of 1-2%. Adding small ribs to the wing surface to
reduce turbulence could improve fuel consumption by another 1-2%. Whether this is sufficient for
airlines to retrofit aircraft depends on the aircraft’s age, as well as the price of fuel and ETS-
allowances.

Boeing made winglets available as of 2001 for regional jets and the 737-800. Although the winglets
increase the weight of the aircraft, the aerodynamic improvements results in a net reduction in fuel
consumption of 2-4% for a Boeing 737-800 depending on the flight distance (Aviation Partners
Boeing, 2017; Freitag and Schulze, 2009).

11 Increased engine pressure and temperature may however lead to increases in NOx emissions.

 SEO AMSTERDAM ECONOMICS
8 CHAPTER 2

Airbus introduced blended winglets under the name ‘sharklets’ in 2012 with the introduction of
the A320ceo (current engine option). Compared to the original A320 the winglets reduced fuel
consumption by 1% for flight distances of around 1,000 kilometres and 3.5% for distances over
6,500 kilometres (Cansino and Román, 2017). Airbus offers the sharklets as retrofits for the A319
and A320.

Electric taxiing
Taxi operations are the largest source of emissions in an LTO-cycle around airports (Nikoleris et
al., 2011). Taxiing accounts for over 10% of total fuel consumption for very short-haul flights (up
to 200 miles) and over 5% for short-haul flights (up to 600 miles) (Turgut et al., 2014).

Instead of using the aircraft’s main engines to taxi around the airport, aircraft can be fitted with
electric taxiing systems. These consist of electric motors powered by the auxiliary power unit (APU)
to move the aircraft around airports. The APU uses less fuel during taxiing than the main engines.
However, the system does add weight to the aircraft, therefore it is only efficient for short- to
medium-haul aircraft. The net reduction in fuel consumption is estimated at 2.8% per flight cycle
(Schäfer et al., 2016).

Re-engining
Existing aircraft can be equipped with newer more fuel efficient engines. The options are however
limited as the new engines need to be of the same model. Retrofitting older aircraft types with new
engine types, such as geared turbofans which offer fuel savings of of around 10-15% per flight
(Jesse et al., 2012; Schäfer et al., 2016) is possibly not feasible as it requires major rework on the
aircraft itself.

Weight reductions in the cabin
The weight of aircraft can not only be reduced by using light weight (composite) materials, but also
by weight reductions in the cabin. Lighter trolleys, slim line seats and the replacement of paper
manuals by tablets reduce weight and therefore emissions. According to Ryanair (2018), the
installation of slim line seats alone reduces fuel consumption by 1%. This corresponds to reports
by Flightglobal (2014) and Schäfer et al. (2016) indicating that a reduction in seat weight of one-
third, would reduce fuel consumption by 1.25%. Airlines can also stimulate passengers to ‘travel
lighter’ by implementing stricter baggage rules.

Information technology
Additionally, advances in information technology may reduce fuel consumption. IAG for instance
installed Honeywell’s GoDirect Fuel Efficiency software across its fleet to optimize fuel
consumption by analyzing flight data and monitoring efficiency initiatives across the fleet. Air
France-KLM implemented a Fuel Saving Plan which focuses on fuel policies, fuel standards,
accurate planning information, route optimization, and weight reduction.

2.1.2 Operational measures
Airlines also reduce fuel consumption and emissions by taking operational measures. These include
optimizing load factors, reducing cruise speeds, making optimal use of winds, electric and single-
engine taxiing and the uptake of biofuels (Linke et al., 2017; Niklaß, 2017).

SEO AMSTERDAM ECONOMICS
AIRLINE MEASURES TO IMPROVE EFFICIENCY 9

Although higher load factors increase the weight of an aircraft (Brueckner and Abreu, 2017), fuel
consumption per passenger kilometre will reduce. Between 2007 and 2017, the average industry
passenger load factor increased from 76.3% to 81.5% (IATA, 2018b). Load factors of intra-EEA
flights improved even more over the same period, from 72.7% to 81.5% (Eurostat, 2018). Low-
cost carriers achieve even higher load factors. Ryanair (2018) for instance increased its load factor
from 83% to 94% over the past four years, which resulted in a 12% reduction in per passenger
emissions (2.9% per year).

Figure 2.3 Load factors increased more within the EEA than globally, contributing to fuel efficiency

 84%

 82%

 80%

 78%
 Load factor

 76%

 74%

 72%

 70%

 68%
 Worldwide intra-EEA
 66%
 2007 2008 2009 2010 2011 2012 2013 2014 2015 2016 2017

Source: SEO/To70 analysis based on Eurostat and IATA (2018b)

2.1.3 Fuel efficiency
Multiple studies have analyzed the development of aviation’s fuel efficiency. Findings differ due to
differences in (1) time periods analyzed, (2) regions and traffic segments included in the analysis
and (3) metrics used (fuel consumption per ASK, RPK or FTK). ATAG (2018) found that global
fuel efficiency improved by 2.1% per year over the 2009-2016 period. The European Environment
Agency (2017) showed that average CO2 emissions per passenger kilometer (RPK) in Europe were
reduced by 18% over the 2000-2014 period. This constitutes an average reduction of 1.4% per
year. To put this achievement in perspective, road transport reduced its CO2 emissions by 10%
over the same period or 0.8% per year. Amizadeh et al. (2016) estimated the reduction in CO2
emissions for passenger and cargo traffic over the 2010-2013 period. For the EU they found that
emissions per ton kilometer were reduced by 1.2%. Amizadeh et al. (2016) and Cui and Li (2016)
found that fuel efficiency among European airlines improved more than the industry average.

Larsson et al. (2018) analyzed fuel aviation emissions in Sweden over the 1990-2014 period and
found that average emissions (CO2 and other emissions per passenger kilometer) were reduced by
1.9% per year around half of which (0.84%) was realized by achieving higher load factors. The
remainder (1.1%) was realized by technological and ATM improvements. Developments in fuel
efficiency

 SEO AMSTERDAM ECONOMICS
10 CHAPTER 2

2.2 Analysis
This section quantifies to what extent technical and operational measures have reduce the
environmental impact of intra-EEA flights over the 2015-2017 period. It presents the
improvement in fuel-efficiency and the resulting fuel and emission savings. Section 2.2.1 describes
the methodology used. The findings are presented in section 2.2.2.

2.2.1 Methodology
First, we determine to what extent fuel efficiency has improved over the past decade due to
investments in new aircraft technology and more efficient airline operations (higher load factors).
Fuel efficiency is defined as: fuel consumption per passenger kilometer. A 1% improvement in fuel
efficiency means that fuel consumption per passenger kilometer is reduced by 1%. As CO2-
emissions are directly related to fuel consumption,12 a 1% reduction in fuel consumption (and
hence a 1% improvement in fuel efficiency) translates into a 1% reduction in CO2-emissions.
Second, we determine to what extent technical and operational measures have led to fuel and
emission savings for intra-EEA flights over the 2015-2017 period.

Step 1: Measuring the improvement in fuel efficiency
Fuel efficiency is estimated for all scheduled passenger flights over the 2007-2017 period. Flight
information, such as frequency, seats, aircraft types operated and flight distances are sourced from
OAG’s Schedule Analyzer. This flight information is input to our in-house aircraft emissions
model. The model calculates for each aircraft operation the emissions in the various flight phases:
Landing/Take-off (LTO), climb, cruise and descent. Fuel consumption for specific aircraft types
is sourced from Eurocontrol’s Base of Aircraft Data (BADA) for the climb, cruise and descent
phases (Eurocontrol, 2017a).13 BADA does not provide data for all aircraft types in operation, but
recommends which types to use as synonyms. Fuel consumption in the LTO phase is taken from
ICAO’s Engine Emissions Databank (EASA, 2018). This databank contains fuel consumption data
for individual engine types in the LTO phase. To each aircraft type we attach a common engine
type based on the Eurocontrol ANP database. The analysis shows how fuel consumption per seat
kilometer has developed over the past decade, indicating to what extent technological measures
have improved fuel efficiency.

Second, we factor in the added contribution of higher load factors by calculating fuel consumption
per passenger kilometer. Seat kilometers are translated into passenger kilometers by using load
factor data. For intra-EEA flights we use load factors extracted from Eurostat. For other flights
we use the global load factors published by IATA corrected for the intra-EEA flights.

12 Burning 1 kilogram of kerosene generates 3.15 kilograms of CO2 (Eurocontrol, 2018e; Larsson et al., 2018).
13 BADA is used extensively in (scientific) research to estimate fuel consumption and emissions in the Climb-
 Cruise-Descent phase. Wasiuk et al. (2015) used the BADA model to estimate global fuel consumption
 and NOx emissions over the 2005-2011 period. Schaefer (2012) used BADA to simulate flight trajectories
 and predict fuel consumption and emissions. Lee et al. (2005) used BADA to derive aircraft and distance
 specific cruise altitudes. Simone et al. (2013) developed a BADA based methodology to calculate aircraft
 performance and emissions. Pagoni and Psarako-Kalouptsidi (2017) used BADA to estimate fuel
 consumption and CO2-emissions. BADA was also used to assess the impact of operational measures and
 to compute fuel consumption when actual flight data records are available (Pagoni and Psaraki-Kalouptsidi,
 2017). According to Saucier et al. (2017) the latest version of BADA produces realistic fuel-flow predictions
 for the entire flight envelope.

SEO AMSTERDAM ECONOMICS
AIRLINE MEASURES TO IMPROVE EFFICIENCY 11

Flights over very short distances are relatively inefficient in terms of fuel consumption as they
spend little or no time in the cruise phase. Over the 2007-2017 period the average length of intra-
EEA flights has increased from around 900 to almost 1,100 kilometers. We control for this increase
in flight distance to obtain the true contributions of new aircraft technology and higher load factors
on fuel efficiency. This is achieved by assuming the same distribution of flights over specific
distance ranges in 2007 as in 2017. Finally, we determine the fuel efficiency improvement realized
over the 2007-2017 period by comparing fuel consumption per passenger kilometer in 2007 to that
in 2017.

Step 2: Calculating fuel and emission savings
We use the improvements in fuel efficiency to calculate how much fuel and CO2 has been saved
within the EEA over the 2015-2017 period through technical and operational measures taken by
airlines. First, we calculate the fuel consumption over this period as described above. Next, we
correct for increases in flight frequencies and changes to the composition of traffic for a fair
comparison. This means estimating how much fuel would have been consumed over the 2015-
2017 period when fuel efficiency had not changed since the beginning of 2015. Finally, we compare
the actual fuel consumption in each year with the fuel consumption if no technological and
operational measures had been takes since the beginning of 2015, to obtain the fuel savings over
this period.

2.2.2 Results

Fuel efficiency
Figure 2.4 shows that the average fuel efficiency of intra-EEA flights improved by 21% between
2007 and 2017 (1.9% annually). Technological and operational measures both contributed to higher
fuel efficiency. Technological measures led to an efficiency improvement of 10%. The remaining
11% can be ascribed to an increase in load factors. These findings correspond to the findings by
Larsson et al. (2018) (see section 2.1). Fuel efficiency improvements realized by the A4E member
airlines14 were similar to the industry average.

14 For an overview of the A4E member airlines we refer to Appendix D.

 SEO AMSTERDAM ECONOMICS
12 CHAPTER 2

Figure 2.4 Average fuel efficiency of intra-EEA flights improved by 21% between 2007 and 2017

 25%
 Technological Operational (load factors)
 Fuel efficiency improvement

 20%

 15%

 10%

 5%

 0%
 All airlines A4E members All airlines A4E members
 Intra-EEA Worldwide

Source: SEO/To70 Analysis based on OAG Airline Schedules, IATA (2017, 2018b) and Eurostat

Fuel efficiency improvements within the EEA were almost twice as high as the global average
(12%). This confirms the findings of Amizadeh et al. (2016) and Cui and Li (2016) (see section 2.1).
The fuel efficiency of the A4E member airlines also improved more on intra-EEA flights than on
extra-EEA flights. However, their efficiency improvements on extra-EEA flights still outpaced the
global average.

This may be explained by the fact that global load factors were already on a higher level in 2007.
In 2007 global load factors were already at a higher level than the intra-EEA load. This means that
less improvement in load factors was possible globally. As mentioned above (see Figure 2.3) load
factors on intra-EEA flights improved more than the global average over this period, which (partly)
explains why fuel efficiency improvements within the EEA were larger than globally. As load factor
improvements are finite, the contribution of higher load factors to fuel efficiency is likely to decline
in the future (Larsson et al., 2018).

Environmental impact
Figure 2.5 shows the fuel and emissions savings through technical and operational measures taken
by airlines for intra-EEA flights in the 2015-2017 period (compared to 2014). As airlines
continuously improve technological and operational measures, the fuel and emissions savings
increase year by year. The cumulative fuel savings over the 2015-2017 amount to 3.9 Mt
(Megatonnes)15, translating into over 12.2 Mt of CO2. This corresponds to the fuel consumption
and emissions of around 1 million commercial passenger flights per year or two months of flying
within the EEA.

15 One Megaton equals 1,000 kilotonnes or 1,000,000 tonnes.

SEO AMSTERDAM ECONOMICS
You can also read