ENVISION - FRONT COVER - DES SITES DU LESIA
←
→
Page content transcription
If your browser does not render page correctly, please read the page content below
EnVision – Front Cover

ESA M5 proposal - downloaded from ArXiV.org
Proposal Name: EnVision
Lead Proposer: Richard Ghail

Core Team members
 Richard Ghail                                       Jörn Helbert
 Radar Systems Engineering                           Thermal Infrared Mapping
 Civil and Environmental Engineering,                Institute for Planetary Research,
 Imperial College London, United Kingdom             DLR, Germany
 Lorenzo Bruzzone                                    Thomas Widemann
 Subsurface Sounding                                 Ultraviolet, Visible and Infrared Spectroscopy
 Remote Sensing Laboratory,                          LESIA, Observatoire de Paris,
 University of Trento, Italy                         France
 Philippa Mason                                      Colin Wilson
 Surface Processes                                   Atmospheric Science
 Earth Science and Engineering,                      Atmospheric Physics,
 Imperial College London, United Kingdom             University of Oxford, United Kingdom
 Caroline Dumoulin                                   Ann Carine Vandaele
 Interior Dynamics                                   Spectroscopy and Solar Occultation
 Laboratoire de Planétologie et Géodynamique Belgian Institute for Space Aeronomy,
 de Nantes,                                  Belgium
 France
 Pascal Rosenblatt                           Emmanuel Marcq
 Spin Dynamics                                       Volcanic Gas Retrievals
 Royal Observatory of Belgium                        LATMOS, Université de Versailles Saint-
 Brussels, Belgium                                   Quentin, France

 Robbie Herrick                                      Louis-Jerome Burtz
 StereoSAR                                           Outreach and Systems Engineering
 Geophysical Institute,                              ISAE-Supaero
 University of Alaska, Fairbanks, United States      Toulouse, France

   EnVision                                                                              Page 1 of 43
                               ESA M5 proposal - downloaded from ArXiV.org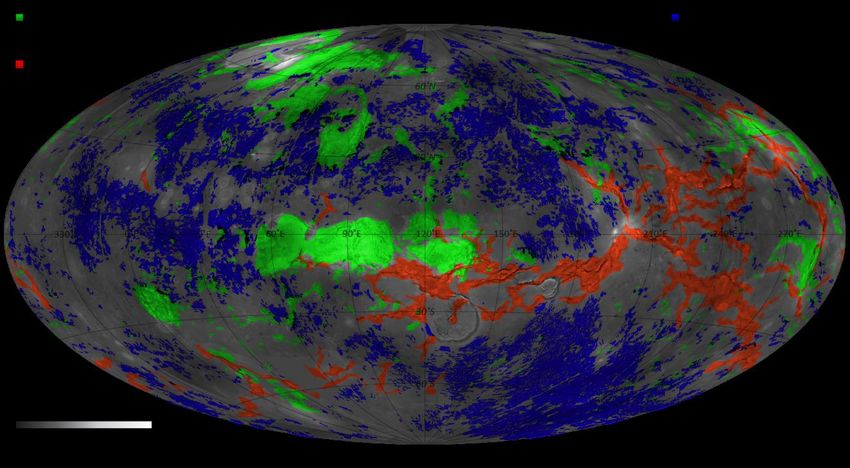
Executive Summary
Why are the terrestrial planets so different? Venus should be the most Earth-like of all our planetary
neighbours: its size, bulk composition and distance from the Sun are very similar to those of Earth. Its
original atmosphere was probably similar to that of early Earth, with abundant water that would have
been liquid under the young sun’s fainter output. Even today, with its global cloud cover, the surface of
Venus receives less solar energy than does Earth, so why did a moderate climate ensue here but a
catastrophic runaway greenhouse on Venus? How and why did it all go wrong for Venus? What lessons
can be learned about the life story of terrestrial planets in general, in this era of discovery of Earth-like
exoplanets? Were the radically different evolutionary paths of Earth and Venus driven solely by
distance from the Sun, or do internal dynamics, geological activity, volcanic outgassing and weathering
also play an important part?
ESA’s Venus Express a landmark in Venus exploration, answered many questions about our nearest
planetary neighbour and established European leadership in Venus research. Focussed on atmospheric
research, Venus Express nonetheless discovered tantalising hints of current volcanic activity including
a tenfold changes in mesospheric sulphur dioxide, anomalously dark lava surrounding volcanoes, and
surface temperature changes that all point towards activity which had not been expected from NASA’s
Magellan mission of the early 1990s. That mission showed that Venus has abundant volcanic and
tectonic features but did not have the resolution or technology necessary to detect geological activity.
We therefore propose EnVision, a medium class mission to determine the nature and current state of
geological activity on Venus, and its relationship with the atmosphere, to understand how Venus and
Earth could have evolved so differently. EnVision will use a world-leading European phased array
synthetic aperture radar, VenSAR, to:
      Obtain images at a range of spatial resolutions from 30 m regional coverage to 1 m images of
      selected areas; an improvement of two orders of magnitude on Magellan images;
      Measure topography at 15 m resolution vertical and 60 m spatially from stereo and InSAR data;
      Detect cm-scale change through differential InSAR, to characterise volcanic and tectonic activity,
      and estimate rates of weathering and surface alteration; and
      Characterise of surface mechanical properties and weathering through multi-polar radar data.
Its RIME-heritage subsurface radar sounder, SRS, will:
      Characterise the vertical structure and stratigraphy of geological units including volcanic flows;
      Determine the depths of weathering and aeolian deposits; and
      Discover as yet unknown structures buried below the surface.
VEM, an IR mapper and an IR and UV spectrometer suite, will:
       Search for temporal variations in surface temperatures and tropospheric concentrations of
      volcanically emitted gases, indicative of volcanic eruptions; and
       Study surface-atmosphere interactions and weathering by mapping surface emissivity and
      tropospheric gas abundances.
EnVision will also take advantage of its low circular orbit to:
      Provide gravity and geoid data at a geologically-meaningful scale, and
      Measure the spin rate and spin axis variations, to constrain interior structure.
VenSAR, the S-band phased array antenna, has heritage from NovaSAR and Sentinel-1 and is funded
by the UK Space Agency and ESA. SRS, derived from RIME on board JUICE, has heritage from
MARSIS and SHARAD and is funded by the Italian Space Agency. The Venus Emissivity Mapper,
VEM, operating in the infrared, builds on the success of VIRTIS and VMC on Venus Express and has

    EnVision                                                                              Page 3 of 43
                                  ESA M5 proposal - downloaded from ArXiV.org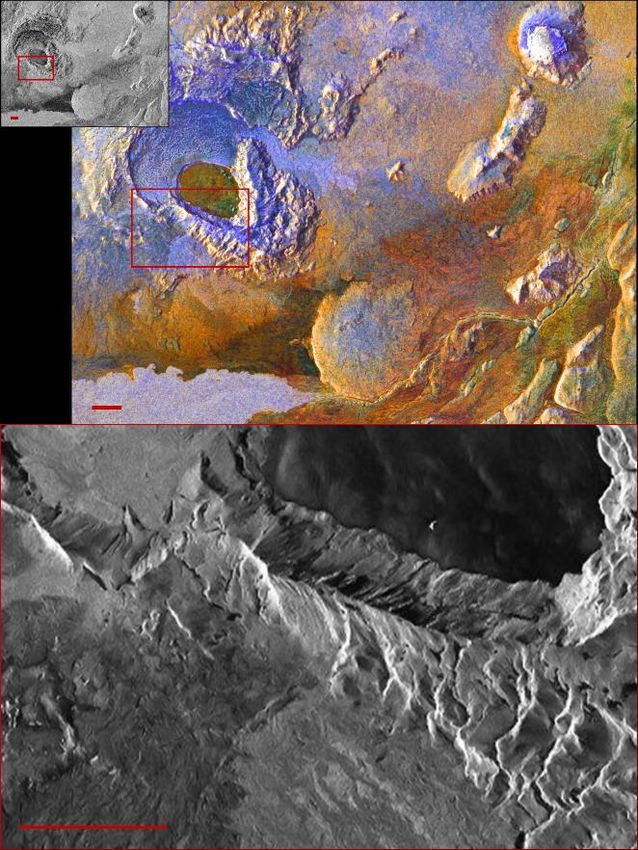
heritage from SOIR, NOMAD, and MERTIS. It is funded by a consortium of the German, French, and
Belgian Space Agencies.
The proposed baseline mission is ESA-only, with science payloads funded by ESA member states as
outlined above; no hardware contribution from international partners is required. Envision is launched
on an Ariane 6.2 with a nominal launch date of 24 October 2029. Following a brief 5-month cruise, the
spacecraft will perform a Venus Orbit Insertion manoeuvre using conventional propulsion to enter a
capture orbit with a 50 000 km apoapsis. An approximately 6 month aerobraking period lowers the
apoapsis to 259 km, with chemical propulsion again used to raise the periapsis into the final circular
259 km altitude science orbit. Sufficient fuel is retained to maintain this orbit within a ~100 m corridor
for a 4 year, 6 Cycle science mission (1 Cycle = 1 Venus sidereal day of 243 Earth days) from 8
November 2030 to 5 November 2034.
Addressing the issues raised in the EnVision M4 proposal debrief, the mission is focussed on achieving
the science goals rather than global coverage; the proposed spacecraft is simplified, with a fixed 3 m
X/Ka-band antenna, a dedicated cold face, and fewer deployable mechanisms; and reduced operational
complexity and data volume. All science investigations are carried out in the nadir direction, with the
spacecraft rolled by up to 35° during SAR operations.
In conclusion, the EnVision mission takes advantage of Europe’s world-leading position in both Venus
research and in interferometric radar to propose a mission which will address universally relevant
questions about the evolution and habitability of terrestrial planets. In doing so, it will provide a range
of global image, topographic, and subsurface data at a resolution rivalling those available from Earth
and Mars, inspiring the public imagination and the next generation of European scientists and engineers.

    EnVision                                                                             Page 4 of 43
                                 ESA M5 proposal - downloaded from ArXiV.org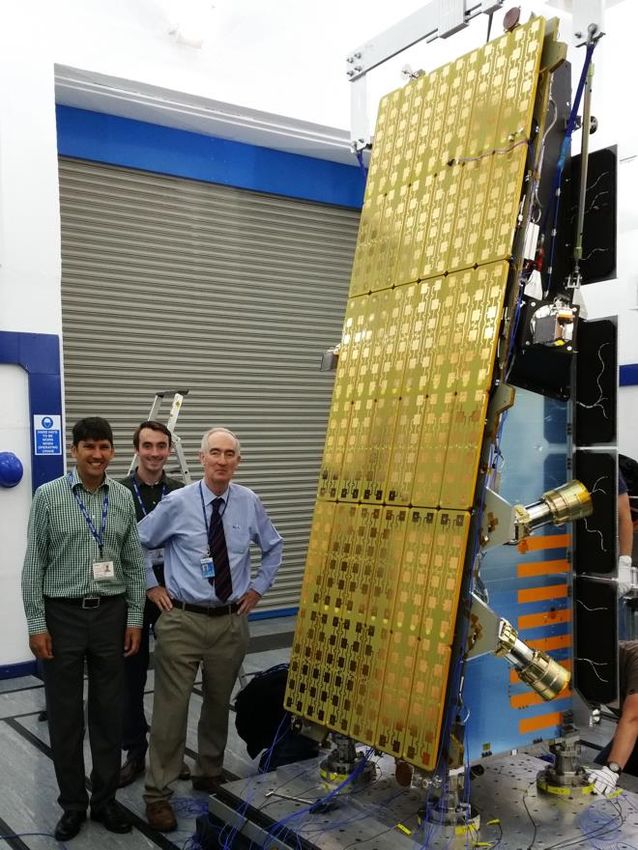
1. EnVision Science Goals                                 decades, revealed a far more dynamic and active
  New discoveries of Earth-sized planets in orbit         planet than expected, uncovering tantalising
  around other stars stimulates the need to better        evidence for present day volcanic activity that
  understand the planets orbiting our own Sun,            demands further investigation. Nonetheless, the
  particularly those closest and most similar to          enigma remains: how can a geologically active
  Earth. In terms of the parameters associated with       surface be reconciled with the global stasis
  life, Venus is profoundly alien and Mars the            inferred from the apparently random impact
  more benign planet, but in geological terms, and        crater distribution? The key goals for EnVision
  in the parameters currently accessible for              are to:
  characterising exoplanets, Venus is the most
                                                                 Determine the level and nature of current
  Earth-like planet in the Solar System. Early Mars
                                                                 geological activity;
  may have had limited favourable conditions for
  life but at one tenth the mass, it was unable to               Determine the sequence of geological
  sustain its early benign environment. Being so                 events that generated its range of surface
  similar to Earth, Venus may also have had a                    features;
  habitable past, possibly even sustaining a living              Assess whether Venus once had oceans or
  biosphere. So why has Venus not turned out                     was hospitable for life; and
  more like Earth?                                               Understand the organising geodynamic
  This question is tied to our general                           framework that controls the release of
  understanding of the universe and lies at the                  internal heat over the history of the planet.
  heart of the Cosmic Vision questions:                   With its unparalleled European instrument and
                                                          technology heritage in surface change detection
        What are the conditions for planet
                                                          and monitoring, EnVision will revolutionise our
        formation and the emergence of life?
                                                          understanding of Venus and enable us to
        How does the Solar System work?                   understand why our closest neighbour is so
  Surprisingly little is known about our nearest          different.
  planetary neighbour, not even the basic sequence
                                                          Observations from Magellan data imply a
  and timing of events that formed its dominant
                                                          variety of age relationships and long-term
  surface features. NASA's 1989-1994 Magellan
                                                          activity32,39, with at least some activity in the
  mission provided a global image of the surface
                                                          recent past56,120,135. There is a non-random
  at 100 – 200 m resolution, comparable in
                                                          distribution of topography (the highs particularly
  coverage and resolution to that of Mars after the
                                                          are semi-linear features) and an association
  Viking missions in the 1970s. Magellan revealed
                                                          between geological features and elevation, such
  an enigma: a relatively young surface, rich in
                                                          that the uplands are consistently more deformed
  apparent geological activity, but with a crater
                                                          than the lowlands. The distribution of impact
  distribution indistinguishable from random
                                                          craters is not strictly random either24,68,120, with
  (Figure 1). The initial conclusion was that a
                                                          recent observations about the degree of crater
  global catastrophe half a billion years ago had
                                                          alteration72 permitting a wider range of possible
  resurfaced the planet: Venus was solved. After
                                                          recent geological activity24,64,66,78,140.
  Viking, Mars was similarly thought to be
  understood, with everything known that needs to         Steep slopes and landslides are very common on
  be known. Two decades later, Pathfinder                 Venus, implying active uplift, but existing data
  reignited public and scientific enthusiasm in           provide no constraint on current rates of tectonic
  Mars and since then newer and higher resolution         activity. The surface of Venus is not organised
  data from MGS, MRO and Mars Express have                into large plates like Earth’s oceans but it is
  revolutionised our understanding of current and         partitioned into areas of low strain bounded by
  past processes alike.                                   narrow margins of high strain, analogous to
                                                          continental basins and microplates. Are these
  ESA’s 2006-2014 Venus Express, the most
                                                          regions actively created and destroyed, like
  successful mission to Venus in the last two

      EnVision                                                                             Page 5 of 43
                                  ESA M5 proposal - downloaded from ArXiV.org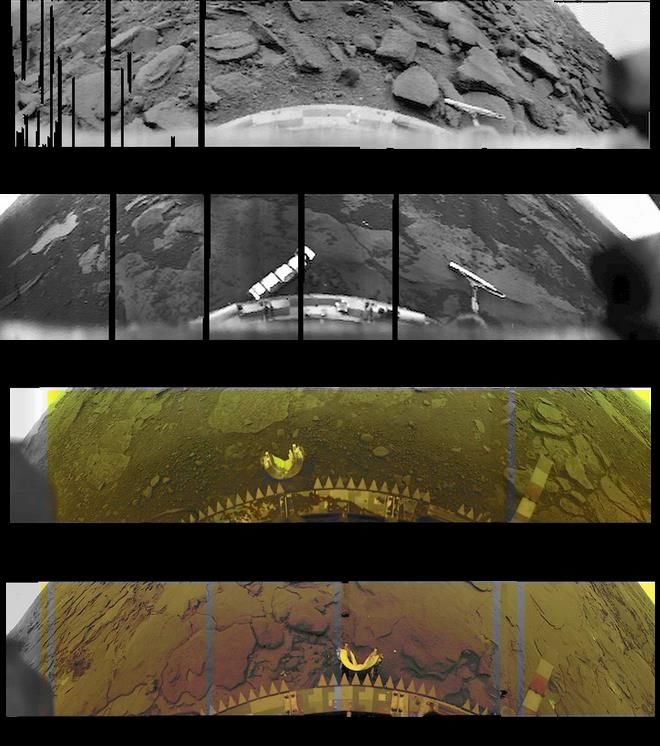
Earth’s oceans, or simply mobilised locally? 500 km across, with a range of associated
What is the significance of the global network of volcanic features. Are coronae the surface
elevated rift systems (Figure 3), similar in extent expression of plumes or magmatic intrusions?
to mid-ocean ridges but very different in What role do they play in global tectonic and
appearance? Unique to Venus are coronae, volcanic change?
quasi-circular tectonic features, typically 100–
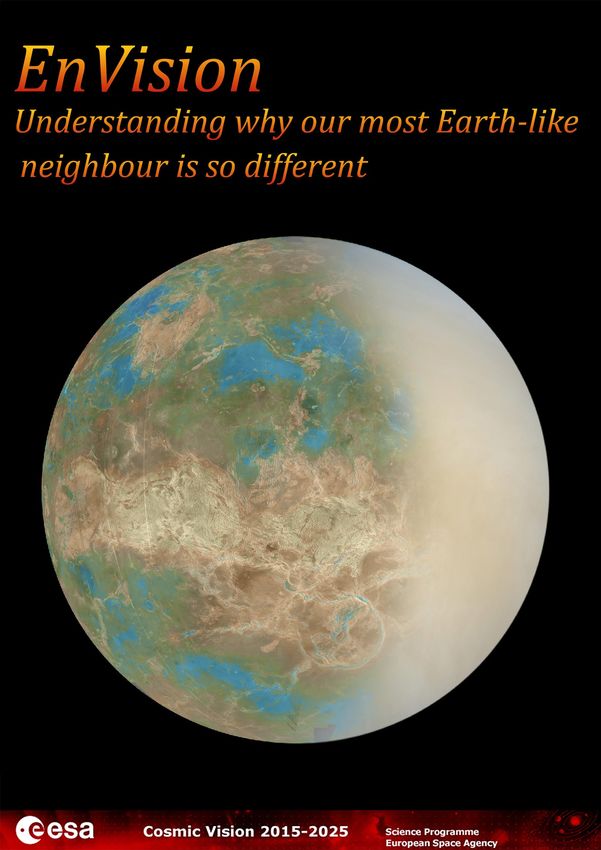
Figure 1 Global Crater Distribution
That the spatial distribution of impact craters is indistinguishable from a random is a puzzle because
no other features on Venus occur at random. Underlying colour map shows surface materials: pink –
loose sediment; brown – sedimentary or weathered rock; green – volcanic rock; cyan – low permittivity
materials.
Recent and perhaps ongoing volcanic activity Figure 2 Thermal anomalies on Venus
has been inferred in both Venus Express95,131,136
and Magellan18 data (Figure 2). Maintenance of
the clouds requires a constant input of H₂O and
SO₂22 which equates to a magma effusion rate of
only 0·5 km a⁻¹, assuming a saturated magma
source.
However, only one significant volatile-rich
pyroclastic flow deposit, Scathach Fluctus60, has
been identified to date, and the morphology of
most larger volcanoes is consistent with low
Left: Magellan thermal anomalies calculated in
volatile eruptions. The actual magmatic rate is
Bereghinia Planitia, calculated from microwave
likely far higher, ~10 km a⁻¹, about one third emissivity data18. Right: Maps of relative
Earth’s62. thermal infrared flux from the surface from
Constraining volcanic activity is critical to Venus Express orbits 793, 795, 906 in Ganiki
understanding when and how Venus was Chasma131.
resurfaced, but it is also important to constrain Are there other large pyroclastic eruptions or is
the nature of that activity. Scathach Fluctus unique? Are canali or other
EnVision Page 6 of 43
ESA M5 proposal - downloaded from ArXiV.org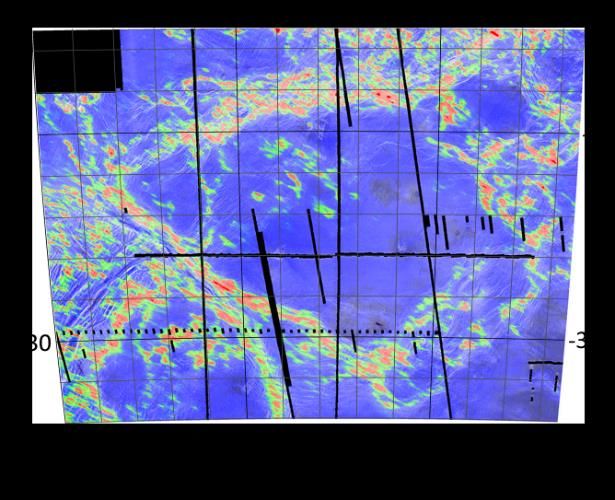
specific magmatic features confined to a past formed from a few massive outpourings in a
regime or still active today? Is there a correlation short period of time or from many thousands of
between mesospheric SO₂ concentration and small flows over their entire history? Or were
volcanic activity? Are crater floors effusively they formed, or modified, in an entirely different
infilled and buried from below? Were the plains way?
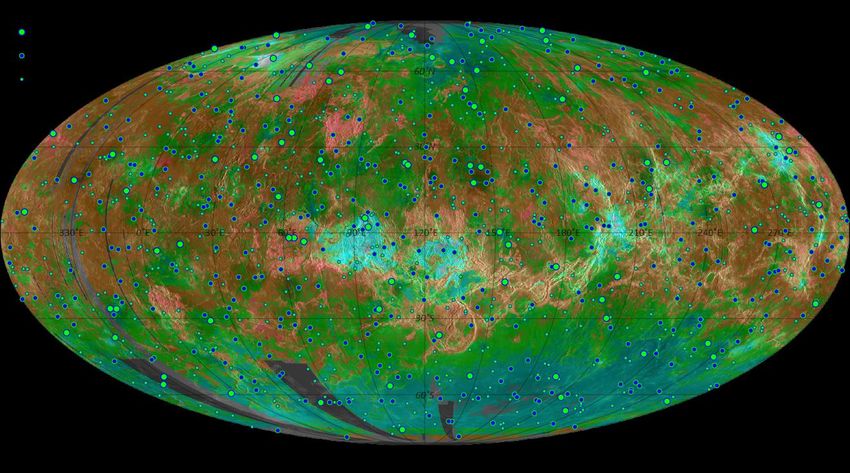
Figure 3 Volcanic and Tectonic Features
Rifts follow topographic rises along great circle arcs, similar to Earth’s mid-ocean ridges; wrinkle ridges
are predominantly in the lowlands. Tesserae are highly deformed terrain across a range of elevation,
and are possibly continental crust.
The slow moving dense lower atmosphere of pyroclastic bedding47, formed by cycles of air
Venus creates a sedimentary environment fall or ground flow. Based on load carrying
similar to the deep oceans on Earth, so that dunes capacities derived from the penetrometer and
and other aeolian features are rarely large dynamic loads during lander impact96,143, the
enough to be visible in Magellan images. strength of the surface at the Venera 13 site is
Understanding modern sedimentary processes is similar to that of a dense sand or weak rock.
key to distinguishing whether ancient deposits
At the Venera 14 and Vega 2 sites the recorded
formed under similar conditions or under more
strengths are higher but similar to that of a
benign water oceans.
sedimentary sandstone and less than half that of
Surface images captured by Soviet Venera an average basalt.
landers (Figure 4) reveal a landscape more
A major problem is that almost the entire area
consistent with pyroclastic or sedimentary
imaged by each Venera lander sits within a
deposits, not the basaltic lava flows widely
single Magellan SAR (Synthetic Aperture
assumed to cover the plains. The bedrock
Radar) pixel, and their landing position is known
recorded at the Venera 10, 13 and 14 sites
to only ~150 km, so that it is impossible to
consists of laminated or thinly bedded sheets
correlate features observed in the lander images
with varying degrees of coarse sediment or
with those in Magellan images. Do the lander
regolith.
images represent a surface weathering veneer on
Although chemically similar to basalts, the otherwise intact lava flows, or thick
layering is more similar to sedimentary or
EnVision Page 7 of 43
ESA M5 proposal - downloaded from ArXiV.org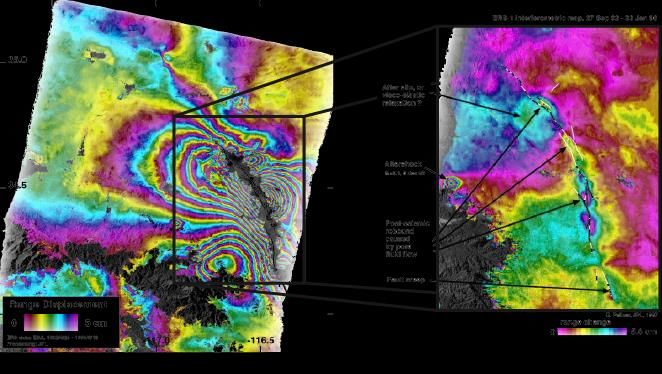
accumulations    of    aeolian   or   pyroclastic        comparable with Earth109. Magellan gravity data
deposits?                                                are consistent with an organised pattern of
                                                         mantle convection broadly similar to Earth but
Figure 4        Venera Landing Sites                     lack the resolution necessary to understand its
                                                         connection with geological-scale features, such
                                                         as individual coronae or mountain belts. Does
                                                         mantle convection drive geological activity at
                                                         the present day or is the surface the relic of a past
                                                         global catastrophe? Does the rotation rate of
                                                         Venus vary periodically or at random? What
                                                         does its cause reveal about the interior structure
                                                         of the planet?

                                                         Figure 5              Spin Rate Variability

Venera 9 landed on a talus slope of about 30˚;
Veneras 10, 13 and 14 landing on rolling plains
with varying amounts of loose sediment and
plate-like bedrock96. Reprocessed lander image           Venus apparently rotated more quickly during
data © Don P. Mitchell, used with permission.            the period of the Magellan mission (small red
Nothing is known about the internal properties           error bars, 1990-1992) than it did in the first
of Venus: it is less dense than expected if it had       Earth-based observations (green) or in later
Earth’s bulk composition but its moment of               measurements from Earth and by Venus Express
inertia, the most powerful way to constrain the          (blue). Vertical bars indicate measurement
first order radial structure of a planet, is             uncertainty, horizontal bars the period over
unknown. Indeed, the shape of the planet                 which the measurement was made.
appears to be unconnected to its rotational rate,        EnVision is designed to answer all these diverse
which is too small to explain the observed               questions using a simple but complementary
flattening, but strangely has been shown to vary         suite of instruments: VenSAR, a 3·2 GHz
(Figure 5) by more than 7 minutes in                     phased array synthetic aperture radar; SRS, a
observations throughout the last 40 years82,106.         16 MHz subsurface radar sounder; and VEM, a
The cause of this variability, and whether it is         Venus Emission Mapper comprising VEM-M
periodic or random, is unknown. The tidal Love           (infrared emissivity mapper), VEM-H (high
number, estimated from Doppler tracking of               spectral resolution infrared spectrometer), and
Magellan and Pioneer Venus Orbiter spacecraft            VEM-U (ultraviolet spectrometer). The
data, indicates that Venus’s core may be at least        spacecraft’s telemetry systems comprise an
partly liquid87 but its size is unconstrained. The       additional instrument for the purposes of
Venera landers returned a number of K, U and             gravity-field determination and occultation
Th measurements that imply bulk ratios, and              studies.
hence internal radiogenic heating rates,

    EnVision                                                                                 Page 8 of 43
                                 ESA M5 proposal - downloaded from ArXiV.org
2. Science Requirements                                   like that provided by Magellan but rather, a
  The three key science goals are related to              detailed and comprehensive assessment of a
  processes operating at different spatial and            representative subset of these features.
  temporal scales and hence EnVision requires a
                                                          Geological processes operate at all scales, as
  complementary suite of observations to address
                                                          recognised in conventional mapping99 (Table 1).
  them. In detail, the processes of interest are
                                                          This hierarchy differentiates processes that
  global-scale processes operating over the
                                                          operate at, and affect, features at the different
  lifetime of the planet that sustain regional
                                                          scales indicated, and requires a resolution at least
  tectonic and volcanic processes operating over
                                                          2-3 times finer to discriminate these features.
  the observable geological history. The nature of
                                                          The Zonal-scale 100–200 m resolution of
  these processes and whether they occur
                                                          Magellan imagery enables mapping of the global
  episodically or in a steady-state is keenly
                                                          distribution of volcanoes, for example, but not
  debated; to distinguish between them requires a
                                                          their age relationships, which would require
  better understanding of how global processes
                                                          Reconnaissance-scale imaging to reveal the
  drive individual features, such as volcanoes,
                                                          cross-cutting relationships between different
  rifts, and mountains, and the proportion of these
                                                          flows.
  features that are active at the present day.
  Achieving this requires not a global overview
    Table 1       EnVision Mapping Hierarchy
                     Global     Zonal                 Reconnaissance            Exploration        Locality
      Coverage        >95%                >95%                     >20%                 >2%              >0·2%
      Unit Area      Global    2500 × 2500 km          1500 × 1500 km           100 × 100 km          5 × 5 km
     Resolution       50 km              150 m                     30 m                  6m                   1m
   Feature Size 150 km               500 m                        100 m                 20 m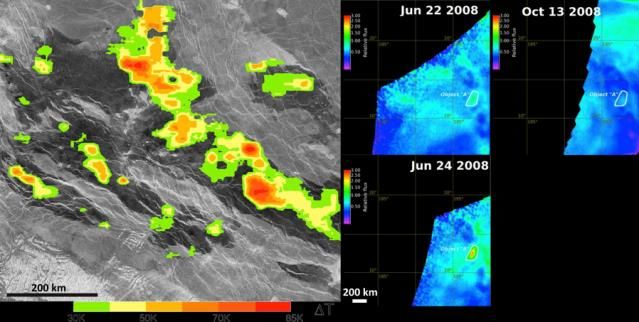
Before discussing how this is accomplished, this          Venus sidereal day = 243·02 days) are required
 section expands on the detailed science                   to determine any periodic effect in the rotation
 requirements of the mission, on the basis of              rate. In addition to precise orbit determination,
 which EnVision’s instruments were selected.               EnVision will achieve these measurements by
                                                           tracking the locations of at least four Venera
2.1.        Global Scale Dynamics                          landers twice per cycle using high resolution
 Venus rotates so slowly (its sidereal day is 243          SAR images and obtaining the orientation of the
 days long and is commonly called a Cycle) that            polar spin axis from repeated interferometric
 its flattening is unrelated to rotation and its rate      SAR (InSAR) images of both polar regions.
 of precession too slow to estimate its moment of          Interferometric measurement of polar axis was
 inertia. However, Doppler tracking of Magellan            demonstrated by Magellan (Figure 10), with an
 and Pioneer Venus Orbiter spacecraft was                  uncertainty below 15 arcsec (Goldstein, pers.
 sufficient to estimate its tidal Love Number              comm.). From these measurements the
 (k₂ = 0·295 ± 0·066), which indicates an at least         amplitude of the nutation can be determined,
 partly liquid core87. Cosmochemical models11,105          which with the gravity coefficient may be used
 suggest core mass fractions between 23·6 and              to infer the moment of inertia. In addition, orbit
 32·0% — implying a mantle mass                            reconstruction might also place constraints on
 proportionately similar to or greater than                the length of day measurements, as it has for
 Earth’s. The Venera landers returned a number             Mars86,88.
 of K, U and Th measurements that imply bulk
 ratios, and hence internal radiogenic heating             Linking the global interior dynamics to
                                                           lithospheric processes and structure is the
 rates, comparable with Earth109. Estimation of
 the maximum amplitude of the radial                       relationship between topography and gravity.
 displacement induced by the solar tides with an           Depending on the mode of topography
                                                           compensation, the gravity and the topography
 accuracy better than 2 cm over half a Venus solar
 day (58·4 days), together with the time lag of the        signals exhibit higher or lower admittance and
 bulge with an accuracy on the order of 1 hour,            correlation. Magellan tracking data used to
 would       discriminate     between      different       construct the current gravity field model were
 compositional models, as well as providing                obtained during Cycle 4, from a highly elliptical
 average mantle temperature and viscosity.                 orbit (170 × 14 500 km), and during Cycles 5
 Reducing the uncertainty in k₂ to ± 0·01 would            and 6 when the orbit had been circularised to
 also distinguish between these compositional              197 × 541 km. Since the local resolution
 models and constrain the thermal state of                 depends primarily on altitude and data can only
                                                           be obtained when the spacecraft is transmitting
 Venus42.
                                                           with line-of-sight to Earth, the degree strength
 Many values of the mean rotation of Venus have            varies from degree 100 to as low as degree 40,
 been estimated since 1975 from which the length           equivalent to a spatial resolution varying from
 of day has been shown to vary by more than 9              190 km to 475 km. Low degrees of the gravity
 minutes. Analysis of several mechanisms that              field correspond mainly to large-scale internal
 can induce oscillations in the rotation rate,             dynamics while intermediate degrees (up to at
 including triaxial coupling, tidal deformation,           least 80) are sensitive to lithospheric structure
 atmospheric coupling and core/mantle coupling,            and compensation processes5,114. The existing
 found that the instantaneous rotation rate could          gravity field resolution is consequently too low
 vary by as much as 3 minutes35, principally from          to study lithospheric structure and compensation
 triaxial coupling. This value corresponds to a            processes of many features of interest, including
 variation in the longitude of a reference point by        the potentially active hot spot identified in
 12 m at the surface within a Venus solar day              Venus Express VIRTIS data, and smaller-scale
 (116·8 days)82. Repeated determination of the             structures such as coronae. These 300~500
 rotation rate and orientation of the spin axis37 at       diameter features are probably caused by small-
 least several times each Cycle (1 Cycle = 1               scale mantle upwelling and/or intrusions within

     EnVision                                                                            Page 10 of 43
                                   ESA M5 proposal - downloaded from ArXiV.org
the lithosphere. To understand such structures a ~800 km average crater spacing, and so likely spatial resolution of
distinguish regionally-important geological               primary factor in loss of coherence but are long
  formations and relationships, at a standard scale         wavelength features (at least 50 km) that can be
2.2.1. Radar Mapping                                        corrected for40. Surface changes causing
  Differential InSAR (DInSAR)98 is the only tool            coherence loss are usually smaller in scale and
  capable of measuring geological-scale strains             geographically distinct, often in the form of
                                                            channels and lobate downslope mass
  from orbit and is particularly effective across
  high strain rate terrane margins, in which LoS            movements129. Canali are river-like channels
  displacements may be 10 mm a⁻¹ or more.                   thought to be formed by carbonatite or sulphur-
                                                            rich volcanic flows83,85,152 or sedimentary density
  Combining LoS displacements derived from D-
  InSAR sets in ascending and descending                    currents150; coherence data will distinguish
  (opposite look) orbits allows the vertical and at         between these possibilities from their pattern of
                                                            coherence loss. Mass wasting49 and landslides
  least one of the horizontal components of
  displacement to be isolated73,155. Two                    are common on Venus92 and may contribute to a
  complementary methods13,44 are commonly used              small but global supply of sediment, revealed in
                                                            Magellan Doppler Centroid data19 and Venera
  to detect displacements as small as 1 mm a⁻¹,
  even in the absence of an earthquake89.                   lander images48. Thus the pattern of coherence
  Combining these techniques with opposite look             loss can reveal other mechanisms of surface
  sets to isolate components of movement means              change in addition to those from tectonic or
  that even the low strain deformation of terrane           volcanic processes.
  interiors is detectable with DInSAR59,97.                 Coherence and DInSAR change detection only
                                                            reveal current rates and styles of activity and not
  Many fracture sets visible in Magellan images
  appear to have formed in response to subsurface           whether these are in a long-term steady state, in
  dykes100,112, which often occur in swarms that            gradual decline, or a lull between episodic global
                                                            resurfacing events. Worse, even steady-state
  radiate in patterns related to the global stress
  state of the lithosphere63. Coronae10 – unique to         processes may appear infrequently and
  Venus – also appear to be the surface expression          episodically on an annual to decadal timescale.
  of subsurface intrusions or magmatic plumes139            To fully understand the behaviour of the Venus
  and recent research103 suggests that intrusions           lithosphere over time requires geological
  may be more important on Venus than Earth                 mapping to ascertain stratigraphic relationships
  because its weak lower crust7 inhibits                    and hence geological history65. This requires a
  extrusion91. DInSAR is highly effective at                knowledge of the geological materials at a
  detecting magmatic inflation under terrestrial            resolution sufficient to distinguish between
                                                            stratigraphic units.
  volcanoes17,51, even where no volcanic feature is
  evident151, making it the ideal tool to study             Radar is sensitive primarily to the morphology
  magmatic processes associated with terrane                (roughness and slope) and relative permittivity
  margins and interiors. DInSAR may therefore               of the surface materials. Polarimetric data
  reveal whether different rift morphologies and            provide important information about the nature
  corona associations are related to an increased           of the surface and near subsurface that cannot be
  rate of subcrustal stretching and intrusive               obtained solely with backscatter power images,
  magmatism58 or to different rift ages108,135, and         such as those obtained by Magellan. In
  hence illuminating the details of the connections         particular, polarisation ratios can help identify
  between surface features and underlying mantle            the thickness and grainsize of loose surface
  processes.                                                sediment53. Since terrestrial studies show that
  Coherence, a by-product of DInSAR, is also                almost all natural targets have reciprocal cross-
                                                            polarisation (i.e. HV backscatter is identical with
  useful for change detection146: a reduction or loss
  of coherence implies change at the scale of the           VH)145, only HH, VV, and VH (or HV)
  radar wavelength or above. Atmospheric effects,           polarisations are required to characterise the
                                                            backscatter properties. Arecibo data have
  particularly changes in the cloud layers, are the

      EnVision                                                                             Page 12 of 43
                                    ESA M5 proposal - downloaded from ArXiV.org
demonstrated the utility of this at Venus for lower spatial resolution. These two techniques
distinguishing volcanic deposits28, impact can be considered complementary, since steep
ejecta26 and a thin, patchy but widespread slopes prevent InSAR by causing loss of
regolith29 consistent with Venera lander images, coherence, but automated stereo matching is
but these data are at a resolution of 12 to 16 km, most effective in rough terrain; and both can be
too low to discern detailed stratigraphic and derived as a by-product of data acquired for
geological relationships. other purposes.
The relative permittivity (also called the Radar sounding can provide continuous profiles
dielectric constant) of near-surface materials can at a resolution limited only by orbit knowledge
be inferred from their microwave emissivity, and ground track spacing, which in the case of
itself a derivative of the radar brightness EnVision is 10 km at the equator. Operating at a
temperature measured by using the SAR antenna frequency below ~30 MHz has the further
as a radiometer. In this mode the resolution is advantage that the signal penetrates the
dependent on the real antenna size and hence is ground80,130, providing information on
very low, e.g. Magellan emissivity data have a subsurface structures that are crucial to
resolution of ~50 km, but a larger antenna can understanding the history of Venus. The two
reduce this to a few kilometres. For most natural end-member hypotheses, episodic/directional12
materials the relative permittivity depends upon and equilibrium/non-directional64, predict that
density and can be used to distinguish between the plains comprise lava flows that are
areas of loose sediment, weathered rock and predominantly extensive and thick (~100s m), or
exposed fresh rock27. Certain materials, e.g. local and thin (~10s m), respectively. A sounder
metals, have very high relative permittivity in the 9-30 MHz range is able to penetrate to a
which lowers the emissivity, making these crustal depth of 750–340 m respectively and
materials very bright in radar imagery. On image subsurface features at a vertical resolution
Venus, slightly elevated relative permittivity of 5-16 m, more than adequate to distinguish
occur in certain volcanic materials, probably Ti- between these end-member hypotheses, as well
rich basalts60; parabolic ejecta halos may have as providing topographic profiles.
low or moderately elevated relative 2.2.3. Infrared Mapping
23
permittivity ; and very high relative Radar alone cannot distinguish between
permittivities occur at most, but not all25, high different rock compositions. On Mars and other
elevations9,116. The cause of these very high planets, infrared reflectance spectra offer the
relative permittivities is unknown and require most effective way to determine composition
polarimetric data, and observations at different
from orbit. There are spectrally useful night side
wavelengths, to understand their origin. infrared windows at 0·8 to 1·18 μm in the
2.2.2. Subsurface Mapping otherwise opaque Venus atmosphere2,3,36 but
Putting these data together into a geologically- scattering in the global cloud layer limits their
meaningful context requires knowledge of the spatial resolution to ~50 km. Galileo and Venus
third dimension. Topography can be acquired Express data have shown that highland tessera
from orbit in three ways: from radar sounding terranes have lower, and many volcanic
(altimetry); radargrammetry (from stereo pairs provinces higher, infrared emissivities than the
and shading); and from InSAR. The latter is global average67,107, implying compositional
normally a necessary step in the production of differences. More precise measurements are
DInSAR data but while relative shifts of a few required across all the available spectral
mm are readily detectable, absolute elevations windows in order to identify the mineralogical
depend on a number of factors, such as orbit differences between these terranes. Repeated
knowledge, that limit the vertical resolution to imagery of thermal emission from the surface at
~15 m. For typical stereo separations of ~20° 0·8 to 1·18 μm may reveal time variable
and automated matching, radargrammetry signatures characteristic of volcanic activity,
provides a similar vertical resolution but at a following tantalising hints from Venus
EnVision Page 13 of 43
ESA M5 proposal - downloaded from ArXiV.orgExpress131, is useful for establishing current reveal whether Venus supported oceans79 and
levels of volcanic activity on Venus. perhaps, therefore, life, early in its history, or
whether indeed it was hotter128 in the past.
In summary, understanding regional processes
requires a range of complementary observations Large dunes are very rare on Venus, with only
across a representative sample of different two dune fields identified in Magellan imagery,
terrane types, with each survey built up from both related to impact cratering. However,
individual swaths into regions 1500 × 1500 km Venera 13 imaged active wind transport and
across. Where not constrained by natural ripple-like features48; putting these observations
limitations (e.g. cloud scattering) these into a wider context requires imaging of the
observations should be at a resolution able to lander sites at the metre-scale. Correlation with
distinguish regionally important rock units and a variety of other sites across Venus is needed to
their relationships sufficient to understand the understand the nature and importance of aeolian
geological history of each terrane, e.g. flow units processes, the role they play in the exchange of
rather than individual flows. However, volatiles between the atmosphere and interior,
geological processes operate at all scales, and and the stability of geochemical cycles on
geological change is often the result of Venus.
incremental small-scale processes. DInSAR and
There is therefore a need for a detailed survey at
coherence data will show where and when these
the Exploration scale (~6 m resolution), about a
changes occur but to understand them requires
factor of five better than the 30 m resolution
much higher resolution observations.
Reconnaissance surveys, across a representative
2.3. Small-Scale Change selection of features within each terrane. The
Terranes host a variety of discrete features – areas selected should be ~100 km across and
individual lava flows, faults, landslides, etc. – focussed particularly on those areas identified in
the Reconnaissance survey as either active or
that link global processes directly with small-
scale change. The identification of new lava ancient.
flows, particularly smaller flows, places a tight
2.4. Surface-Atmosphere Exchange
constraint on the nature and rate of volcanic
Nowhere is the link between the local scale and
activity90; similarly the number and size of new
global processes more obvious than in the effects
landslides constrains the frequency and scale of
of a single volcanic eruption on global
seismic events92. Understanding processes at the
atmospheric chemistry and climate. These
metre scale is therefore critical to understanding
effects can be significant on Earth but no
global activity and change. Geomorphology at
eruption has been directly observed on Venus.
this scale is essential for understanding
Dramatic shifts in mesospheric SO₂ levels have
processes of mass wasting – landslides and talus
been detected43,94 that may be reflect eruption
slopes – that are indicative of geologically active
events but cannot be distinguished from other
slopes and tectonic activity. Boulder tracks, in
atmospheric processes93 without measurements
particular, can be used to estimate the source and
in the lower atmosphere linked to specific
magnitude of earthquakes124, complementing D-
localities. Maintenance of the clouds also
InSAR data.
requires an input of H₂O22, most likely also from
Highland plateau tesserae may be continental volcanic sources.
terranes with long and complex
To calculate whether a volcanic eruption could
histories32,57,67,125,127. Magellan images show
be detected using infrared sounding from a
hints of stratigraphic layering; unravelling that
satellite, the likely compositional changes that
history requires detailed mapping at the highest
would result can be estimated. The nominal
resolution. Details in layering on scarp slopes
column mass of volcanic gases in the Venus
may reveal the chronology of resurfacing and the
atmosphere, integrated from surface to space, is
nature of past environments, and be usefully
~200 kg m⁻ for SO₂, ~10 kg m⁻ for H₂O and
correlated with subsurface features, helping to
EnVision Page 14 of 43
ESA M5 proposal - downloaded from ArXiV.org~0·1 kg m⁻ for HDO38. If the composition of accuracy of 1% on SO₂ retrievals. Hence the
Venus volcanic gases is the same as on Earth and spectral requirements are:
provided that plume dispersion does not exceed
1·08–1·2 µm at R = 2000 (H₂O, HDO at
10⁴ km , the limiting spatial resolution induced
0–15 km)
by cloud scattering, then a large, Pinatubo-size
eruption would alter the composition in the 2·44–2·47 µm at R = 40 000 (H₂O, HDO,
following way: OCS, SO₂ at 30–40 km)
Linking the lower atmosphere volcanogenic
Increase H₂O by several tens of percent;
volatile variability with the known variations43,94
Decrease D/H ratio by several tens of of cloud top column in SO, SO2 and blue-UV
percent; and absorber leads to the following specifications in
Increase SO₂ by about 1%. the UV range:
The latter effect is probably underestimated with 200-230 nm at 0·3 nm spectral
respect to the others, since the Venusian interior resolution to distinguish SO spectral
is thought to be much drier than Earth's, so that lines from SO276
the outgassed SO₂/H₂O ratio may be much
170-400 nm at 1·5 nm spectral
higher on Venus. Observations of changes in
resolution to fully encompass the UV
lower atmospheric SO₂ and H₂O vapour levels,
absorber signature and provide
cloud level H₂SO₄ droplet concentration, and
(SO+SO2) measurements.
mesospheric SO₂, are therefore required to link
specific volcanic events with past and ongoing 0·1° angular resolution, equivalent to
observations of the variable and dynamic about 300 m at cloud top level.
mesosphere, to understand both the importance For change detection the temporal coverage
of volatiles in volcanic activity on Venus and should be as frequent as possible, ideally once
their effect on cloud maintenance and dynamics. per Cycle, at a spatial resolution of a few
hundred kilometres.
The spectral window at 1·18 μm probes the first
scale height of Venus' atmosphere, which A key goal for the detailed survey mode is to
directly interacts with the surface. The high determine the exact location of the ten Soviet
atmospheric pressure at this level widens automatic landers (Veneras 7–14 and Vegas 1
spectral lines so that a moderate spectral and 2), and possibly the remains of the US
resolution of a few cm⁻¹ between 1·08 and Pioneer Venus Large Probe, within their landing
1·20 μm is sufficient to resolve individual H₂O ellipses, in order to use them as geodetic control
and HDO lines to measure both water vapour points. These probes will appear as very bright
abundance and isotopic ratio. Sensitivity tests points ~25 dB brighter than the surrounding
using the appropriate radiative transfer model16 plains in the detailed surveys.
indicate that a SNR of about ~100 is required. Four of these automatic landers (Veneras 9, 10,
The 2·4 μm spectral window probes higher in 13 and 14) successfully returned images from
the atmosphere, at 30 to 40 km, but gives access the surface of Venus48,49,54 but each panoramic
to additional minor species, including SO₂ in the scene returned covers no more than a few pixels
2·450 to 2·465 μm spectral interval and OCS of Magellan imagery1 and so lack any wider
(carbonyl sulphide) in the 2·440 to 2·465 μm context (
spectral interval. Individual lines need to be Although chemically similar to basalts, the
resolved in order to distinguish between all layering is more similar to sedimentary or
species, requiring a very high spectral resolution pyroclastic bedding47, formed by cycles of air
of more than 40 000 between 2·44 and 2·47 μm. fall or ground flow. Based on load carrying
Sensitivity tests using the radiative transfer capacities derived from the penetrometer and
model for this altitude range119 show that a SNR dynamic loads during lander impact96,143, the
better than a few hundred is required for an
EnVision Page 15 of 43
ESA M5 proposal - downloaded from ArXiV.orgstrength of the surface at the Venera 13 site is distinguish bare rock, loose sediment, boulders,
similar to that of a dense sand or weak rock. and other materials.
At the Venera 14 and Vega 2 sites the recorded Linking radar data to the lander observations in
strengths are higher but similar to that of a this way is extremely useful in understanding
sedimentary sandstone and less than half that of materials at localities elsewhere. A
an average basalt. representative selection of Locality scale
snapshots, each a few kilometres across, from
A major problem is that almost the entire area
within areas imaged at Exploration scale (6 m
imaged by each Venera lander sits within a
resolution), are needed to fully interrogate active
single Magellan SAR (Synthetic Aperture
or ancient sites and features that poorly
Radar) pixel, and their landing position is known
understood, such as farra (pancake domes) and
to only ~150 km, so that it is impossible to
canali.
correlate features observed in the lander images
with those in Magellan images. Do the lander The nested survey approach, using a range of
images represent a surface weathering veneer on complementary observations, has proved highly
otherwise intact lava flows, or thick successful on the Moon and Mars and will
accumulations of aeolian or pyroclastic doubtless transform our understanding of Venus.
deposits? How this is achieved within one mission is the
subject of the next section. In conclusion, the
Figure 4). The panoramas reveal a variety of
geological investigation of Venus requires
surface materials, including loose regolith and
investigations of target regions at different
layered rocks, indicative of weathering and
spatial resolutions and with different types of
sedimentary processes. Understanding the
observations, from imagery and polarimetry to
nature and extent of these surface materials
topography, at a range of scales from 1 m to
requires stereo polarimetric data at the Locality
30 m, to complement Magellan radar maps, and
scale, ~1 m resolution over a few kilometres, to
both infrared and microwave radiometry.
determine local topography and boulders, and
EnVision Page 16 of 43
ESA M5 proposal - downloaded from ArXiV.org3. Proposed Scientific Instruments solid state power amplifiers. This technology
means that VenSAR requires fewer than 1/6th the
3.1. VenSAR number of phase centres that would be needed
The primary instrument carried by EnVision is with Sentinel-1 era GaAs technology and is the
VenSAR, a 5·47 × 0·60 m phased array primary reason for its reduced mass and cost.
synthetic aperture radar (SAR) antenna, The microstrip patch phased array provides a
operating at 3·2 GHz, in the S-band, similar in self-contained front-end by mounting the RF
frequency to Magellan’s SAR. The opacity of electronics on the reverse side of the antenna
the Venus atmosphere at radar wavelengths panel. The VenSAR antenna consists of 24 phase
approximates a frequency squared dependence centres, in a 6 × 4 arrangement of centre-fed sub-
and in a practical sense is opaque above 10 GHz. arrays each of which contains 24 patches. Each
More critically for D-InSAR change detection is sub-array is individually controllable in phase,
the variability in refractive index of the polarisation for transmit (Tx) and receive (Rx)
atmosphere, which causes phase shifts in the functions, and Rx gain, with a beam control unit
transmitted and received radar signal. The to apply transmit and receive phase adjustments.
ionosphere introduces phase shifts that are larger These provide the antenna with considerable
at longer wavelengths. However, the lack of flexibility in the selection of resolution and
magnetic field means that the total electron swath width, within the available 182 MHz
count at Venus is only a few percent of Earth’s, bandwidth, and incidence angles from 20˚ to
varying from ~1·6 TECU on the dayside to more than 45˚.
0·8 TECU at night. The phase shifts are
therefore small and readily corrected for. In normal stripmap SAR operations, the ultimate
spatial resolution along track (azimuth) is
Of greater significance are the phase shifts nominally half the antenna length, ~3 m, while
caused by variability in the concentration of across track (range) it is controlled by the
sulphuric acid droplets in the cloud layer, with available RF bandwidth, which at 182 MHz is
both altitude and latitude, over timescales of 1~2 m, depending on incidence angle.
several hours to a few days. Although the Radiometric resolution increases with the
refractive index is independent of wavelength, number of looks but at the expense of spatial
the phase shifts are not. Based on Magellan radio resolution. A good compromise is ~9 looks154;
occultation data75, these shifts can cause Magellan images were typically only 5–6 looks
significant phase ambiguities at frequencies in the lower latitudes. At high resolution,
above ~5 GHz (C-band), driving the choice therefore, optimal images have 6 looks (2 in
towards lower frequencies. Cycle to Cycle (243 azimuth and 3 in range) and a spatial resolution
day separation) interferometry has been of 6 m, suitable for Exploration scale mapping.
demonstrated with Magellan data71 and SAR resolution is given in the traditional sense
topographic fringes identified in Arecibo data at of a point-spread function and not metres per
the same frequency30. However, lower pixel, as is usually the case for planetary
frequencies are less sensitive to surface cameras; SAR pixels are typically about two-
displacements and hence less able to distinguish thirds the resolution, i.e. 4 m pixels for a 6 m
between the different models of geological resolution image.
activity. A frequency in the S-band of 3·2 GHz
(9·4 cm wavelength) provides a good Operating at the full bandwidth has very high
compromise between these competing factors. power demands (~2 kW at a 20% duty ratio) and
data rates (~900 Mbits s⁻ ) that are not required
VenSAR is based on the NovaSAR-S antenna for standard Reconnaissance mapping. By
technology developed by Airbus Defence and obtaining 9 looks in azimuth, the range
Space, which itself is built on the heritage of resolution can be reduced to ~27 m, ideal for
Sentinel-1 and ENVISAT but incorporating Reconnaissance mapping and requiring only
significant technical advances, particularly the ~15·5 MHz bandwidth, reducing the data rate to
use of mature GaN technology104 high power
EnVision Page 17 of 43
ESA M5 proposal - downloaded from ArXiV.org~65 Mbits s⁻ and the duty ratio to 4% (~600 W). maintenance, and system diagnostics. The
These data have four times the spatial and three calibration scheme is based on the scheme
times the radiometric resolution of Magellan; at developed for ASAR on ENVISAT, with a P1
full resolution the spatial improvement is a path that includes the transmit electronics but
factor of 20, for the same radiometric resolution bypasses the receive electronics, a P2 path that
as Magellan. In spotlight mode the spatial includes the receive electronics but bypasses the
resolution is 120 times Magellan, at about half transmit electronics, and a P3 path that bypasses
the radiometric resolution. both the transmit and the receive electronics. The
3.1.1. VenSAR Design P1 and P2 paths each have an H and a V variant.
The VenSAR design is derived from the
Figure 7 NovaSAR at Airbus,
NovaSAR-S instrument that is currently being Portsmouth
built for the UK Space Agency. NovaSAR-S
comprises two major sub-systems, an active
phased array antenna sub-system (the front-end)
and a central electronics sub-system (the back-
end). In NovaSAR-S the active antenna is
configured from an array of 18 identical phase
centres each comprising a 2 × 2 array of dual
polar, 6-element sub-arrays which are excited by
three distinct equipment units, coupled together
with associated wiring harnesses: a transmit (Tx)
unit capable of delivering 115 W peak RF
power, a single channel low noise amplifier
(LNA), front end receive (Rx) unit, a beam
control unit, and a power conditioning unit34. RF
signal distribution networks deliver signals to
and from the central electronics sub-system
which forms the radar backend. All of these
equipment units and sub-systems have been
designed, tested, qualified, and manufactured,
and are in place on the NovaSAR platform for a
launch currently scheduled for late 2016. Hence
by 2017 their TRL will be at level 8/9.
The VenSAR design takes the fundamental
active phase centre technology (2 × 2 array of The NovaSAR-S phased array consists of 3 × 6
sub-arrays coupled with the associated phase centres (gold panels); VenSAR will
electronics) and configures the active antenna as comprise an array of 6 × 4 phase centres.
an array comprising six columns of four rows of The New Instrument Architecture (NIA) generic
NovaSAR-S phase centres. Thus, the technology space radar central electronics exploits the
of the sub-arrays themselves will be at TRL 9. A power and flexibility of the Xilinx Virtex 5
development programme to bring the physical (XQR5V) Field Programmable Gate Array
structure of the VenSAR antenna to TRL 7 is (FPGA). The XQR5V is the first high
envisaged during the Phase A and B1 so that the performance RAM based FPGA to integrate
antenna stack will be in position to demonstrate effective single event effect mitigation into its
TRL 8 at the end of Phase C/D. core architecture. This has created the
Calibration paths have been included to enable opportunity to develop a truly generic backend
characterisation of the phase centre distortions solution that can easily be applied to a very wide
for replica generation, antenna beam pattern range of space radar missions with minimal non-
EnVision Page 18 of 43
ESA M5 proposal - downloaded from ArXiV.orgrecurring cost in a compact, lightweight and low ratios of more than 20%, they can tolerate a
power module33 and is ideally suited to the transmit duty ratio of up to 30% for short
VenSAR instrument. periods, thus enabling a 1·8 dB improvement in
sensitivity if required, for instance when
Within the front-end, the sub-array radiator
operating in the very high resolution Sliding
assemblies together with the associated passive
Spotlight mode.
transmit and receive feed networks consisting of
passive Wilkinson style splitters interconnected Figure 8 VenSAR Parametric Thermal
with coaxial cables are attached by isostatic Analysis (worst case)
mounting blades to the outer face of a 25 mm
aluminium honeycomb panel.
Table 2 VenSAR mass and power
Component Mass Power
2 × NIA Central Electronics 24·0 kg 51 W
24 × Front-end Electronics 104·7 kg 290 W
24 × Radiator Units 25·1 kg 1874 W†
Antenna Structure 22·1 kg
Total 175·9
†
at 20% duty ratio.
An RF transparent sunshield over the front
surface of the antenna serves to reduce the
temperature excursions seen by the panel. The
RF units are mounted on the inner (satellite) side
of the honeycomb panel and are covered with Parametric model assumes visible albedo
multi-layer insulation to thermally isolate them reflection coating and thermal shielding; modes
from the rest of the spacecraft. and operating durations as given in Table 3.
The science goals require the delivery of D-
The high albedo of Venus means its infrared
InSAR, polarimetry, and stereo data at
temperature is only 228·5 K69, ~30 K cooler than
Reconnaissance (30 m resolution), Exploration
Earth, sufficiently cold for the antenna to radiate
(6 m resolution) and Locality (1 m resolution)
the thermal pulse generated by radar operations
scales, as well as radiometry measurements at
during the remainder of the orbit, even with
the Global scale. Note that InSAR is here used to
reflected solar infrared. Parametric studies
refer to stripmap swaths optimised for repeat-
(Figure 8) show that the limiting constraint on
pass D-InSAR; in the strict sense, the first pass
radar operations is data volume, not the ~310 K
acquires SAR, the second InSAR, and the third
operating thermal limit. VenSAR could operate
D-InSAR.
for 5 minutes at 20% Tx and more than 16
minutes at 4%. The thermal pulse at 20% Tx is VenSAR will acquire these data in five modes:
larger than during aerobraking, when the InSAR (VI1 as standard, VI2 for orbit-to-orbit,
antenna is aligned parallel to the airflow, leading and VI3 for opposite-look), stereo polarimetry
to confidence that antenna will be able to (VP1 StereoPolSAR), all at Reconnaissance
withstand the thermal loads during aerobraking. scale (30 m resolution); Exploration scale
imagery (VH1 HiRes at 6 m resolution);
The estimated total mass of the VenSAR front-
Locality-scale Sliding Spotlight (VS1 Spotlight
end is 152 kg, including margins; the component
at 1 m resolution); and microwave brightness
mass and peak power consumption budgets are
temperature (VR1 Radiometry), as summarised
listed in Table 2. Note that although the radiator
in Table 3 and illustrated in Figure 9.
units are not planned to operate at transmit duty
EnVision Page 19 of 43
ESA M5 proposal - downloaded from ArXiV.orgTable 3 Summary of VenSAR Operating Mode Parameters
Resolution Looks Tx Incidence Sensitivity Swath Duration Data
VI1 InSAR 27 m 18 4% 21° – 31° −21·8 dB 53 km 498 s 66 Mbps
VI2 InSAR 27 m 18 4% 19° – 29° −20·9 dB 53 km 498 s 68 Mbps
VI3 InSAR 27 m 18 4% −21° – −31° −21·8 dB 53 km 498 s 66 Mbps
VP1 StereoPolSAR 30 m 9 4% 37° – 41° −16·9 dB 53 km 873 s 127 Mbps
VH1 HiRes 6m 6 20% 38° – 43° −20·1 dB 22 km 291 s 353 Mbps
VH2 HiRes 6m 6 20% 38° – 43° −20·1 dB 32 km 291 s 513 Mbps
VS1 Spotlight 1m 1 20% 38° – 39° −21·5 dB 5 km 4 s 468 Mbps
VR1 Radiometry 5 × 30 km n/a 0% −4° – +4° ~1 K 38 kmacquisitions enable the two data sets to be and allowing many swaths to be stacked
brought back into coherence55,102. The required coherently. EnVision takes advantage of this to
frequency shifts are on the order of 150 MHz and provide a frequent measure of the orientation of
lie comfortably within the operating spectrum of the polar axis to monitor changes, with VI1
the radar technology. The long spatial baseline imaging the North Pole and VI3 the South Pole.
increases the ratio of the topographic phase The axial precession rate may be resolvable from
signal to atmospheric artefacts and other noise, these data over the lifetime of the mission. To
improving the vertical resolution of the resolve variability in the spin rate and for
topographic model (DEM) produced. Orbit to geodetic control, EnVision will image a
orbit interferometry ensures that this baseline contiguous set of swaths across the equator of
DEM is obtained within the first Cycle of the Venus, connected to the known landing probe
mission. locations (discussed later). From the precise
timing measurements and subpixel alignment
From the second Cycle onwards, EnVision will
accuracy between InSAR pairs, and using the
acquire VI1 and VI3 InSAR on consecutive
lander locations as geodetic control points,
orbits. VI1 will provide left-looking, and VI3
variability in the spin rate can be monitored
right-looking, repeat pass (Cycle-to-Cycle)
throughout the mission.
coverage so that the east-west and vertical
components of ground displacement may be 3.1.3. 30 m Stereo Polarimetric ScanSAR
resolved by comparing the line-of-sight changes VenSAR’s polarimetric ScanSAR mode (Figure
in each D-InSAR stack97. It is not possible to 12) transmits alternating bursts of horizontal and
resolve the north-south component from a polar vertical polarisations, with its single receive
orbit but it can be inferred from the geological channel receiving either H or V polarised
context59. echoes. Combinations of these options allows a
mix of HH, VH, HV and VV polarised images to
Figure 11 Identifying Ground be obtained. However, this burst mode of
Deformation with D-InSAR operation causes gain variations (image
scalloping) and also degrades the image
resolution by a factor of NM + 1, where N is the
number of polarisation states, and M, the number
of looks taken to mitigate scalloping, typically 2.
To reduce the total data volume, only one of the
two cross-polarised images will be acquired so
that the degradation is a factor of 7, enabling a
spatial resolution of 30 m.
The InSAR incidence angle (Table 3) is chosen
Ground deformation can be detected with D- for the optimum phase quality; for polarimetry a
InSAR whether or not an earthquake takes higher incidence angle is favoured for its greater
place. This example from the 1992 Landers sensitivity to surface texture rather than slope.
earthquake in California shows the earthquake Given this, an angular separation of ~20° has
displacements observed with InSAR (left) and been chosen to allow for the derivation of
the changes that occurred after the earthquake topography from stereo pairs.
itself115 (right). Topography from stereo and InSAR are
In addition to geological change detection, complementary, in the sense that the former
InSAR data are required to measure precisely the better in steep, rough topography and the latter
precession of the polar axis (Figure 10) and for better in smooth, gently undulating areas. Both
monitoring the variability in the spin rate. approaches provide for a vertical resolution of
During each InSAR orbit, At the poles the image ~15 m at a spatial resolution of 90~120 m. The
swaths cross over, leading to a small baseline resolution, swath width and coverage of InSAR
EnVision Page 21 of 43
ESA M5 proposal - downloaded from ArXiV.orgYou can also read