Episode 101: Making sense of mutations and variants - Guido Vanham 16 Jan 2021 17/01/2021 - ICPCovid
←
→
Page content transcription
If your browser does not render page correctly, please read the page content below
Episode 101:

             Making sense of mutations and variants

                            Guido Vanham
                             16 Jan 2021

17/01/2021                                            1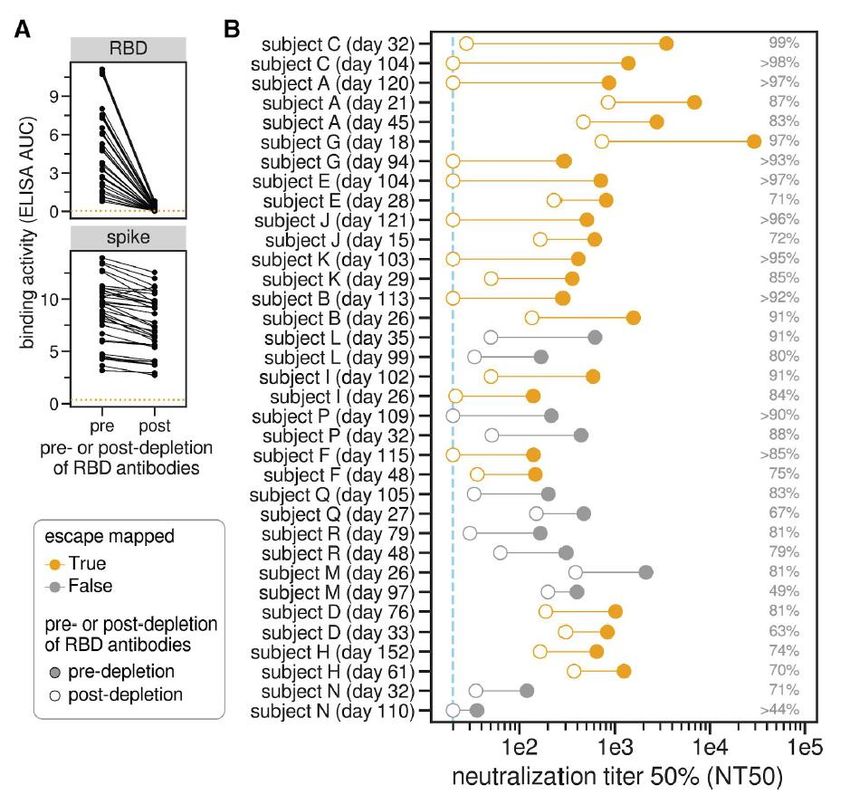
Rising trends of SARS-COV-2 seroprevalence in Kenya (May- Aug 2020)

17/01/2021                                                                                    2
                                                                Kemri Policy Brief Oct 2020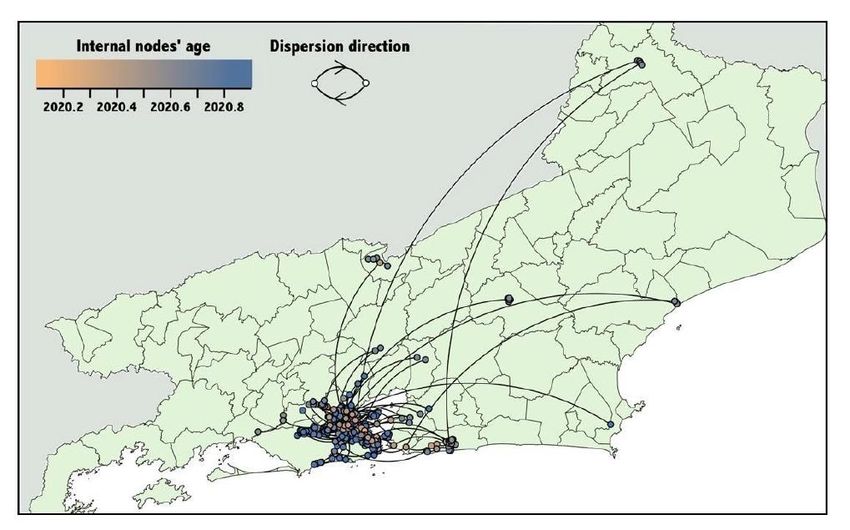
High SARS-COV-2 seroprevalence in Cape Town (July- Aug 2020)

17/01/2021                                                                             3
                                                                Hsiao NICD Sept 2020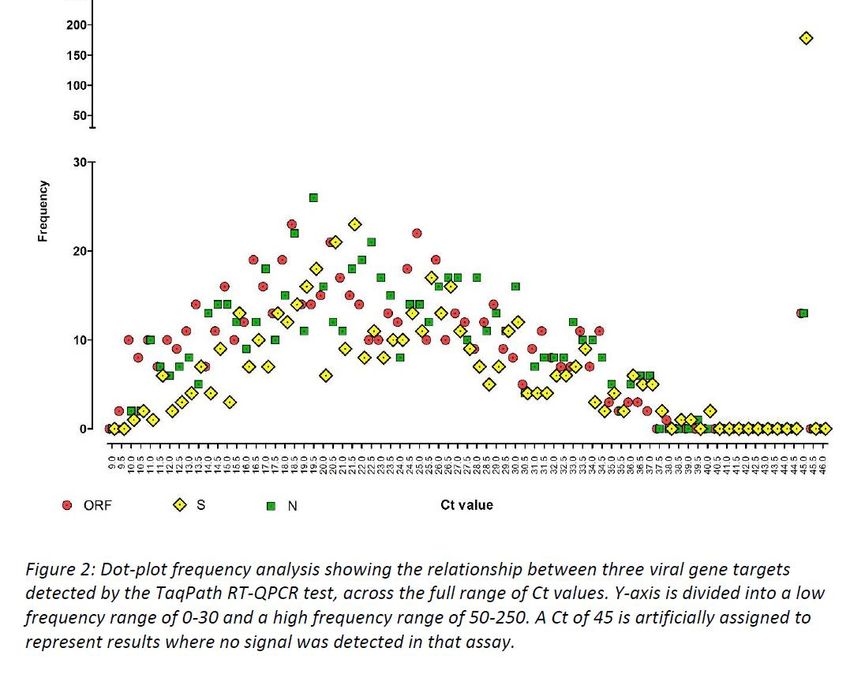
Structure of the SARS-CoV-2 spike receptor-binding domain bound to the ACE2 receptor

a, Overall topology of the SARS-CoV-2 spike monomer. FP, fusion peptide; HR1, heptad repeat 1; HR2, heptad repeat 2; IC, intracellular domain;
NTD, N-terminal domain; SD1, subdomain 1; SD2, subdomain 2; TM, transmembrane region.
b, Sequence and secondary structures of SARS-CoV-2 RBD. The RBM sequence is shown in red.
c, Overall structure of the SARS-CoV-2 RBD bound to ACE2. ACE2 is shown in green. The SARS-CoV-2 RBD core is shown in cyan and RBM in red.
Disulfide bonds in the SARS-CoV-2 RBD are shown as sticks and indicated by arrows. The N-terminal helix of ACE2 responsible for binding is labelled.
  17/01/2021                                                                                                                                    4
                                                                                            Jun Nature March 2020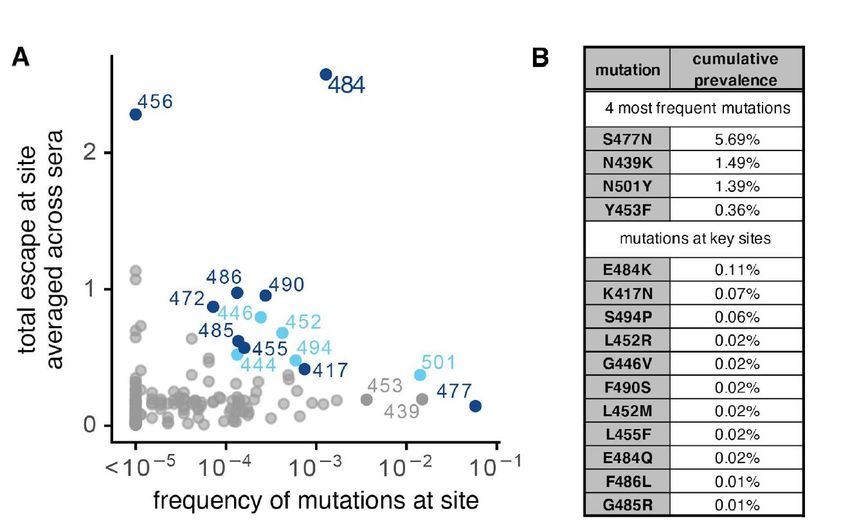
Structure of the SARS-CoV-2 spike receptor-binding domain bound to the ACE2 receptor

The SARS-CoV-2 RBD–ACE2 and SARS-CoV RBD–ACE2 interfaces.
a, Contacting residues are shown as sticks at the SARS-CoV-2 RBD–ACE2 and SARS-CoV RBD–ACE2 interfaces. Positions in both RBDs that are
involved in ACE2 binding are indicated by red labels.
b, Sequence alignment of the SARS-CoV-2 and SARS-CoV RBDs. Contacting residues in the SARS-CoV-2 RBD are indicated by black dots; contacting
residues in the SARS-CoV RBD are indicated by red dots.
  17/01/2021                                                                                                                               5
                                                                                         Jun Nature March 2020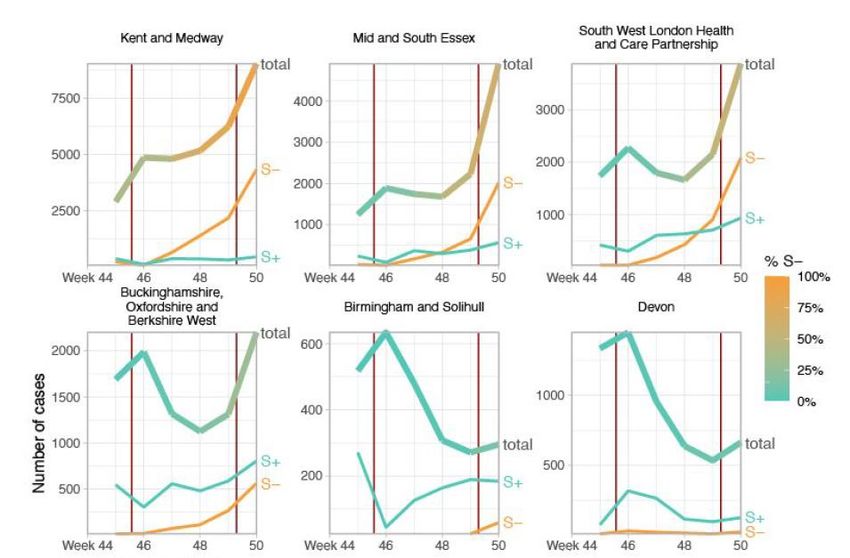
Structure of the SARS-CoV-2 spike receptor-binding domain bound to the ACE2 receptor

 17/01/2021                                                                            6
                                                            Jun Nature March 2020
Mutations to the SARS-CoV-2 receptor-binding domain that affect recognition by polyclonal human serum antibodies

                                                               A)   Change in binding of human sera to RBD and spike before and
                                                                    after depletion of RBD antibodies, measured by ELISA area
                                                                    under the curve (AUC).
                                                               B)   Neutralization titer 50% (NT50) of human sera before and after
                                                                    depletion of RBD-binding antibodies. Legend is at left: filled and
                                                                    open circles are pre- and post-depletion samples, respectively,
                                                                    connected by a line. Orange indicates sera for which we
                                                                    subsequently mapped mutations that reduce binding. The
                                                                    numbers at right indicate the percent of all neutralizing activity
                                                                    attributable to RBD-binding antibodies.

     17/01/2021                                                                                                                 7
                                                                          Greaney bioRxiv Jan 2021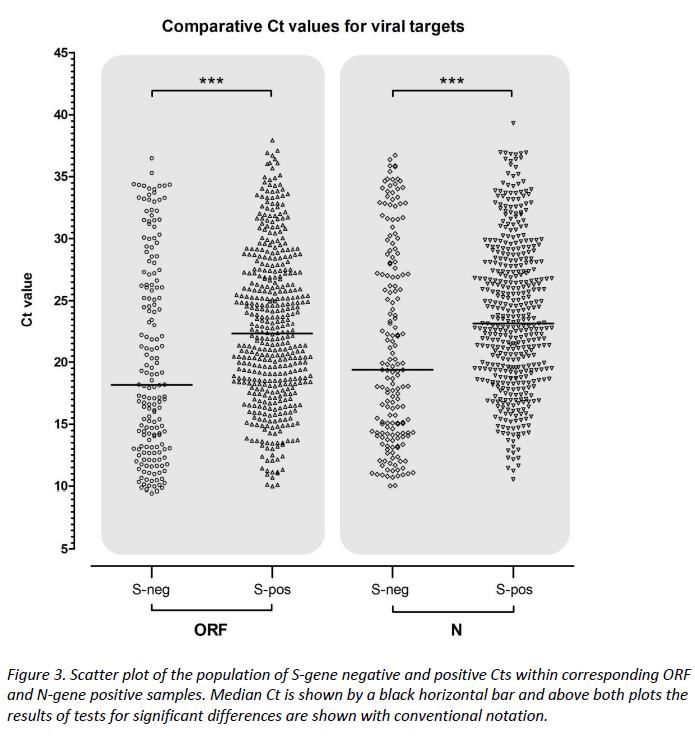
Mutations to the SARS-CoV-2 receptor-binding domain that affect recognition by polyclonal human serum antibodies

Fig 2: Complete maps of RBD mutations that reduce binding by polyclonal serum antibodies from 11 individuals.
(A) The line plots at left indicate the total effect of all mutations at each site in the RBD on serum antibody binding, with larger values indicating a greater reduction
in antibody binding. The logo plots at right zoom in on individual mutations at key sites (indicated by purple highlighting on the x-axis of the line plots). In these logo
plots, the height of each letter is that mutation’s escape fraction, so larger letters indicate mutations that cause a greater reduction in antibody binding. Escape
fractions are comparable across sites within a sample.
(B) For coloring of the logo plots, we designated three RBD epitopes based on the structural locations where mutations had large effects on serum antibody binding.
The images show the structure of the RBD bound to ACE2 (PDB 6M0J, (Lan et al., 2020) ) in several representations. The receptor-binding-ridge epitope is dark blue,
the epitope17/01/2021
             containing the 443–450 loop is cyan, the core-RBD epitope is orange, the rest of the RBD is gray, and ACE2 is purple. For the cartoon rendering8 in the top
structure, alpha carbons for sites of strong binding-escape for any of the 11 sera (i.e., all sites shown in the logo plots) are represented as spheres.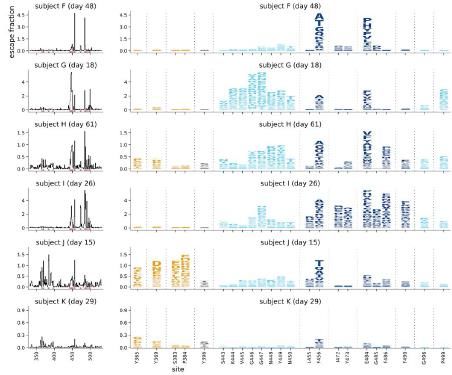
Mutations to the SARS-CoV-2 receptor-binding domain that affect recognition by polyclonal human serum antibodies

Fig 6: Frequencies of mutations that affect serum antibody binding among circulating SARS-CoV-2 isolates.
(A) Effects of mutations at each RBD site on serum antibody binding versus frequency of mutations at each site among all SARS-CoV-2 sequences in
     GISAID as of Dec. 23, 2020. Key sites are labeled and colored according to epitope region as indicated at the right
(B) Cumulative prevalence for the 4 most frequent mutations and also any mutations at sites labeled in (A)
      17/01/2021                                                                                                                                   9
                                                                                              Greaney bioRxiv Jan 2021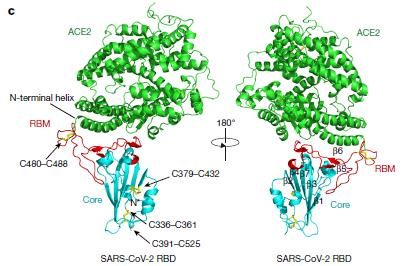
SARS-CoV-2 neutralizing antibody structures inform therapeutic strategies

             Footprint of class 1 Ab            Footprint of class 2 Ab

17/01/2021                                                                     10
                                                    Barnes Nature Oct 2020
Escape from neutralizing antibodies by SARS-CoV-2 spike protein variants
Plasma’s mAbs
17/01/2021 11
Weisblum eLife 2020;9:e61312.Escape from neutralizing antibodies by SARS-CoV-2 spike protein variants
Nearly all of the mutations that are present in the GISAID
database of naturally occurring mutations in the proximity
of the ACE2 binding site and other neutralizing epitopes,
were tested for their ability to confer resistance to the
monoclonal antibodies, using pseudotyped virus-based
neutralization assay.
- Complete or partial resistance to C121 and C144: g
mutations at positions E484, F490, Q493 and S494 =
center of RBD.
- Complete or partial resistance to C135 were at
positions R346, N439, N440, K444, V445 and G446=
peripheral of RBD
17/01/2021 12
Weisblum eLife 2020;9:e61312.SARS-CoV-2 escape in vitro from a highly neutralizing COVID-19 convalescent plasma
(B) The graph shows the PT188 neutralization titer after each mutation acquired by the authentic virus. Specific mutations, fold
decrease and days to which the mutations occur are reported in the figure.
(C) SARS-CoV-2 S-protein gene showing type, position of mutations and frequency of mutations.
17/01/2021 13
Andreano bioRxiv 28 Dec 2020Prospective mapping of viral mutations that escape Ali Lilly or Regeneron mAbs
Figure 3. Antibody escape mutations in circulating SARS-CoV-2. For each antibody or antibody combination, the escape
score for each mutation is plotted versus its frequency among the 180,555 high-quality human-derived SARS-CoV-2
sequences on GISAID database as of November 12, 2020.
17/01/2021 14
Starr bioRxiv Dec 2020Early transmissibility assessment of the N501Y mutant strains of SARS-CoV-2 in the United Kingdom 17/01/2021 Leung Eurosurveillance Dec 2020 15
Early transmissibility assessment of the N501Y mutant strains of SARS-CoV-2 in the United Kingdom

17/01/2021                                                                                          16
                                                           Leung Eurosurveillance Dec 2020
Estimated transmissibility and severity of novel SARS-CoV-2 Variant of Concern 202012/01 in England
Fig. 1. (A) Proportion of VOC 202012/01 in South East, East of England, and London NHS England regions versus the rest of England from 28 September – 1
December 2020 (mean and 95% CI). Grey shaded areas (panels A, C, D) reflect the period of time when England was in a second national lockdown
(B) Proportion of S gene drop-outs (5 –11 December) versus mean reproduction number (27 November – 4 December) by local authority in England. The one-
week lag accounts for delays from infection to test.
17/01/2021 17
Nicholas G. Davies medRxiv 26 Dec 2020Estimated transmissibility and severity of novel SARS-CoV-2 Variant of Concern 202012/01 in England
Fig. 2. Comparison of possible biological mechanisms underlying the rapid spread of VOC 202012/01. Each row shows a different assumed mechanism:
(A) increased transmissibility; (B) immune escape; (C) increased susceptibility among children; (D) shorter generation time.
The panels in each row show the relative frequency of VOC 202012/01 (black line data with 95% confidence interval; purple ribbon shows model fit).
17/01/2021 18
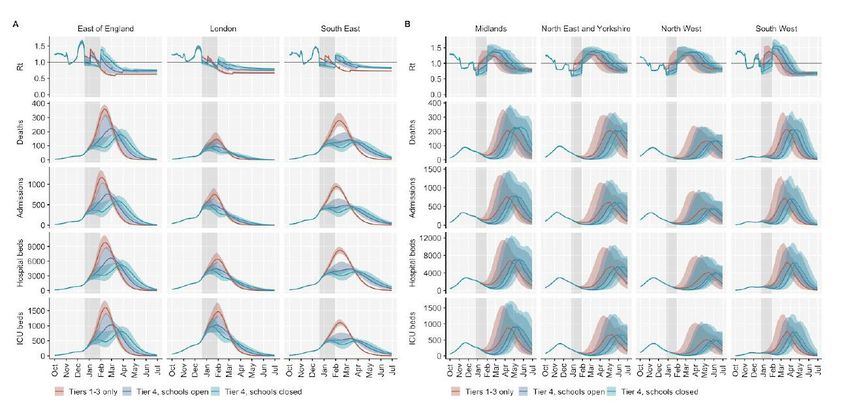
Nicholas G. Davies medRxiv 26 Dec 2020Estimated transmissibility and severity of novel SARS-CoV-2 Variant of Concern 202012/01 in England
Fig. 4. Projections of epidemic dynamics under different control measures, in the absence of widespread vaccination. Results shown for: (A) NHS England
regions with data suggesting extensive spread of VOC 202012/01 (B) regions without data suggesting extensive spread of VOC 202012/01. Grey shaded
areas correspond to the time each region spends under Tier 4 control measures.
17/01/2021 19
Nicholas G. Davies medRxiv 26 Dec 2020British S variant associated with significantly higher viral load in ThermoFisher TaqPath RT-QPCR
17/01/2021 20
Kidd medRxiv 27 Dec 2020B.1.1.7 in England: Insights from linking epidemiological and genetic data
Fig. 1 B. Expansion of the VOC 202012/01 lineage Fig. 2 Case trends in some are for S gene target Fig. 4 Ratio of S- to S+ proportions of cases in
failure (S-), hence VOC, versus non-failures (S+), each 10 year band. Results for weeks 46-51.
hence non-VOC variants
17/01/2021 21
Volz medRxiv 4 January 2021Rapid spread of new variant 501Y.V2 with multiple spike mutations in South Africa
Amino acid changes in the spike region of the 190 S501Y.V2 genomes A complete model of the SARS-CoV-2 Spike (S) trimer is shown, with domains
in this study mapped to the spike protein sequences structure, of a single protomer shown in cartoon view and coloured cyan (N-terminal
indicating key regions, such as the RBD. Each spike protein variant is domain, NTD), yellow (C-terminal domain/receptor binding domain,
shown at their respective protein locations, with the bar lengths CTD/RBD), purple (subdomain 1 and 2, SD1 and SD2), and dark green (S2),
representing the number of genomes harboring the specific mutations while N-acetylglucosamine moieties are coloured light green. The adjacent
protomers are shown in surface view and coloured shades of grey. Eight
nonsynonymous mutants (red) and a three amino acid deletion (pink) that
together define the Spike501Y.V2 lineage are shown with spheres.
17/01/2021 22
Tegaly medRxiv 22 Dec 2020Rapid spread of new variant 501Y.V2 with multiple spike mutations in South Africa
Spatiotemporal reconstruction of the
spread of the S.501Y.V2 cluster in South
Africa during the second epidemic wave.
Figure 1. SARS-CoV-2 epidemiological dynamics in South-Africa (A), and the
three provinces under study, Eastern Cape (B), Western Cape (C), and
KwaZulu-Natal (D). The histograms show the number of daily confirmed
COVID-19 cases in each region (mapped to left y-axis). Fluctuations to
daily Re estimates are shown in red (mapped to right y-axis), with a cut-off for Frequency and distribution of SARS-CoV-2 lineages
R=1 shown as the red broken line. Weekly excess deaths in each region are circulating in South Africa over time.
shown with the black broken lines (mapped to the left y-axis).
17/01/2021 23
Tegaly medRxiv 22 Dec 2020Genomic characterization of a novel SARS-CoV-2 lineage from Rio de Janeiro, Brazil
Evolution of the relative frequency of Brazilian SARS-CoV-2 lineages. A Brazilian dataset composed of the 180 genomes generated in this work
plus all Brazilian genomes with collection dates ranging from May to November available in GISAID, was submitted to Pangolin classification.
The relative frequency of each lineage in each month was plotted. Colors represent each lineage as described in the figure legend.
17/01/2021 24
Voloch medRxiv 26 Dec 2020Genomic characterization of a novel SARS-CoV-2 lineage from Rio de Janeiro, Brazil
Figure 4: Phylogeographic inference of the Spread of SARS-CoV-2 in Rio de Janeiro state.
Spatially-explicit reconstruction of Rio de Janeiro SARS-CoV-2 clusters identified by the discrete phylogeographic analysis in each of the tree
Clades. Each dot represents a node of the MCC tree and are coloured according to their inferred time of occurrence. Curved lines represent
branches of phylogeny and the directionality of movement as depicted in the figure legend
17/01/2021 25
Voloch medRxiv 26 Dec 2020Genomic characterization of a novel SARS-CoV-2 lineage from Rio de Janeiro, Brazil
Figure 1. Molecular characterization of a COVID-19 reinfection case in Salvador, Bahia state, Northeast Brazil. A) Timeline of symptom onset,
molecular and serological diagnosis. B) Time-scaled ML tree including the newly SARS-CoV-2 genomes recovered from a 45-yearold female
resident in Salvador, Bahia state, Northeast Brazil, plus contemporaneous sequences from Brazil (supplementary table 1). New genomes are
highlighted with red circles.
17/01/2021 26
Vasques Nonaka Preprint 6 Jan2021New Variant Strain of SARS-CoV-2 Identified in Travelers from Brazil 17/01/2021 27
You can also read