Update on COVID-19 Projections - Science Advisory and Modelling Consensus Tables March 11, 2021 - Ontario COVID-19 Science ...
←
→
Page content transcription
If your browser does not render page correctly, please read the page content below
Update on COVID-19 Projections
  Science Advisory and Modelling Consensus Tables
                  March 11, 2021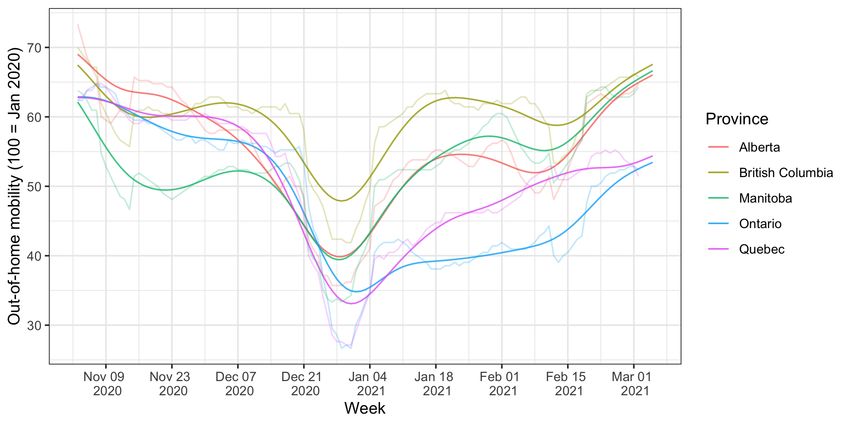
Key Findings
• Vaccination in long-term care has paid off.
• Progress otherwise has stalled. Declines in community cases and test positivity
  have levelled off. Cases are increasing in most Public Health Units as we see
  mobility rise.
• Variants of concern continue to spread across Ontario. Our ability to control the
  rate of spread will determine whether we return to normal or face a third wave of
  infection. We know what works: continued masking and distancing are essential
  to controlling variants of concern.
• Our behaviour over the next few weeks is critical in determining the quality of
  our summer.
• High volumes of postponed care and missed screening and preventative care
  mean that there will be a substantial and prolonged surge in need for care across
  sectors. Our actions now affect our ability to access care later.
• Controlling cases, increasing vaccinations where they will have the greatest
  impact, and accelerating vaccinations overall are how we beat the pandemic.
                                                                                      2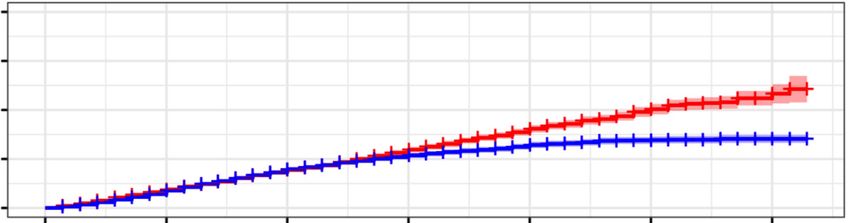
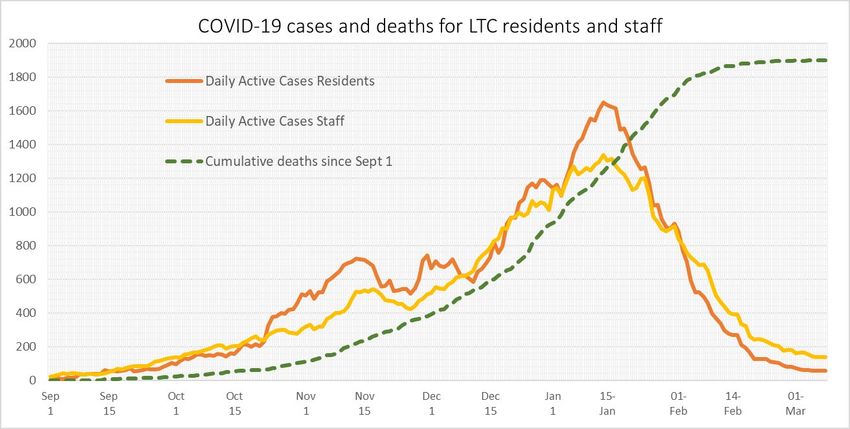
Staff and resident cases continue to decrease and deaths
  have flattened (no resident deaths in last five days)
  LTC Home cases and outbreaks
  Current status
  25 LTC homes have outbreaks
  involving resident cases.
  13 Public Health Units have
  no homes in outbreak.
  Almost half of LTC homes in
  outbreak are in York, Toronto
  and Peel.
  Total number of resident
  deaths in Wave 2 has been
  greater than in Wave 1 (1,900
  vs 1,848).
Data Source: Ministry of Long Term Care Tracker, March 8 extraction based on data reported up to 3:30
pm March 7, 2021. Data are self-reported by the long-term care homes to the Ministry of Long-Term
Care. Daily case and death figures may not immediately match the numbers posted by the local public     3
health units (i.e. iPHIS database) due to lags in reporting time.
Increasing mobility brings the risk of rising case numbers
in the community

                    The mobility index is the estimated proportion of time spent outside of home – 100 represents January 2020 levels.   4
                                                                                 Data from: https://www.google.com/covid19/mobility/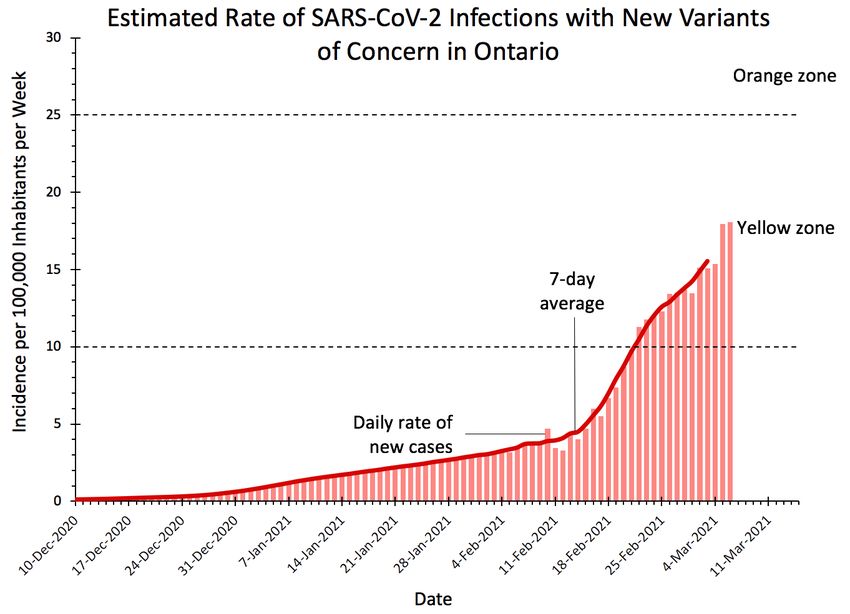
Weekly new cases per 100,000 residents
100
120
140
160
180
200
220
20
40
60
80
0
Data source: CCM
Thunder Bay
Peel
Brant
Lambton
Sudbury
Waterloo
Hamilton
Wellington-Dufferin-Guelph
Peterborough
Halton
Ottawa
Haldimand-Norfolk
Eastern
Southwestern
Niagara
Renfrew
Huron Perth
February 21
Leeds Grenville Lanark
Middlesex-London
Data note: Data for the most recent day have been censored to account for reporting delays
Timiskaming
Hastings & PEC
Average weekly cases on:
March 6
Toronto
Northwestern
York
Windsor-Essex
Simcoe Muskoka
Durham
Haliburton KPR
Porcupine
Chatham-Kent
KFLA
North Bay Parry Sound
Grey Bruce
Algoma
RESTRICT
PROTECT
CONTROL
5
Cases are increasing or past "Restrict" in most Public Health Units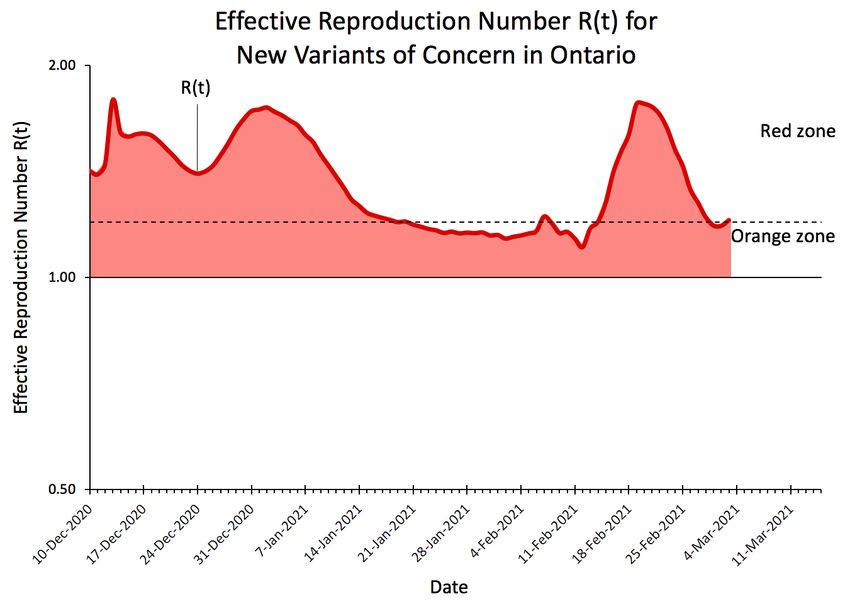
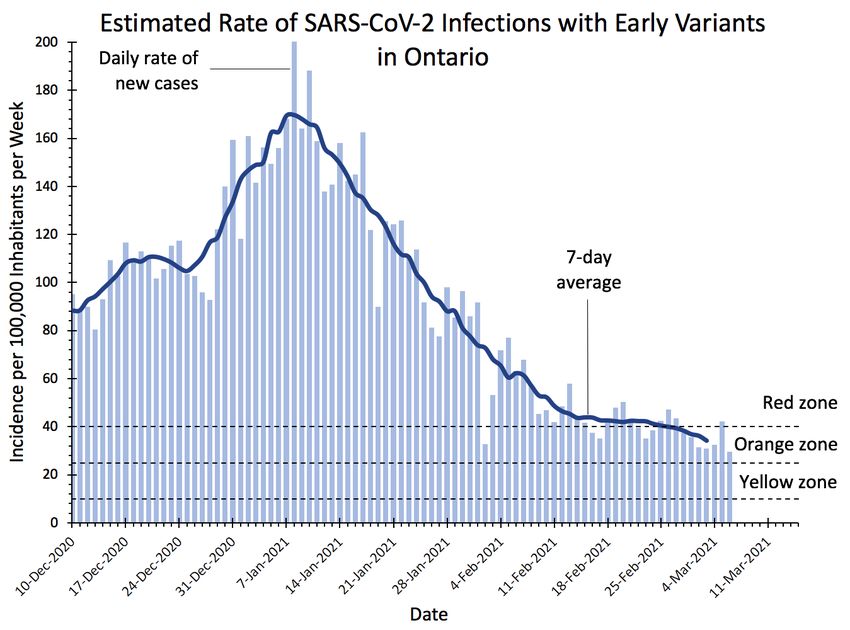
New variants of concern spread more easily than early variants

                                                                 6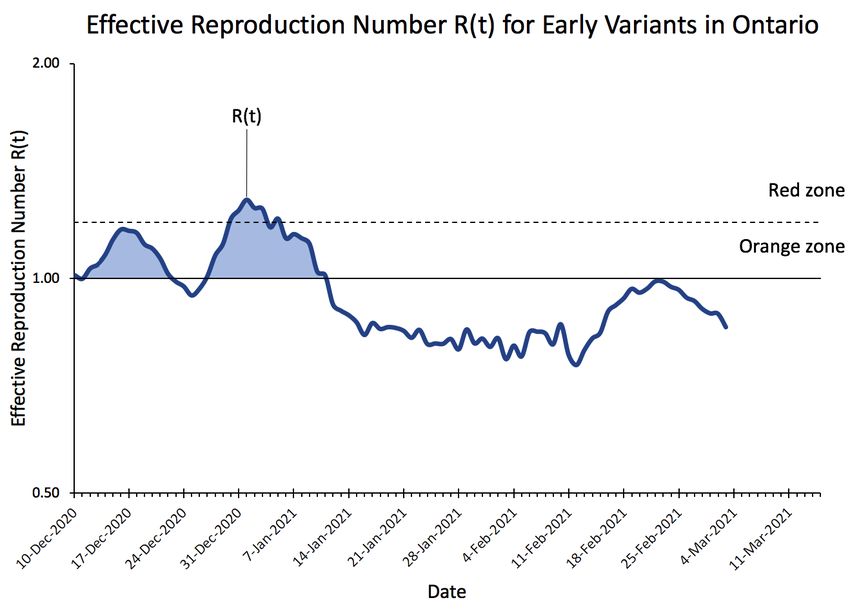
New variants of concern spread more easily than early variants

                                                                 7
COVID-19 testing % positivity across Public Health Units
16 Dec 26 Jan 18
Province-wide lockdown First dose
14-days for N. Ontario vaccination
14 28-days for S. Ontario complete in
% positivity of daily testing episodes
prioritized PHUs
12
10
(7-day avg.)
8
6 Thunder Bay, 5.7%
Peel, 5.1%
Toronto, 4.5%
4
York, 3.3%
CONTROL (positivity ≥ 2.5%) Ontario, 2.7%
2
RESTRICT (positivity ≥ 1.3%)
PROTECT (positivity ≥ 0.5%)
0
Aug 15
Aug 29
Oct 10
Oct 24
Aug 1
Nov 21
Nov 7
Feb 13
Feb 27
Jan 16
Jan 30
Jan 2
Sep 12
Sep 26
Dec 19
Dec 5
Specimen Date
8
Data source:Ontario Laboratory Information System (OLIS), data up to March 5Testing episodes per 100K across Public Health Units
600
Timiskaming, 552
Thunder Bay, 539
500
Testing episodes per 100,000
400
(7-day avg.)
300
Ontario, 287
200 Grey Bruce, 190
Windsor-Essex, 184
100
0
Aug 15
Aug 29
Oct 10
Oct 24
Aug 1
Nov 21
Nov 7
Feb 13
Feb 27
Jan 16
Jan 30
Jan 2
Sep 12
Sep 26
Dec 19
Dec 5
Specimen Date
9
Data source:Ontario Laboratory Information System (OLIS), data up to March 5Case projections depend heavily on spread of variants
Daily Cases
Scenarios based on 5 9,000
models, 3-5 scenarios each. 8,000
7,000
Optimistic scenario reflects: 6,000
• Modeling approach
5,000
• Low increase of VOCs over
time 4,000
• Low transmissibility of 3,000
VOCs 2,000
• Degree and timing of 1,000
relaxing public health
-
measures 01-01 01-08 01-15 01-22 01-29 02-05 02-12 02-19 02-26 03-05 03-12 03-19 03-26 04-02
ON - Daily ON - 7-Day Mean High Medium Low
Predictions informed by modeling from COVID-19 ModCollab, Fields Institute, McMasterU, PHO, YorkU 10
Data (Observed Cases): covid-19.ontario.caCOVID-19 hospitalization and ICU occupancy decreases
1,800
have levelled off.
1,600
Patients in Inpatient Beds with COVID19
1,400
Patients in ICU with COVID-Related Critical Illness
1,200
1,000
800
600
400
200
0
01-Sep 08-Sep 15-Sep 22-Sep 29-Sep 06-Oct 13-Oct 20-Oct 27-Oct 03-Nov 10-Nov 17-Nov 24-Nov 01-Dec 08-Dec 15-Dec 22-Dec 29-Dec 05-Jan 12-Jan 19-Jan 26-Jan 02-Feb 09-Feb 16-Feb 23-Feb 02-Mar
11
Data Sources: MOH COVID Census and Critical Care Information SystemAs with cases, ICU projections depend heavily on variants
and public health measures
ICU Occupancy
700
600
500
400
300
200
100
-
01-01 01-08 01-15 01-22 01-29 02-05 02-12 02-19 02-26 03-05 03-12 03-19 03-26 04-02
ON Observed ON Predicted High Medium Low Capacity Threshold
Predictions: COVID-19 ModCollab. 12
Data (Observed ICU Occupancy): CCSOEstimated surgery backlog is building Cumulative
backlogged
250,000 surgical cases:
227,410
Cumulative number of backlogged scheduled surgery
200,000
150,000
May 26:
cases
Surgical restart
100,000 implemented
March 15:
Provincial
50,000 hospital
shutdown
0
Mar-20 Apr-20 May-20 Jun-20 Jul-20 Aug-20 Sep-20 Oct-20 Nov-20 Dec-20 Jan-21 Feb-21
13
Data Source: Wait Times Information System. Backlog estimated based on comparison of 2020/21 with 2019/20 surgical volumesCancer Screening volumes have declined substantially
with long-term consequences for cancer outcomes
Cancer Screening Test Volumes in 2019 and 2020
100,000
Cancer Screening
Services Resumed
80,000
60,000
40,000
20,000
0
Fecal tests Screening mammography Pap tests
14More Ontarians are getting vaccinated, focusing coverage
on areas where impact is greatest will be important.
Individuals that have received at least 1 dose Individuals that have been fully vaccinated (2 doses)
700000
600000
500000
Cumulative # of Individuals
400000
300000
200000
100000
0
Time Given
Source: COVax-ON data March 8, 2021 – 2:10 PM
- Data for Time Given between 12/15/2020 to 03/07/2021
- Dose 1 Administered was determined based on the first Time Given for each client.
- Dose 2 Administered was determined based on the last Time Given for each client where there is more than 1 dose administered
15Real-world evidence suggests vaccines reduce infection
and decrease transmission
2.0
Effectiveness against infections with no or minimal symptoms
3 weeks after first dose: 52% Unvaccinated
1 week after second dose: 90% Vaccinated
Cumulative Incidence (%)
1.5
1.0
0.5
0
0 7 14 21 28 35 42
Days since First Dose
Dagan et al, N Engl J Med 2021; evidence is for Pfizer-BioNTech BNT162b2 mRNA Covid-19 Vaccine 16Key Findings
• Vaccination in long-term care has paid off.
• Progress otherwise has stalled. Declines in community cases and test positivity
have levelled off. Cases are increasing in most Public Health Units as we see
mobility rise.
• Variants of concern continue to spread across Ontario. Our ability to control the
rate of spread will determine whether we return to normal or face a third wave of
infection. We know what works: continued masking and distancing are essential
to controlling variants of concern.
• Our behaviour over the next few weeks is critical in determining the quality of
our summer.
• High volumes of postponed care and missed screening and preventative care
mean that there will be a substantial and prolonged surge in need for care across
sectors. Our actions now affect our ability to access care later.
• Controlling cases, increasing vaccinations where they will have the greatest
impact, and accelerating vaccinations overall are how we beat the pandemic.
17Contributors
• COVID-19 Modeling Collaborative: Kali Barrett, Stephen Mac, David
Naimark, Aysegul Erman, Yasin Khan, Raphael Ximenes, Sharmistha Mishra,
Beate Sander
• Fields Institute: Taha Jaffar, Kumar Murty
• McMasterU: Michael Li, Irena Papst, Ben Bolker, Jonathan Dushoff, David
Earn
• YorkU: Jianhong Wu, Francesca Scarabel, Bushra Majeed
• MOHLTC: Michael Hillmer, Kamil Malikov, Qing Huang, Jagadish Rangrej,
Nam Bains, Jennifer Bridge
• OH: Erik Hellsten, Stephen Petersen, Anna Lambrinos, Chris Lau, Access to
Care Team, Linda Rabeneck, Melissa Coulson, Michelle Lloyd
• PHO: Sarah Buchan, Kevin Brown
18Content provided by Modelling Consensus and
Scientific Advisory Table members and secretariat
Beate Sander,* Peter Juni, Brian Schwartz,* Kumar Murty,* Upton Allen, Vanessa Allen, Nicholas
Bodmer, Isaac Bogoch, Kevin Brown, Sarah Buchan, Yoojin Choi, Troy Day, Laura Desveaux, David
Earn, Gerald Evans, David Fisman, Jennifer Gibson, Anna Greenberg, Anne Hayes, Michael Hillmer,
Jessica Hopkins, Jeff Kwong, Fiona Kouyoumdjian, Audrey Laporte, John Lavis, Gerald Lebovic, Brian
Lewis, Linda Mah, Kamil Malikov, Antonina Maltsev, Doug Manuel, Roisin McElroy, Allison McGeer,
David McKeown, John McLaughlin, Sharmistha Mishra, Justin Morgenstern, Andrew Morris, Samira
Mubareka, Laveena Munshi, Christopher Mushquash, Ayodele Odutayo, Shahla Oskooei, Menaka
Pai, Samir Patel, Anna Perkhun, Bill Praamsma, Justin Presseau, Fahad Razak, Paula Rochon, Laura
Rosella, Michael Schull, Arjumand Siddiqi, Chris Simpson, Arthur Slutsky, Janet Smylie, Nathan Stall,
Robert Steiner, Ashleigh Tuite, Jennifer Walker, Tania Watts, Ashini Weerasinghe, Scott Weese,
Xiaolin Wei, Jianhong Wu, Diana Yan, Emre Yurga
* Chairs of Scientific Advisory or Modelling Consensus Tables
For table membership and profiles, please visit the About and Partners pages on the Science
Advisory Table website.
19You can also read