EQUITY AND EXCELLENCE IN COLLEGE AND CAREER READINESS
←
→
Page content transcription
If your browser does not render page correctly, please read the page content below

REPORT

EQUITY AND EXCELLENCE IN COLLEGE AND
CAREER READINESS
STUDY OF EDUCATION IN BATTLE CREEK, MICHIGAN

February 2017

Metropolitan Center for Research on Equity and the Transformation of Schools
New York U niversity
726 Broadway, S uite 5 00
New York, NY 10003 | 212 998 5100 | 212 995 4199 fax
steinhardt.nyu.edu/metrocenter
EQUITY AND EXCELLENCE IN COLLEGE AND
CAREER READINESS
STUDY OF EDUCATION IN BATTLE CREEK, MICHIGAN
ACKNOWLEDGEMENTS
The Metropolitan Center for Research on Equity and the Transformation of Schools (Metro Center) would like to
acknowledge the support of Diane Smith and Joe Scantlebury at the W.K. Kellogg Foundation, Angela Stewart and
Devon Gibson at BC Vision, and Kathleen Moore, Jorge Zeballos, and Evon Walters from the College and Career
Readiness Action Team for their collective support, enabling us to connect with local organizations through the
Battle Creek Community. Additionally, we thank Battle Creek area youth, particularly those who conducted YPAR
projects as part of this effort, as well as parents, community participants, local superintendents and their staff in
grounding this work and providing insights about their schools. Finally, we thank the College & Career Readiness
Action Team of the Battle Creek Vision and the people of the City of Battle Creek for believing that all children
deserve the opportunity to thrive and for their diligent commitment to addressing barriers to equitable and
excellent education.

ABOUT NYU METRO CENTER
Metro Center promotes equity and opportunity in education through engaged sciences—research, program
evaluation, policy analysis, and professional assistance to educational, governmental, and community agencies
serving vulnerable communities and populations. Metro Center is nationally and internationally renowned for its
work on educational equity and school improvement, bringing together scholars, educators, and innovators from
diverse backgrounds to collaborate on a range of projects to strengthen and improve access, opportunity, and
educational quality across varied settings, but particularly in striving communities.

For nearly four decades, Metro Center has been a partner and resource for schools and school districts throughout
the U.S. and beyond, including Detroit, Denver, Houston, New York City, Pittsburgh, San Juan, Washington, D.C., and
Wilmington. Its research and community engagement programs help prepare teachers, school leaders and staff, and
parents improve school culture and climate, reduce referrals to special education, and better support the unique
needs of youth across a range of abilities and backgrounds. Its research initiatives inform policy and intervention
communities on how best to serve vulnerable populations in and beyond our school systems.

AUTHORS | David E. Kirkland, Roey Ahram, Madelyn Boesen, Joy Sanzone, Evan Johnson, and Alexandra Freidus,
with support from Catalin Rossman, Chezare Warren, and Joanne Marciano

EDITING | Jasmine Bourdeau

GRAPHIC DESIGN | Romina Barrera

COVER PHOTO | Ann Duckett

© 2017 NYU Metropolitan Center for Research on Equity and the Transformation of Schools. All rights reserved. This
report is prepared for the sole purposes of correspondence with and for the sole use of W.K. Kellogg Foundation
and BC Vision. For any other uses, including the making of derivative works, permission must be obtained from NYU
Metropolitan Center for Research on Equity and the Transformation of Schools, unless fair use exceptions to
copyright law apply. All findings and conclusions drawn in this report reflect solely the work of researchers at NYU
Metro Center and may not to be attributable to W.K. Kellogg Foundation.

SUGGESTED CITATION
Kirkland, D., Ahram, R., Boesen, M., Sanzone, J., Johnson, & E., Freidus, A. (2017). Equity and Excellence in College
and Career Readiness: Study of Education in Battle Creek, Michigan. New York: Metropolitan Center for Research on
Equity and the Transformation of Schools, New York University.

EQUITY AND EXCELLENCE IN COLLEGE AND
CAREER READINESS
STUDY OF EDUCATION IN BATTLE CREEK, MICHIGAN

 Table of Contents

                     SUMMARY OF FINDINGS, CONCLUSIONS, AND RECOMMENDATIONS................ 1
                     INTRODUCTION .................................................................................................... 3

                     GUIDING QUESTIONS ........................................................................................... 5

                     METHODS ............................................................................................................. 6
                     Community and School Data ................................................................................ 7
                     Interviews and Focus Groups ............................................................................... 7
                     Surveys .................................................................................................................. 8
                     College and Career Readiness Action Team ....................................................... 10
                     Analysis ............................................................................................................... 10

                     THE BATTLE CREEK COMMUNITY DEMOGRAPHICS ........................................... 11
                     Race, Ethnicity, and Language ............................................................................ 11
                     Income and Earnings .......................................................................................... 14
                     Employment ....................................................................................................... 16
                     Educational Attainment ...................................................................................... 17

                     COLLEGE AND CAREER READINESS IN BATTLE CREEK ........................................ 18
                     Why College and Career Readiness Matters ...................................................... 19
                     Early Childhood Participation ............................................................................. 20
                     Student Achievement ......................................................................................... 22
                     Course Enrollment .............................................................................................. 24
                     College Readiness ............................................................................................... 26
                     Attendance ......................................................................................................... 28
                     Discipline Involvement ....................................................................................... 29
                     High School Graduation Rates and College Trajectories .................................... 30
                     Aspirations and Expectations for Future Education ........................................... 32

                     COMMUNITY NARRATIVE ................................................................................... 35
                     College Versus Career ......................................................................................... 35
                     Separate and Different ....................................................................................... 37
                     Choice: Patterns, Perceptions, and Experiences ................................................ 40
                     Family-School Relationships ............................................................................... 48
COMMUNITY AND SCHOOL RESOURCES ............................................................ 53 Preparing for College and Career Opportunities ................................................ 53 Teacher and Student Perceptions of Learning ................................................... 56 Time Spent Out of School ................................................................................... 60 Support for Struggling Learners ......................................................................... 61 Community Organizations as Culture and Knowledge Brokers ......................... 64 Early Childhood Education.................................................................................. 65 Disconnect and Unequal/Inequitable Distribution of Services .......................... 67 CONCLUSIONS .................................................................................................... 69 RECOMMENDATIONS ......................................................................................... 75 Additional Suggestions from the Community .................................................... 76 MOVING AHEAD ................................................................................................. 76 Focus on Bringing the Community Together. ..................................................... 77 Focus on Interventions to Support Struggling Learners. .................................... 78 Focus on Battle Creek. ........................................................................................ 78
Table of Tables

                  Table 1: Student Survey Respondents and Weighting ........................................ 10
                  Table 2: Battle Creek Community Demographics ............................................... 12
                  Table 3: PreK-12 Student Population Demographics for Battle Creek Area School
                       Districts and All Michigan Districts Combined, 2015 – 2016 ..................... 13
                  Table 4: Average Household Income by District ................................................. 15
                  Table 5: Unemployment by District and Race..................................................... 16
                  Table 6: Major Job Sectors by School District ..................................................... 16
                  Table 7: Employment Inflow and Outflow .......................................................... 17
                  Table 8: Percent Achieving Proficient or Advanced Exam Scores on 3rd Grade
                       ELA M-STEP, 2015-2016 ............................................................................. 23
                  Table 9: Percent Achieving Proficient or Advanced Exam Scores on 8th Grade
                       ELA M-STEP, 2015-2016 ............................................................................. 23
                  Table 10: Percent Achieving Proficient or Advanced Exam Scores on 3rd Grade
                       M-STEP by Race and Family Socioeconomic Disadvantaged versus Not
                       Disadvantaged 2015-2016 ......................................................................... 24
                  Table 11: Percent Achieving Proficient or Advanced Exam Scores on 8th Grade
                       M-STEP by Race and Family Socioeconomic Disadvantaged versus Not
                       Disadvantaged 2015-2016 ......................................................................... 24
                  Table 12: Percent of Eighth Graders Enrolled in Algebra I, 2015-2016 .............. 25
                  Table 13: Percent of Eighth Graders Enrolled in Algebra I by Race and
                       Socioeconomic Status, 2015-2016 ............................................................. 25
                  Table 14: Percent of High School Students Enrolled in Advanced Placement
                       Classes, 2015-2016 .................................................................................... 26
                  Table 15: Percent of High School Students Enrolled in Advanced Placement
                       Classes by Race and Socioeconomic Status, 2015-2016 ............................ 26
                  Table 16: Percent Ready on SAT College Benchmarks – Evidence-Based Reading
                       & Writing, 2015-2016 ................................................................................ 27
                  Table 17: Percent Ready on SAT College Benchmarks – All Subjects, 2015-2016
                        ................................................................................................................... 27
                  Table 18: Percent Ready on SAT College Benchmarks – All Subjects, 2015-2016
                        ................................................................................................................... 28
                  Table 19: Attendance Rates, 2015-2016............................................................. 28
                  Table 20: Rates of Chronic Absenteeism, 2015-2016 ......................................... 29
                  Table 21: Out-of-School Suspension Rates versus District Enrollment Rates
                       Reported to the Office of Civil Rights, 2013-2014 ..................................... 30
                  Table 22: Four Year Graduation Rate, 2015-2016 .............................................. 31
                  Table 23: Graduates Attending College within Six Months of Graduation, 2015
                       Cohort ........................................................................................................ 32
                  Table 24: Parent Educational Aspirations ........................................................... 34
                  Table 25: Educator Expectations of Student Attainment.................................... 34
Table 26: Teacher Effectiveness ......................................................................... 38
Table 27: Percentages of Students who Attended a School outside of Their
District of Residence in Fall 2016 ............................................................... 42
Table 28: Percentages of Students Attending Schools Outside Their Districts of
Residence by Race and Socioeconomic Status, Fall 2016 .......................... 42
Table 29: Student Assignment Districts for Each District of Residence, Fall 2016
................................................................................................................... 43
Table 30: Transfer Student Assignment District Preferences for Each District of
Residence by Socioeconomic Status, Fall 2016 .......................................... 44
Table 31: Transfer Student Assignment District Preferences for Each District of
Residence by Race, Fall 2016 ..................................................................... 44
Table 32: Parent-School Interactions.................................................................. 49
Table 33: Educators’ Perceptions of Home-School Relationships ...................... 49
Table 34: Community Satisfaction with Schools ................................................. 51
Table 35: Parent Perceptions of Trust, Respect, and Welcoming ....................... 52
Table 36: Teacher and Student Perceptions of Learning .................................... 57
Table 37: Count of Area Guidance Counselors ................................................... 60
Table 38: Childcare Supply and Demand ............................................................ 66Table of Figures
Figure 1: Annual Household Earnings ................................................................. 14
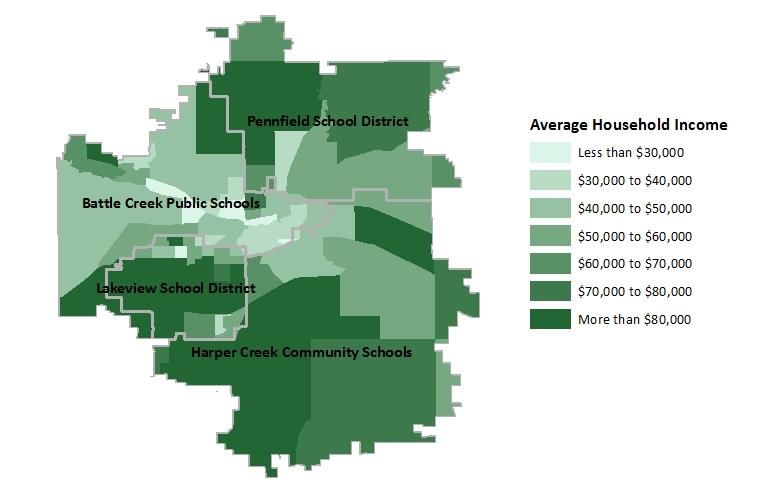
Figure 2: Map of Annual Household Earnings..................................................... 14
Figure 3: Poverty Rates of Total Population and Children Under 18 .................. 15
Figure 4: Educational Attainment in the Battle Creek Community ..................... 17
Figure 5: Median 12-Month Earnings by Educational Attainment, 2015 ........... 19
Figure 6: Enrollment in Early Childhood Programs, 2011-12 to 2014-15 ........... 20
Figure 7: Kindergarten Rate of Participation in Early Childhood Programs, 2012-
13 to 2015-16 ............................................................................................ 21
Figure 8 Number of Kindergarten Students Participating in Early Childhood
Programs, 2012-13 to 2015-16 .................................................................. 21
Figure 9: Student Educational Aspirations .......................................................... 33
Figure 11: Student Educational Aspirations, by Race Ethnicity........................... 33
Figure 12: Educators’ Perceptions of Home-School Relationships, by School
Districts ...................................................................................................... 50
Figure 13: Satisfaction with Local Public Schools ................................................ 51
Figure 14: College and Career Education ............................................................ 55
Figure 15: College and Career Education by District........................................... 56
Figure 16: Learning Environment........................................................................ 58
Figure 17: Students Use of Time Outside of School ............................................ 61
Figure 17: Ability to Support Struggling Learners ............................................... 63
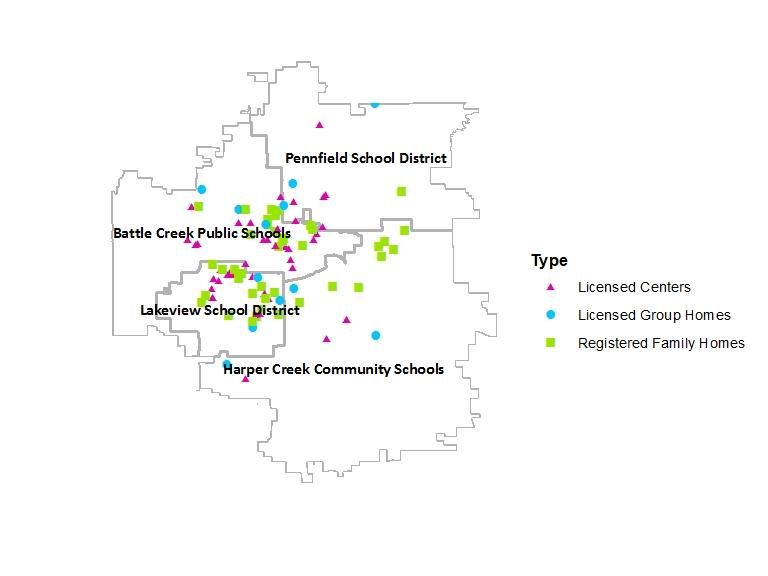
Figure 18: Childcare Providers in the Battle Creek Community .......................... 65SUMMARY OF FINDINGS, CONCLUSIONS, AND
RECOMMENDATIONS
This study was commissioned by the W. K. Kellogg Foundation as part of a
broader Battle Creek region community initiative – BC Vision. The study was
guided by three overarching questions:
a. What does it mean to be college and career ready in the Battle Creek
region?
b. How do community members perceive schools and educational
opportunities in the region?
c. What resources, supports, and other school and community inputs
shape college and career readiness for Battle Creek region students?
The study was framed in relation to larger issues of equity and excellence in
education, and found that structural bias and cultural, socioeconomic, and
residential segregation limit the region’s pursuit of career and college readiness
for all of its residents. The evidence illustrates a complicated set of tensions that
surround racial, cultural, and linguistic diversities in relationship to college and
career readiness. As one community member put it: “The Battle Creek region is
racially, culturally, and linguistically diverse but deeply segregated.” Moreover,
in places where racial and cultural diversity may exist, socioeconomic
segregation appears to be more entrenched. One community respondent
described “the Battle Creek Region” as “most certainly segregated by
socioeconomic status.”
Regardless the fault points that splinter the Battle Creek region into isolated
community camps, the intersectionality of identities across race, class, and
region seem to define inequities in the region the most. Such inequities play out
through patterns of mobility as consequence of school choice and dramatized
by significant shifts in student population. Such shifts have redrawn the districts,
leaving Battle Creek Public Schools all but alone in a struggle to retain the youth
of its community. Such patterns of shift—mobility propelled by Michigan’s 2003
Schools of Choice law—explain outcomes of racial and socioeconomic
segregation, which correlate with rates of employment. According to the data,
lower rates of employment are concentrated among the most disadvantaged,
usually but not exclusively the region’s low-income residents and residents of
color.
1 | EQUITY AND EXCELLENCE IN COLLEGE AND CAREER READINESSThese issues of structural bias and segregation uniquely inspire conditions in the
Battle Creek region that breed vulnerability and maintain disproportionate
educational experiences and outcomes. Thus, academically under-prepared and
socially disadvantaged students—the vulnerable—become locked into cycles of
disparity that are, themselves, linked to structural bias and segregation.
According to the evidence, such cycles reinforce existing constraints to college
and careers, particularly for the region’s most vulnerable students.
In this light, the study found that vulnerable students are the least well served
by schools in the Battle Creek region. According to the data, vulnerability
predicts access to rigorous college prep curricula and resources needed to
advance beyond high school. The data also illustrates gaps in SAT scores defined
by characteristics of vulnerability. Because of the relationship between access to
a rigorous curriculum and test scores, it is reasonable to draw the conclusion
that curriculum inequity in the Battle Creek region leaves vulnerable students
underprepared (as compared to their less vulnerable peers) for college entrance
exams such as the SAT. Moreover, just as it predicts employment rates and
academic achievement across the Battle Creek region, vulnerability also predicts
with graduation and college persistence rates.
In spite of these inequities, the story of education in the Battle Creek region is
about much more than vulnerability and disparity, bias and segregation. There is
evidence of a fragile but lingering hope defined by a promise of potential. This
hope—the community and its cherished wealth of resources, from
groundbreaking early childhood programs to a series of community based
organizations—can move the region and its residents beyond postures of
vulnerability and towards unique pathways to college and careers. The data
suggest that community features such as access to early childhood education
and persistence to high school graduation, even in the most disadvantaged parts
of the region, are becoming the norm. In terms of both access to early childhood
education and persistence to graduation, all four districts in the Battle Creek
region meet or exceed national averages. However, more work needs to be
done, as community members are vexed with questions that revolve around
choice: whether to pursue college or career (as opposed to career and college).
And the region’s more vulnerable students are least likely to be supported due
to fragile links between schools and community based organizations.
These findings on college and career readiness in the Battle Creek region all
point to three important conclusions:
1. Structural bias and segregation create concentrated pockets of
vulnerability that limit career and college readiness for some Battle
Creek region residents.
2. Vulnerability drives key educational (outcome) gaps between school
districts and within school districts.
2 | EQUITY AND EXCELLENCE IN COLLEGE AND CAREER READINESS3. The Battle Creek region boasts a level of resources and commitments
that has the potential to transform college and career trajectories
throughout the region; however, this hope is fragile, as resources are
often misaligned and the region’s most vulnerable students may lack
access to them.
Recommendations from this study respond to these conclusions:
Recommendation #1: Leverage the Fragile Hope and Lingering Potential
that exist in the community
Recommendation #2: Disrupt Disproportionality and Vulnerability
Recommendation #3: Resolve the Tensions of Structural Bias and
Segregation
Thus, these recommendations frame the logics for a range of simple changes to
programs and policies. They also should inform suggestions for transforming the
region’s districts in ways that inspire collaboration and community partnerships.
For the sake of categorization, these recommendations are framed as broad
solutions (open to more specific programs). Collectively, the proposed they are
meant to guide members of the Battle Creek community as they work to foster
more equitable learning environments conducive to helping all students in the
region thrive from cradle to career.
TION
3 | EQUITY AND EXCELLENCE IN COLLEGE AND CAREER READINESSIN 2014, The W.K. Kellogg Foundation and Kellogg Company hosted a
community meeting with Battle Creek area leaders and residents to
discuss ways to spark transformation in Battle Creek and improve the
educational and economic conditions of Battle Creek area communities.
A
s an outgrowth of that meeting, researchers from New York University’s
Metropolitan Center for Research on Equity and the Transformation of
Schools (NYU Metro Center) conducted the following study to support BC
Vision’s community-wide mission of promoting educational excellence and
equity throughout the Battle Creek community – i.e., the school catchment area
shared by Battle Creek Public Schools, Lakeview School District, Harper Creek
Community Schools, and Pennfield Schools.1 With support from the W.K. Kellogg
Foundation, NYU Metro Center, in collaboration with BC Vision and the Battle
Creek community, conducted a community review of educational outcomes,
policies, and practices, and supported the development of a community
narrative around education.
The goal of the project was to help develop a plan of action for excellent and
“We envision a thriving community equitable education systems that benefit all students in the Battle Creek
for all people, where there is region—one that promotes success beyond school. Equity, as defined in this
equitable opportunity for residents report, does not mean the lowering of standards, the equal treatment of all
students, or something schools that only serve low income students of color
to have the income, education, and
should be concerned about. In this report, equity means giving all students what
resources they need to be
they need to be successful (academically, psychologically, emotionally, socially,
successful.” and so on), thus recognizing that all students are different. Equitable schooling,
then, is about adapting strategies to meet the needs of individual and groups of
students and scaffolding strategies to meet the unique needs of all students.
This specific definition of equity frames findings, conclusions, and
recommendations drawn from this study. As part of this work, a team of
researchers from NYU Metro Center examined school data and invited
community members to share their perspectives of and visions for education in
Battle Creek through interviews, focus groups, and surveys. Thus, this study was
situated as part of a broader community initiative to advance equitable
1Throughout this report, we attempt to make a distinction between the Battle Creek Public School District and the larger Community. In spaces
where there might be some confusion, we use the phrase “Battle Creek Community” or “Battle Creek Area” to denote all four school districts,
and “Battle Creek” “Battle Creek Public Schools” of “BCPS” to indicate the local school district and its catchment area.
4 | EQUITY AND EXCELLENCE IN COLLEGE AND CAREER READINESSopportunity for residents to have the income, education, and resources needed
to enjoy success.
NYU Metro Center, in conducting this study, worked closely with Battle Creek
Community organizations and residents to surface critical issues relevant to the
Battle Creek region. Additionally, NYU Metro Center worked with Education First
(Ed-First) and the National Equity Project (NEP) in efforts leading to this report.
GUIDING QUESTIONS
This study was guided by three overarching research questions: (1) What does it
mean to be college and career ready in the Battle Creek region (a postindustrial
region not unlike other regions across the American Rustbelt)? (2) How do
community members perceive schools and educational opportunities across the
region? (3) What resources, supports, and other school and community inputs
shape college and career readiness? In this report, each question is addressed
though a lens of equity, with specific attention paid to structural arrangements
of opportunity and related outcomes (e.g., systems of disparity across student
achievement; access to educational opportunities, rigorous curriculum, and
highly qualified teachers; among other issues of disproportionality).
The first of these questions engages multiple sources of data to highlight key
educational outcomes that community stakeholders associate with college and
career readiness. Drawing from interview and survey data, our analysis
examined indicators of being “on track” for college and career across and within
each of the school districts.
Findings from this study suggests that career and college readiness in the Battle
Creek region is influenced by at least three drivers: (1) Structural bias and
segregation, (2) disproportionality and concentrated vulnerability, and (3) the
fragile potential and hope patterned by sets of unique programs, people, and
resources peppered throughout the region. By structural bias, we mean the
implicit and explicit ways that privilege and disadvantage get baked into systems
to favor some while marginalizing others usually along lines of race, class,
geography, and so on (Goodwin & Jasper, 1999). By vulnerability, we refer to
conditions that leave people “susceptible to misfortune, violence, illness, and
death” (Hill, 2016, p. xvii). Vulnerable students are “those marked as poor, Black,
Brown, immigrant, queer, or trans. . .” (Hill, 2016, p. xvii).
These findings promote a holistic view of the data, integrating diverse
perspectives and differing conceptions of who is and who is not college and
career ready, advancing conversations of why the Battle Creek region should be
concerned about college and career readiness, and interrogating what
educational excellence and equity mean to the Battle Creek region.
5 | EQUITY AND EXCELLENCE IN COLLEGE AND CAREER READINESSWith the second question, we delve further into local perceptions of education
in the Battle Creek region, exploring systems and beliefs that fosters divisions
within the region and contribute to inequitable outcomes. Here, our discussion
foregrounds community voices from interviews and surveys to unpack shared
and disparate perspectives of education.
The final question investigates resources and supports that foster college and
career readiness, focusing on how schools and community organizations within
and across the Battle Creek region seek to promote college and career
readiness, and outlining several obstacles to accessing those resources. This
discussion highlights, as valuable resources, a number of within-school programs
and services, as well as community-based (out-of-school time) organizations and
supports.
Through our close examination of these questions, we draw our conclusions and
provide recommendations on how to promote greater and more equitable
college and career readiness outcomes in and across the Battle Creek region.
METHODS
NYU Metro Center used a sequential and iterative research design to examine
college and career readiness in the Battle Creek region. Our researchers gained
familiarity with the local community through a review of publicly-available
community and school data, in combination with informal interviews of
community stakeholders, archival documents, and other key artifacts. Insights
were then shared with members of the BC Vision Education Study Taskforce and
the BC Vision College and Career Readiness Action Team for reflection and
response.
Our research team conducted initial “light touch” interviews with community
members in the Battle Creek region to gather necessary information about the
region itself and to gauge the range of local perceptions of education.
Researchers conducted these brief interviews at various community events and
public spaces throughout the Battle Creek region. We also conducted in-depth
interviews with specific community stakeholders whose professional and
personal experiences positioned them as knowledgeable informants. From
these initial conversations, as part of this study we developed a brief survey for
distribution to Battle Creek region residents, as well as educator and student
surveys intended for use by each of the school districts in their efforts to better
prepare students for college and career development. NYU Metro Center, along
with participating community organizations, distributed surveys in November
and December of 2016.
6 | EQUITY AND EXCELLENCE IN COLLEGE AND CAREER READINESSLeading up to and concurrent with survey distribution, our research team
conducted in-depth focus groups and interviews with local community members
and educators.
The collection and analysis of survey and qualitative data were informed by
publicly-available community and school data, in addition to de-identified
student data from each of the districts.
Community and School Data
Our research team compiled community and school data from a range of
sources. We began with a review of publicly-available data from the Michigan
Department of Education (mischooldata.org) and the U.S. Census Bureau’s
American Community Survey. Each of the school districts provided de-identified
student data for enrolled students through an agreement with Calhoun ISD.
District data included demographic information, achievement and outcome
records, course selection records, and data on school transfers.
Once the research team had a general perspective of demographic and
educational trends, we worked with each school district and the Calhoun ISD to
analyze de-identified student-level data. When available, data from the districts
were used to facilitate in-depth analyses by demographic subgroups. Groups of
students were compared on multiple measures of college and career readiness,
both within and between districts, to understand trends in and across various
communities.
Interviews and Focus Groups
During interviews and focus groups, we asked participants to share their
perceptions of the community, education, and college and career readiness.
Participants were prompted to share their perspectives on issues they believed
to be important about education in general, and the skills needed to be college
and career ready in specific. They also shared their personal connections to local
schools and community organizations supporting education.
Our research team conducted approximately 50 “light touch” interviews, 27
informal interviews, 49 formal interviews and focus groups sessions, involving
more than 130 community members. These community members included
store owners, parents, community leaders, educators from each of the local
districts, as well as youth attending local schools. In all forms of data collection,
the research team made special efforts to reach out to a diverse range of
communities, including low-income communities and communities of color in
the Battle Creek Community. Focus groups were designed to ensure the
perspectives of various vulnerable communities were captured. Purposeful
sampling enabled the research team to bring together individuals associated
with organizations that primarily served communities of color as participants in
focus groups.
7 | EQUITY AND EXCELLENCE IN COLLEGE AND CAREER READINESSSurveys
Our research team developed surveys in consultation with BC Vision’s College
and Career Readiness Action Team and local educators. NYU Metro Center
conducted community surveys across the Battle Creek region. Online and paper
versions of the community surveys were distributed throughout November and
December, 2016. Additionally, through BC Vision’s College and Career Readiness
Action Team, our research team developed educator and student surveys, in
collaboration with local school districts. Community surveys were distributed via
multiple sources. The surveys were distributed electronically and in paper
format through the following organizations and venues to ensure we collected a
large number of survey responses throughout the community.2
• BC Vision Facebook Page • Michigan Works (Southwest)
• BC Vision Website • The Women’s Coop
• WKKF Connected Communities • New Harvest Christian Center
• Kellogg Community College Website • Voces
• The Burma Center • Battle Creek Area Schools
COMMUNITY SURVEY RESPONDENTS BY Additionally, our research team distributed surveys
DISTRICT (N=646) directly to individuals who expressed interest in the
study and provided contact information.
1.90%
A total of 646 residents of the Battle Creek area
Battle Creek Public Schools
completed all or most of the community survey.3 The
22.80% Harper Creek Community survey, distributed to all community members
Schools
41.60% regardless of parental status, asked respondents about
Lakeview School District
their feelings about the quality of area schools and
Pennfield Schools their opinions about community initiatives. Parents
26.80%
I'm not sure
with children in local public schools were asked about
their level of engagement with their child’s teacher
and school, the climate of their child’s school, and
7.00%
their expectations regarding their child’s future
education.
2 Throughout the survey process, individuals in different communities express a sense of survey overload. In both Lakeview and Battle Creek
Public Schools, the surveys distributed after district surveys. Community members indicated having taken several surveys. While participation in
surveys should always be voluntary, the overuse of surveys in a community may depress response rates. This is taken into consideration in the
analysis of the data and in the study recommendations.
3 Over 725 residents clicked on the survey link or started a paper survey, however, did not get passed the first question, making their responses
unusable.
8 | EQUITY AND EXCELLENCE IN COLLEGE AND CAREER READINESSThe survey respondents were demographically
diverse, corresponding to the racial demographics
DEMOGRAPHICS OF COMMUNITY SURVEY
RESPONDENTS BY RACE/ETHNICITY (N=598) of the Battle Creek community. Given the
relatively low percentage of people of color in the
5.00% 0.20% 6.20%
community, attention was paid to ensuring that
White 0.50%
people of color were well represented in focus
Black or African American groups and interviews.
American Indian or Alaska 13.60% About 45 percent of community respondents had
Native
Asian
children who attended public schools in the area.
Among these parents, 25 percent had children
Native Hawaiian or Pacific 74.60% enrolled in Battle Creek Public Schools, 4 percent
Islander
Other (Please specify:) had children enrolled in Harper Creek Community
Schools, 16 percent had children enrolled in
Lakeview School District, and 46 percent had
children enrolled in Pennfield Schools. Nine
percent of respondents had children enrolled in more than one school district.
Due to the disproportionate rates of response from each of the four school
districts, claims about parents in individual districts could not be made from the
data.
In addition to helping share the community survey, school districts distributed
the educator and student surveys.
Two hundred eighteen educators participated
in the teacher survey; 38.6 percent worked in
LANGUAGE OTHER THAN ENGLISH
Battle Creek, 14.7 percent worked in
Lakeview, 27.2 percent worked in Harper
Creek and 13.6 percent worked in Pennfield.
The student survey received 1573 total
responses. Thirty-three percent of student
respondents attended schools in Battle
Creek, 41 percent in Harper Creek, and 26
percent in Pennfield. Eighty-six individual
students from Lakeview started the survey,
but most did not answer more than the first
No Spanish Burmese Other
two survey questions. Because of this, most
survey items did not have enough data from
Lakeview to prepare meaningful analysis or draw conclusions about its
population. All Lakeview student respondents were omitted from the final
survey analysis. About 17 percent of all students in the Battle Creek area
participated in the survey.
To more closely represent the distribution of students throughout Battle Creek,
Harper Creek, and Pennfield, student survey responses were weighted according
to their proportion of the overall student population. Although Battle Creek
9 | EQUITY AND EXCELLENCE IN COLLEGE AND CAREER READINESSsurvey responses made up 33 percent of the total student surveys received,
Battle Creek students comprised 47.8 percent of the student population in
Battle Creek, Harper Creek, and Pennfield. Our decision to weight survey data in
this manner ensures that no one district is over- or under-represented in final
analysis and reporting across all districts (see Table 1).
Table 1: Student Survey Respondents and Weighting
Total Student Original Proportion of Weight Factor Weighted Proportion
Proportion Surveys of Surveys
Battle Creek Public 47.8% 33% 1.53 47.8%
Schools
Harper Creek 29.0% 41% 0.76 29.0%
Community Schools
Pennfield Schools 23.2% 26% 0.94 23.2%
College and Career Readiness Action Team
The College and Career Readiness Action Team and the Education Study
Taskforce developed the initial research questions that guided this study.
Ongoing relationships and subsequent interactions with the Action Team and
Taskforce continued to shape the collection and analysis of data. Researchers
from NYU Metro Center met on a bi-monthly rotating schedule with members of
the Action Team and Taskforce. As part of these meetings, researchers from
NYU Metro Center provided the Action Team and the Taskforce members with
updates about the study and solicited critical information and feedback that was
used to drive the study.
Analysis
Key findings were based on the triangulation of data, engaging multiple data
sources to identify and corroborate findings. Descriptive analyses were
conducted on all quantitative data, including survey data. When possible, data
were disaggregated by key demographic groups. Formal interviews and focus
groups were recorded and transcribed verbatim following data collection.
Informal interviews were captured through field notes. Using Dedoose, a cross-
platform software designed to analyze mixed methods and qualitative data,
transcripts and field notes from observations were coded, clustered, and
themed by members of the research team. These analyses surfaced key themes
that shed light on the questions under investigation (Miles, Huberman, &
Saldaña, 2013).
10 | EQUITY AND EXCELLENCE IN COLLEGE AND CAREER READINESSTHE BATTLE CREEK COMMUNITY DEMOGRAPHICS
The diversity of the Battle Creek Community is complex, yielding paradoxical
results. Diversity often functions as a dividing mechanism between districts and
communities, but also represents a valuable asset to school districts. As one
White resident noted, racial and class divides were readily perceived by
members of the community. However, when discussing his decision to keep his
children in Battle Creek Public Schools, he explained:
Obviously, you want your kids to grow academically, right, but we chose Battle
Creek Public Schools specifically because of the diversity, both racially and
economically. We knew that's what our kids were going to face when they got out
of public school, whether they went to college or got a job, whatever.
A significant number of the conversations about college and career readiness in
Battle Creek were set against the backdrop of race and class, and framed by
divisions between communities and school districts. Thus, to understand college
“There's this racial divide. There's and career readiness from the perspective of both equity and excellence, it is
also a- I think a class divide that important to consider the demographic picture of the Battle Creek Community,
exists. Whether it exists or not, specifically examining racial and socioeconomic demographic patterns. Both
there's certainly the perception data from the U.S. Bureau of the Census Bureau’s American Community Survey
that that's what's happening.” (ACS) 2014 5-Year Estimates, school enrollment data, and the words of
community members show racial and socioeconomic divides within the Battle
Creek community. Battle Creek is a community with sharp differences between
districts and neighborhoods, reflected by community racial and socioeconomic
demographics.
Race, Ethnicity, and Language
All communities in the Battle Creek region are predominately White (see Table
2). Of the districts, the majority of African American community members reside
within the Battle Creek School District boundaries. Battle Creek also has a
growing Asian and Hispanic community. The neighborhoods within the Battle
Creek Public School catchment have the highest concentrations of poverty.
Lakeview has a small, but growing African-American community, and a shrinking
White community. It also has a small, but growing Hispanic community.
Similarly, Pennfield has a small African American community in the area closest
to Battle Creek. The community of Harper Creek is predominantly White and
unchanged relative to the rest of the Battle Creek area.
11 | EQUITY AND EXCELLENCE IN COLLEGE AND CAREER READINESSIn 2014, an estimated 89,124 people lived in the school districts of Battle Creek,
Pennfield, Lakeview, and Harper Creek. Nearly half of area residents (42,836)
lived in Battle Creek, and nearly four out of five residents in the area were
White. In Battle Creek, Black residents comprised 22 percent of the population.
Table 2: Battle Creek Community Demographics
District Total Population Percent White Percent Black Percent Other
Races
Battle Creek Public Schools 42,836 69.05 22.07 8.89
Harper Creek Community Schools 15,149 93.50 2.89 3.61
Lakeview School District 21,780 83.53 6.67 9.80
Pennfield School District 9,359 90.27 4.88 4.85
Total 89,124 78.97 13.24 7.79
Data source: American Community Survey 2014 5-Year Estimates; variable B02001
It is important to note that the demographics of the larger communities do not
necessarily match the demographics of the students attending school in each
district. While enrollment data from mischooldata.org show that the overall
school demographic data is similar to the community data, there are key
demographic differences of note across districts as well as key differences
between community and school demographics.
Combined, the student population is predominately White, and more than 50%
of the student population is low-income. However, the demographics of the
schools differ significantly between districts. The 5,435 PreK-12 students who
attended Battle Creek Public Schools for the 2015-2016 school year were
characterized by higher proportions of students of color and economically
disadvantaged students than in Michigan overall. As such, Battle Creek Public
Schools is both the largest of the school districts and the most
Battle Creek Public Schools is both the diverse, with more than two-thirds of its student body identifying as
largest of the school districts and most some race other than White. Additionally, nearly two-thirds of
diverse, with more than two-thirds of its students in the school district are from low-income backgrounds,
student body identifying as some race and one out of every twelve students are designated as English
other than White. language learners (see Table 3). The 4,046 PreK-12 students who
attended Lakeview School District Schools for the 2015-2016 school
year were similar to students in Michigan overall, with somewhat
lower proportions of Black/African American students and slightly higher
proportions of Asian American students, multiracial students, and English
Language Learners. Approximately half of all students in Lakeview School District
schools come from low-income backgrounds, and similar to Battle Creek Public
Schools, more than 8% of the student population are designated as English
language learners. The 2,712 PreK-12 students who attended Harper Creek
Community Schools for the 2015-2016 school year were characterized by higher
proportions of White students and lower proportions of English Language
Learners than in Michigan overall. Similarly, the 2,175 PreK-12 students who
12 | EQUITY AND EXCELLENCE IN COLLEGE AND CAREER READINESSattended Pennfield Schools for the 2015-2016 school year were characterized
by higher proportions of White students than in Michigan overall. Relative to the
combined enrollment, students of color are underrepresented in both Harper
Creek and Pennfield. Harper Creek and Pennfield do, however, have
proportionate shares of low-income students enrolled in their districts.
Comparing community demographics to district enrollment, while about 70
percent of people living in the Battle Creek Public Schools catchment area were
White, only 36 percent of students attending Battle Creek Public Schools were
White (see also Table 3). Similarly, even though Black residents comprised 22
percent of Battle Creek Public School zoned district, Black students made up 37
percent of students attending Battle Creek Public Schools. This disparity may be
indicative of a number of things; for example, a disproportionate number of
White students zoned for Battle Creek Public Schools may use school choice
policies to attend neighboring districts.
Table 3: PreK-12 Student Population Demographics for Battle Creek Area School Districts and All Michigan Districts
Combined, 2015 – 2016
Battle Creek Harper Creek Lakeview Pennfield Michigan
Public Schools Community School District Schools
Schools
All Students (N) 4,474 2,712 4,046 2,175 1,540,005
Gender
Female 47.5 48.9 50.2 50.9 48.5
Male 52.5 51.1 49.8 49.1 51.5
Race or Ethnicity
Asian American 4.7 0.8 8.2 0.4 3.1
Black or African American 36.5 2.1 9.2 4.8 18.2
Hispanic or Latino 12.0 4.8 9.1 4.7 7.4
Two or More Races 10.1 5.0 10.1 5.8 3.4
White 36.1 86.2 62.9 83.2 67.1
Other Races 0.6 1.1 0.5 1.1 0.8
Economic Background
Disadvantaged 64.5 39.1 49.2 44.1 46.3
Not Disadvantaged 35.5 60.9 50.8 43.7
English Language Learner Status
ELL 8.5 1.6 8.2 * 5.9
Not ELL 91.5 98.4 91.8 >99.0 94.1
Notes: Data are drawn from mischooldata.org and represent an unduplicated count (pupil headcount) of students attending
schools within the district/state. Because fewer than 10 English Language Learners attended Pennfield schools, specific
frequencies were not reported by the state. Additionally, it has been suggested that the data under reports the number of
students who might be from low-income backgrounds. This is because some districts provide free meals for all students, and thus
there is no real incentive for families to complete the forms used in the calculation of economic disadvantage.
13 | EQUITY AND EXCELLENCE IN COLLEGE AND CAREER READINESSIncome and Earnings
The socioeconomic data
Figure 1: Annual Household Earnings tends to mirror the racial
demographic data; that is,
70% areas with highest
59.8%
60% concentrations of people
of color are the same areas
50%
Percent of Households
44.2% with lowest average
38.5% household income. As
40% 35.4%
29.8% such, communities marked
30% by racial divides are often
20% 17.6% similarly divided in terms of
12.4% 12.9% 12.8% class (see Figure 1). Across
7.7%
10% 4.7% 4.9% the four districts, about 9
percent of households
0%
Battle Creek Public Harper Creek Lakeview School District Pennfield Schools earned less than $10,000
Schools Community Schools per year, 21 percent
Less than $10,000 Less than $20,000 Less than $40,000 earned less than $20,000
per year, and 49 percent
earned less than $40,000
per year (Figure 1). In Battle Creek, 12 percent of households earned less than
$10,000 annually, compared to just 4.7 percent in Harper Creek.
On average, Battle Creek has lower levels of household income, compared to
the other three districts (see Table 4). The average household income across the
four school districts was $55,820. In the Battle Creek Public Schools catchment,
Figure 2: Map of Annual Household Earnings
14 | EQUITY AND EXCELLENCE IN COLLEGE AND CAREER READINESSthe average household income was $41,335. Comparatively, Pennfield has an
average household income of almost $58,966, and Lakeview and Harper Creek
both have average household incomes of above $70,000, though as the map
indicates there are wide ranges of income in each of the districts (see Figure 2).4
Table 4: Average Household Income by District
District Average Household Income
Battle Creek Public Schools $41,335
Harper Creek Community Schools $75,587
Lakeview School District $71,559
Pennfield School District $58,966
Data source: American Community Survey 2014 5-Year Estimates; variable B19025 Aggregate Household Income in the past 12
months
This is not to say that there are not residents in each district who are impacted
by poverty. The 2014 American Community Survey estimated that 21.8 percent
of the total Battle Creek population fell below the federal poverty level; among
children under 18, the rate of poverty increased to 32.3 percent. Among the
four school districts, both overall poverty and child poverty were highest in
Battle Creek Public Schools; 27 percent of the total population lived below the
poverty line, as did 38 percent of children. In the other three school districts,
adult and child poverty rates were significantly lower than those in Battle Creek
Public Schools, and there was less of a disparity between adult and child poverty
rates (see Figure 3). In 2015, the federal poverty level for a family of four was
defined as a combined household income of less than $24,250.
Approximately 3.3 percent of area residents speak Spanish at home, according
to Census estimates; about two-thirds of Spanish speakers are located in the
Battle Creek Public Schools catchment area. Seventy-six percent of Spanish
speakers also speak English
“very well.”
Figure 3: Poverty Rates of Total Population and Children Under 18
The U.S. Census estimates
45% that approximately 1.6
40% 38% percent of Battle Creek Public
35% Schools and 1.3 percent of
Percent Below Poverty Line
27% Lakeview residents speak
30%
“other Asian languages” (e.g.,
25%
a language outside the major
20%
14% languages including Chinese,
15% 13%
12% Japanese, Korean, and
9% 10% 10%
10% Vietnamese). Only 18 percent
5% of these residents speak
0% English “very well.” While not
Battle Creek Public Harper Creek Lakeview School Pennfield School explicitly captured in the
Schools Community Schools District District
4 In Michigan, the average Total
household income during the
Population same time
Children period
Under 18 was $65,790.
15 | EQUITY AND EXCELLENCE IN COLLEGE AND CAREER READINESSCensus data, based on conversations within the community, it is reasonable to
assume that a significant number of these residents speak some dialect of
Burmese.
Employment
Hand-in-hand with income and earnings is employment. According to 2014 ACS
estimates, 18 percent of residents over the age of 16 in the Battle Creek Public
Schools district were unemployed, compared to 5 percent in Harper Creek, 8
percent in Pennfield, and 7 percent in Lakeview. In Battle Creek, Black residents
were more likely than White residents to be unemployed. Data from the Bureau
of Labor Statistics indicates that as of July 2016, the unemployment rate in the
Battle Creek metropolitan area was 5.0 percent This represents a significant
decrease in the unemployment rate from a peak of 13.2 percent in July 2010.
Table 5: Unemployment by District and Race
District Total Unemployment White (Non-Hispanic) Black Unemployment
Rate Unemployment Rate* Rate*
Battle Creek Public Schools 18.09 14.59 26.83
Harper Creek Community Schools 5.09 5.23 0.00
Lakeview School District 7.49 8.68 6.43
Pennfield School District 8.08 8.61 0.00
Data source: American Community Survey 2014 5-Year Estimates; variables B23025, C23002A, C23002B, C23002H, C23002I
Notes: The unemployment rates reported here are from the American Community Survey 5-Year estimates released in 2014.
They are not the unemployment rates released monthly by the Bureau of Labor Statistics. The unemployment rates reported
here reflect data collected in the five years prior to the data’s release.
Manufacturing jobs dominated the job market in the area, with 8922 jobs in the
sector, or 22 percent of all jobs. Manufacturing jobs were located almost
exclusively in Battle Creek. Jobs in the healthcare sector comprised 20 percent
of all jobs; accommodation and food services and the retail trade sectors each
comprised 11 percent of all jobs in the area.
Table 6: Major Job Sectors by School District
District Top Job Sectors
Battle Creek Public Schools Manufacturing (33.6%)
Health care and social assistance (22.7%)
Professional, Scientific, and Technical Services (7.3%)
Harper Creek Community Schools Accommodation and Food Services (36.4%)
Retail Trade (31.2%)
Health Care and Social Assistance (5.9%)
Lakeview School District Accommodation and Food Services (20.9%)
Health Care and Social Assistance (18.5%)
Retail Trade (16.9%)
Pennfield School District Health Care and Social Assistance (25.8%)
Educational Services (21.6%)
Retail Trade (10.7%)
16 | EQUITY AND EXCELLENCE IN COLLEGE AND CAREER READINESSAccording to employment data from the U.S. Census, 25,404 people work in
Battle Creek. Of these, 78.5 percent (19,943) live outside of the Battle Creek
school district, and 21.5 percent both live and work within the district region.
Nearly 8000 Battle Creek residents travel outside district boundaries for work.
Table 7: Employment Inflow and Outflow
District Live outside district and Live and work in district Live in district and work
work in district outside district
Battle Creek Public Schools 19,943 5461 7935
Harper Creek Community Schools 4374 531 7049
Lakeview School District 7269 1111 7935
Pennfield School District 1225 222 4212
Educational Attainment
Educational attainment levels varied widely amongst residents of the four
school districts. In Battle Creek, 20 percent of residents had earned at least an
Associate’s degree, compared to 35 percent in Harper Creek, 39 percent in
Lakeview, and 29
percent in Pennfield.
Figure 4: Educational Attainment in the Battle Creek Community Fourteen percent of
Battle Creek residents
did not hold a high
Pennfield Schools 8% 33% 30% 10% 13% 6% school diploma or GED.
Although students
from across all four
Lakeview School District 6% 28% 27% 8% 21% 10% districts voiced
postsecondary
aspirations, their local
Harper Creek Community Schools 6% 35% 23% 12% 16% 6%
communities vary
considerably in the
proportion of adults
Battle Creek Public Schools 13% 40% 27% 8% 8% 3%
with postsecondary
credentials..
0% 10% 20% 30% 40% 50% 60% 70% 80% 90% 100%
No Schooling Less than HS Diploma HS Diploma or GED
Some college (No degree) Associate's Degree Bachelor's Degree
Master's Degree or Higher
17 | EQUITY AND EXCELLENCE IN COLLEGE AND CAREER READINESSYou can also read