Estimate of General Revenue - Adopted FY 2021 - Prince William County ...
←
→
Page content transcription
If your browser does not render page correctly, please read the page content below
Estimate of
General Revenue

    Adopted FY 2021
Prince William County

     BOARD OF COUNTY SUPERVISORS

           ANN B. WHEELER – At-Large
                    Chair

       VICTOR S. ANGRY – Neabsco District
                   Vice-Chair

      ANDREA O. BAILEY – Potomac District

     JEANINE M. LAWSON – Brentsville District

            YESLI VEGA – Coles District

     PETE K. CANDLAND – Gainesville District

      KENNY A. BODDYE – Occoquan District

MARGARET ANGELA FRANKLIN – Woodbridge District

           CHRISTOPHER E. MARTINO
                County Executive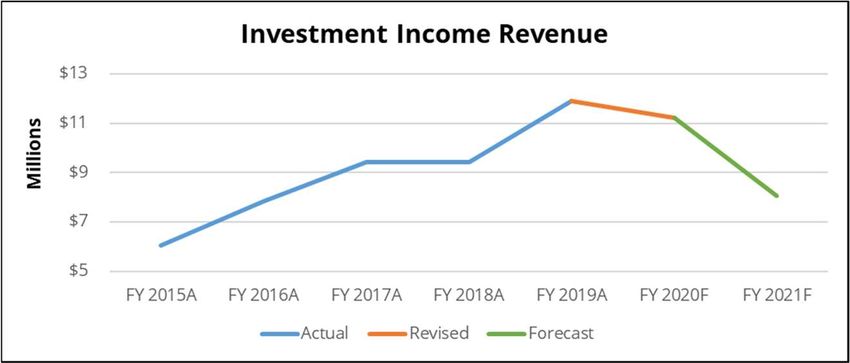
DIRECTOR OF FINANCE/CFO
                                        Michelle L. Attreed

                                   DEPUTY FINANCE DIRECTOR
                                       Timothy M. Leclerc

                                         REVENUE COMMITTEE
                            Michelle A. Casciato, Deputy County Executive
                              Elijah T. Johnson, Deputy County Executive
                              Rebecca Horner, Deputy County Executive
                                     Dave Sinclair, Budget Director
                             Tom Smith, Acting Director of Public Works
                            David C. Westcott Jr., Legislative Affairs Liaison
                            Wade Hugh, Director of Development Services
                            Ann Marie Maher, Director, Office of Tourism
                              Rebecca Horner, Acting Planning Director
                   Christina M. Winn, Executive Director, Economic Development
John M. Wallingford, Associate Superintendent for Finance and Risk Support Services, PWC Schools
                     Lisa Thorne-Izes, Director of Financial Services, PWC Schools

                                           PROJECT MANAGER
                Lillie Jo Krest, Assistant Director of Finance for Treasury Management

                                  FINANCE DEPARTMENT STAFF

                    Bart Cecil                                         Brad Norris
                Susan Rodeheaver                                   Svetlana Olchevski
                   Rocio Lamb                                         Endora Matei
                 Paul Velasquez                                      Allison Lindner
                  Jessica Meade                                        Kerem Oner
                 Melissa Korzuch                                        Terri Whitt
                    Viicky Silor

                                  COUNTY DEMOGRAPHER
                     Brian Engelmann, Department of Information Technology
The Revenue Committee Expresses its Appreciation to the
 Public and Private Sector Business Community for their
      Assistance in the Development of this Report

                      JOHN R. LAYMAN
                       Senior Economist
               Virginia Department of Taxation

                     SONYA R. WADDELL
Vice President and Economist, Regional and Community Analysis
             The Federal Reserve Bank of Richmond

NORTHERN VIRGINIA BUILDING INDUSTRY ASSOCIATION
             Prince William Chapter
                 Sherman Patrick
                     Ben Sage
                 Coleman Rector
                   Truett Young

                 ASSOCIATION OF REALTORS
                    Prince William (PWAR)
                          Liz Hernandez
                          April Thomas
       Lisa Sturtevant, Virginia Realtors, Chief Economist

                COMMERCIAL DEVELOPERS
                         Jim Mertz
                         Russ Gestl
 Mike Garcia, Chairman, Commercial Development Committee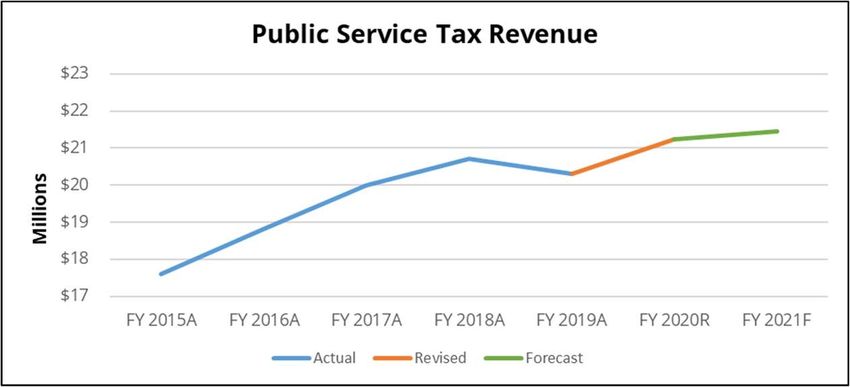
TABLE OF CONTENTS

ECONOMY AT-A-GLANCE .................................................................................................. 1
LOCAL REAL ESTATE MARKET AT-A-GLANCE ................................................................... 3
REAL ESTATE TAX RATE AND MAJOR REVENUE SOURCES.............................................. 4
        FY 2021 Adopted Real Estate Tax Rate and Average Tax Bill ......................... 4
        Major Revenue Sources ..................................................................................... 4
        Key Assumptions ................................................................................................ 5
REAL PROPERTY REVENUE ................................................................................................ 6
       Real Estate Taxes ................................................................................................ 6
       Residential Real Estate ....................................................................................... 6
       Residential Appreciation .................................................................................... 7
       Apartments Market Value Change.................................................................... 8
       Residential New Construction Units ................................................................. 8
       Residential Values per New Unit ....................................................................... 8
       Commercial Real Estate ..................................................................................... 9
       Real Estate Exonerations ................................................................................. 10
       Public Service Taxes ......................................................................................... 11
       Real Estate Tax Deferrals ................................................................................. 11
       Land Redemption ............................................................................................. 12
       Real Estate Penalties ........................................................................................ 12
       Interest on Taxes .............................................................................................. 12
PERSONAL PROPERTY REVENUE .................................................................................... 12
      Vehicles .............................................................................................................. 12
      Car Tax Relief .................................................................................................... 13
      Personal Property Tax Estimate on Vehicles ................................................. 13
      Motor Vehicle License Fee ............................................................................... 14
BUSINESS TANGIBLE........................................................................................................ 15
       Personal Property Tax Estimate on Business Tangible Property ................ 15
       Personal Property Prior Year........................................................................... 15
       Personal Property Deferrals ............................................................................ 16
       Personal Property Penalties - Current Year ................................................... 16
LOCAL SALES TAX REVENUE............................................................................................ 16
CONSUMER UTILITY REVENUE........................................................................................ 17
COMMUNICATIONS SALES AND USE TAX REVENUE..................................................... 18
BPOL REVENUE ................................................................................................................ 20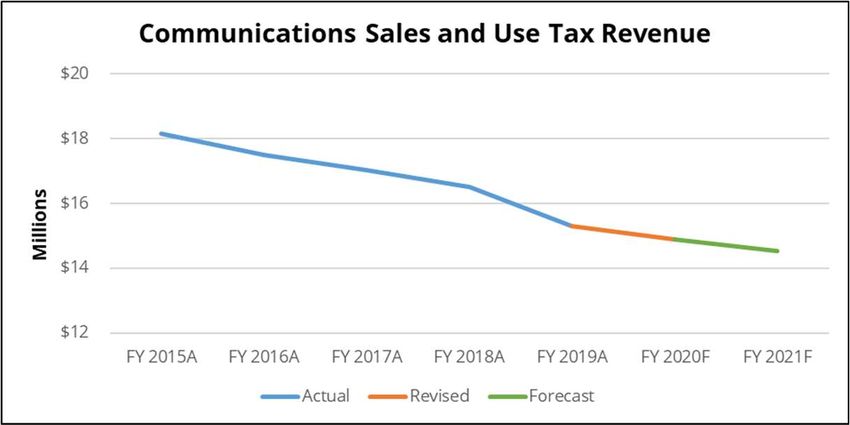
INVESTMENT INCOME ..................................................................................................... 20
ALL OTHER REVENUE SOURCES ..................................................................................... 22
       Recordation Tax ................................................................................................ 22
       Tax on Deeds .................................................................................................... 23
ADDITIONAL REVENUE SOURCES ................................................................................... 24
       Daily Rental Equipment Tax ............................................................................ 24
       Bank Franchise Tax .......................................................................................... 24
       BPOL Taxes - Public Service ............................................................................. 24
       Transient Occupancy Tax................................................................................. 25
       Interest Paid to Vendors .................................................................................. 25
       Interest Paid on Refunds ................................................................................. 25
       Rolling Stock Tax ............................................................................................... 25
       Passenger Car Rental Tax ................................................................................ 26
       Manufactured Home Titling Tax ..................................................................... 26
       Payments in Lieu of Taxes (PILT)..................................................................... 26
Economy At-A-Glance
           The County’s revenues are affected, in varying degrees, by economic conditions at the
           national, state and local levels. The charts that follow identify some of the key indicators1
           for the national, regional, and local economies and show trends year-over-year (Y-O-Y). A
           “green” symbol indicates a positive trend, a “yellow” symbol signals a cautionary or
           neutral trend and a “red” symbol represents a negative trend.

                                                                                                                               Trend
            Indicator                                                      Explanation
                                                                                                                               (Y-O-Y)
                                                                           Reflects changes in the purchasing power
            CPI
            (Consumer Price Index)
                                                  1.5%         1.9%        per unit of money (inflation/ deflation)
                                                                           Unadjusted year/year
                                                                                                                                    ●
                                                (Mar 2020)   (Mar 2019)

            GDP
            (Gross Domestic Product)
                                                  -4.8%        3.2%
                                                                           Indicator of the overal health of the U.S.
                                                                           economy                                                  ●
                                                (Q1 2020)    (Q1 2019)
            Stock Market

                           S&P 500              2,584.59     2,834.40
                                                                           Indicator of the overall health of the U.S. stock
                                                                           market                                                   ●
                                                (03/31/20)   (03/31/19)

                          Dow Jones             21,971.16    25,928.68
                                                                           Indicator of the overall health of the U.S. stock
                                                                           market                                                   ●
                                                (03/31/20)   (03/31/19)

            Federal Funds Rate                    0.08%        2.43%       Indicator of return on investments
                                                                                                                                    ●
                                                (03/31/20)   (03/31/19)
            Unemployment Rate ◊
                                                                           Indicator of overall health of the U.S. job
                           National               4.4%         3.8%        market
                                                                           Seasonally adjusted
                                                                                                                                    ●
                                                (Mar 2020)   (Mar 2019)

                              State               3.3%         2.9%
                                                                           Indicator of overall health of the VA job market
                                                                           Seasonally adjusted                                      ●
                                                (Mar 2020)   (Mar 2019)
                                                                           Indicator of overall health of the NoVa job
                             Region               3.4%         3.3%        market
                                                                           Not seasonally adjusted
                                                                                                                                    ●
                                                (Mar 2020)   (Mar 2019)
                                                                           Indicator of overall health of the PWC job
                  Prince William County           3.0%         2.8%        market
                                                                           Not seasonally adjusted
                                                                                                                                    ●
                                                (Mar 2020)   (Mar 2019)
            ◊ Bureau of Labor Statistics - U3

1
    Data is subject to revisions.
                                                                       1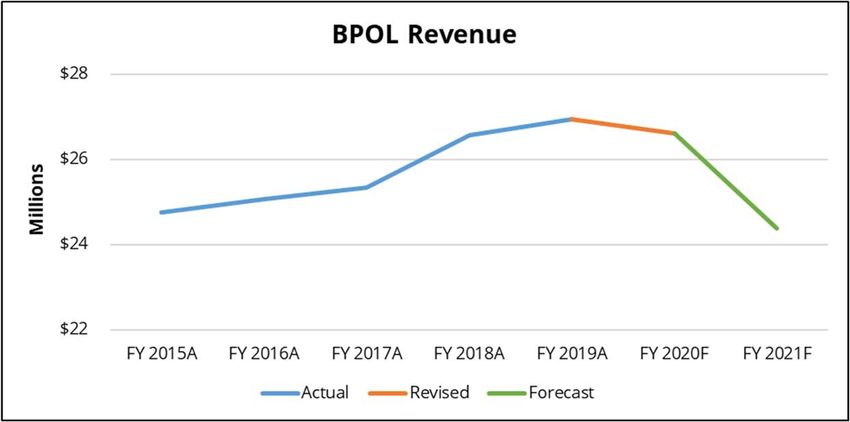
Indicator                                                  Explanation                                                     Trend

National Retail Sales             -8.3%         1.6%
                                                           Indicator of relative health of U.S. economy
                                                           Not seasonaly adjusted                                          ●
                                 (Mar 2020)   (Mar 2019)   MOM (month-over-month)
Employment Establishments◊

                  State
                                 279,643
                                 (+2.7%)
                                              272,163      Indicator of overall health of VA economy, businesses & job
                                                           market                                                          ●
                                 (Q3 2019)    (Q3 2018)
             Region
    (Washington - Alexandria -
           Arlington)
                                 90,664
                                 (-0.4%)
                                               91,051      Indicator of overall health of NoVa economy, businesses & job
                                                           market                                                          ●
                                 (Q3 2019)    (Q3 2018)

      Prince William County
                                  9,553
                                 (+3.3%)
                                               9,252       Indicator of overall health of PWC economy, businesses & job
                                                           market                                                          ●
                                 (Q3 2019)    (Q3 2018)    YOY (year-over-year)
Sales Tax Growth

                  State           +8.4%

                                 (Mar 2020)
                                               +3.5%

                                              (Mar 2019)
                                                           Indicator of overall health of VA economy

                                                           FYTD (fiscal year-to-date)
                                                                                                                           ●
      Prince William County       +5.7%

                                 (Mar 2020)
                                               +6.2%

                                              (Mar 2019)
                                                           Indicator of relative health of PWC economy

                                                           FYTD (fiscal year-to-date)
                                                                                                                           ●
State Revenue Collections         +6.6%

                                 (Mar 2020)
                                               +3.0%

                                              (Mar 2019)
                                                           Indicator of relative health of VA economy
                                                                                                                           ●
National Automobile Sales        14.79 M      16.49 M
                                                           Indicator of consumer purchasing power
                                                           Seasonally Adjusted at Annual Rates                             ●
                                 (Mar 2020)   (Q1 2019)

Commercial Vacancy Rates           5.6%         5.4%
                                                           Indicator of overall health of PWC businesses and commercial
                                                           market                                                          ●
                                 (Q1 2020)    (Q1 2019)
◊ Bureau of Labor Statistics

                                                             2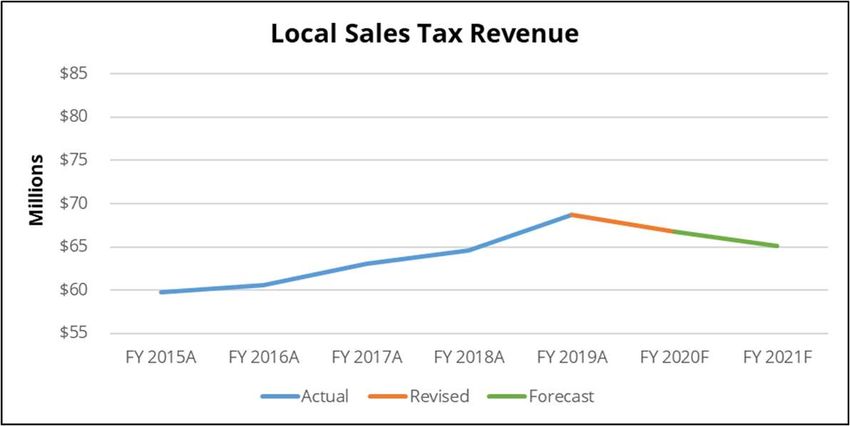
Local Real Estate Market At-A-Glance
           The chart below presents some of the key indicators2 for the local real estate market and
           shows trends year-over-year (Y-O-Y).

            Indicator                                                 Explanation                                          Trend

            Average Sales Price
            (MRIS)
                                            $432,656
                                             (+9.9%)
                                                         $393,699     Indicator of relative health of the housing market
                                                                      YOY (year-over-year)                                 ●
                                            (Mar 2020)   (Mar 2019)

            # of Homes Sold
                                              589
                                            (+4.1%)
                                                           566        Indicator of relative health of the housing market
                                                                      YOY (year-over-year)                                 ●
                                            (Mar 2020)   (Mar 2019)

            Average # of Days on Market
                                               22
                                            (-31.3%)
                                                            32        Indicator of relative health of the housing market
                                                                      YOY (year-over-year)                                 ●
                                            (Mar 2020)   (Mar 2019)

            # of Occupancy Permits Issued
                                              1,171
                                            (-12.9%)
                                                          1,344       Indicator of relative health of the housing market
                                                                      YOY (year-over-year)                                 ●
                                            (CY 2019)    (CY 2018)

            # of Building Permits Issued
                                             1,177
                                            (-3.2%)
                                                          1,216       Indicator of relative health of the housing market
                                                                      YOY (year-over-year)                                 ●
                                            (CY 2019)    (CY 2018)

            Ratio of Homes on the Market
            to Homes Sold
                                               1.01
                                            (-30.3%)
                                                           1.45
                                                                      Indicator of relative health of the housing market
                                                                                                                           ●
                                            (Mar 2020)   (Mar 2019)

2
    Data is subject to revisions.
                                                                      3
Real Estate Tax Rate and Major Revenue Sources
FY 2021 Adopted Real Estate Tax Rate and Average Tax Bill
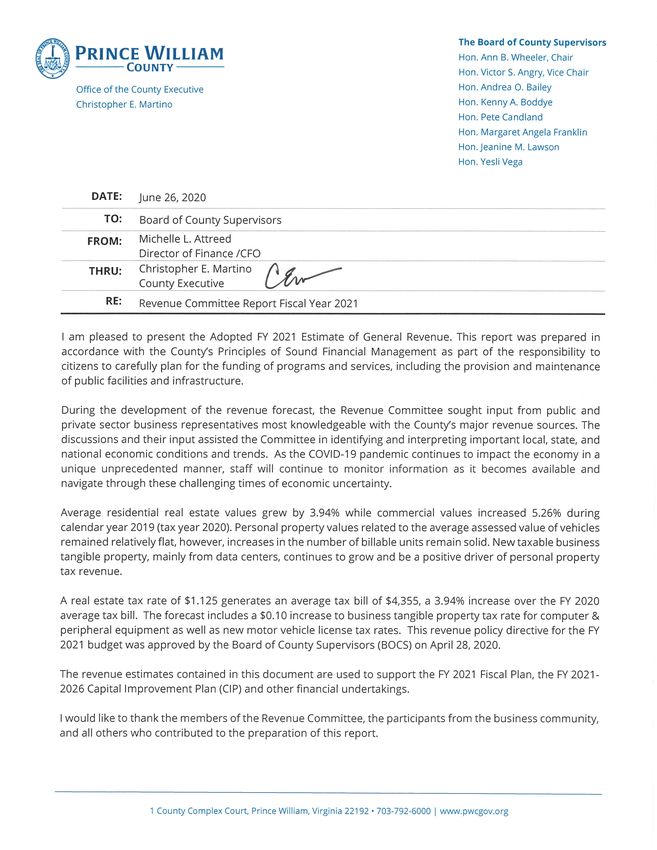
On April 28, 2020, the Board of County Supervisors adopted the Fiscal Year 2021 Fiscal
Plan. The adopted real estate tax rate of $1.125 has the following tax bill impacts on
property owners:
Average real estate tax bill on existing, residential properties will increase $165 or
3.94%; and
Average real estate tax bill on existing, commercial properties will increase 5.26%.
Major Revenue Sources
% to Total FY 2021
($ in 000s) (FY 21) Forecast
Real Estate Tax Rate: $1.125
Real Estate Taxes 65.63% $722,258
Personal Property Taxes 20.03% $220,440
Sales Tax 5.92% $65,130
Consumer Utility Tax 1.34% $14,700
Communications Sales Tax 1.32% $14,530
BPOL Tax 2.21% $24,375
Investment Income 0.73% $8,050
All Other 2.82% $31,000
Total General Revenue 100.00% $1,100,483
School Portion $625,342
County Portion $469,351
Transportation Fund $5,790
Total General Revenue $1,100,483
4Key Assumptions
The following sections of this report contain the key assumptions that were the topic of
discussion at the Revenue Committee Meetings. The comments and insights from public
and private sector participants contributed to the formation of these assumptions.
FY 2021 GENERAL COUNTY REVENUE ESTIMATE BY CATEGORY
FY 2021
GENERAL REVENUE SOURCE Forecast
Real Estate (Gross Local Revenue) 40010 $ 737,693,000
Real Estate Exonerations 40020 $ (15,400,000)
Real Estate Tax Relief 40015 $ (23,000,000)
Real Estate $ 699,293,000
Real Estate-Public Service 40041 $ 21,454,000
Real Estate Tax Deferral 40021 $ (500,000)
Land Redemption 40025 $ 315,000
Real Estate Penalties 40160 $ 1,696,000
TOTAL REAL ESTATE $ 722,258,000
Personal Property 40071 $ 218,800,000
Personal Property Prior Year 40072 $ 120,000
Personal Property Exonerations 40079 $ -
Personal Property Tax Deferral 40081 $ (1,000,000)
Personal Property Penalties 40170 $ 2,520,000
TOTAL PERSONAL PROPERTY $ 220,440,000
LOCAL SALES TAX 40210 $ 65,130,000
CONSUMER UTILITY TAX 40220 $ 14,700,000
BPOL TAXES - LOCAL BUSINESSES 40235 $ 24,375,000
INVESTMENT INCOME 40510 $ 8,050,000
COMMUNICATIONS SALES TAX 41339 $ 14,530,000
Interest on Taxes 40140 $ 1,744,000
Daily Rental Equipment Tax 40215 $ 519,000
Bank Franchise Tax 40230 $ 2,300,000
BPOL - Public Utility 40236 $ 1,515,000
Motor Vehicle License 40250 $ 12,840,000
Recordation Tax 40260 $ 7,800,000
Tax on Deeds 40261 $ 2,130,000
Transient Occupancy Tax 40270 $ 1,120,000
Interest Paid to Vendors 40520 $ (150,000)
Interest Paid on Refunds 40521 $ (20,000)
Rolling Stock Tax 41303 $ 93,000
Passenger Car Rental Tax 41304 $ 985,000
Manufactured Home Tilting Tax 41305 $ 44,000
Federal Payment in Lieu of Taxes 41700 $ 75,000
Undistributed & Miscellaneous 41150 $ 5,000
ALL OTHER REVENUE $ 31,000,000
TOTAL GENERAL REVENUE $ 1,100,483,000
5Real Property Revenue
Real estate revenues are broken down into the following categories: general real estate tax,
public service tax, real estate tax deferral, land redemption, and real estate penalties.
Real Estate Taxes
The real estate tax is the single largest revenue source for Prince William County,
contributing approximately 65.63% of general revenues (FY 2021 forecast). This tax is levied
on all land, improvements, and leasehold interests on land or improvements (collectively
called “real property”) except that which has been legally exempted from taxation by the
Prince William County Code and the Code of Virginia. The revenue summary for the general
real estate tax applies only to real property assessed locally3. The graph below shows a five-
year history of this revenue source and the FY21 revenue forecast.
FY Actual % Change
FY 15 $ 541,246,698 5.04%
Real Property Revenue
FY 16 $ 569,594,736 5.24% $750
FY 17 $ 588,085,866 3.25%
FY 18 $ 610,486,700 3.81% $650
FY 19 $ 641,139,857 5.02%
Millions
Current Year
$ 671,723,000 4.77% $550
Adopted
Current Year
$ 673,946,000 5.12% $450
Revised
FY 2015A FY 2016A FY 2017A FY 2018A FY 2019A FY 2020R FY 2021F
Forecast
Actual Revised Forecast
FY 21 $ 699,293,000 3.76%
Residential Real Estate
During calendar year 2019 (CY 2019) the residential real estate market continued to
appreciate at a steady pace. Positive factors, highlighted by strong economic conditions and
low interest rates, helped propel the residential market in the County. Following a 3.40%
increase in values in 2018, the average existing home value increased approximately 3.94%
in 2019. In 2019, foreclosures fell sharply from approximately 340 in 2018 to 114 in 2019.
Bank owned properties and short sales made up approximately 1.5% of all sales that
transacted in 2019, down from 2% in 2018. The average number of days on the market also
declined significantly from 32 days in March 2019 to 22 days in 2020.
The residential real estate market consists of four property types: single-family homes,
townhouses, residential condominiums, and apartments. Duplex units are included within
the townhouse category. The apartment category consists of units within rental apartment
communities and apartment buildings with five or more units.
3
Real property includes residential, apartments, commercial and industrial, and agricultural and resource land
property types.
6Residential Appreciation
The following chart shows a history of actual residential appreciation (excluding rental
apartments) from calendar year 1985 through 2019.
30%
27.20%
25%
20%
17.47%
15% 13.13%
10% 7.62%
5.24%
5% 3.94%
1.40%
0%
-5% -1.79%
-10%
Actual Residential Appreciation
-15%
Forecast: FY21
-20%
Average Residential Real Estate Appreciation
-25% is 4.60%
CPI % Change (Balt/Wash metro area)
-30% -29.35%
-35%
CY85, FY87
CY86, FY88
CY87, FY89
CY88, FY90
CY89, FY91
CY90, FY92
CY91, FY93
CY92, FY94
CY93, FY95
CY94, FY96
CY95, FY97
CY96, FY98
CY97, FY99
CY98, FY00
CY99, FY01
CY00, FY02
CY01, FY03
CY02, FY04
CY03, FY05
CY04, FY06
CY05, FY07
CY06, FY08
CY07, FY09
CY08, FY10
CY09, FY11
CY10, FY12
CY11, FY13
CY12, FY14
CY13, FY15
CY14, FY16
CY15, FY17
CY16, FY18
CY17, FY19
CY18, FY20
CY19, FY21
CY of Value, FY of Revenue
Expected changes in appreciation for residential and apartment properties during the
forecast period are as follows:
Fiscal Year FY 2021
Calendar Year Activity 2019
Landbook Year (real estate) 2020
Appreciation
Residential 3.94%
Apartments 7.00%
The economy of the Washington D.C. Metropolitan area has remained strong and job
growth and median household incomes are likely to remain solid going forward, especially
with Amazon HQ2 moving into Arlington County and the expansion of Micron in the City of
Manassas. The residential market is forecast to continue to see moderate price
improvement over the course of the next few years.
7Apartments Market Value Change
Apartments appreciated roughly 7.0% in value in 2019. The main drivers behind this
appreciation were modest increases in rents while vacancies ticked up slightly and
capitalization rates decreased. Demand for apartments is expected to remain strong due
to affordability challenges presented by residential real estate in general. Appreciation is
projected to continue throughout the forecast period at a somewhat lower rate due to
saturation of the apartment market.
Residential New Construction Units
Growth is defined as the change in assessed value due to the subdivision of land and the
construction of new residential units. Construction taking place in one calendar year affects
real estate revenues two fiscal years later. For example, construction that occurred in
calendar year 2019 will be reflected in the County’s January 1, 2020, land book, which
provides the basis for real estate tax revenue projected to be received in fiscal year 2021.
The table below summarizes the number of newly constructed residential units during the
forecast period.
Fiscal Year FY 2021
Calendar Year Activity 2019
Landbook Year (real estate) 2020
Residential Units Completed
Single Family 670
Townhouse 360
Condominium 90
Apartments 432
The volume of new home starts is expected to remain near current levels. Construction of
new apartment units is expected to add approximately 432 units in FY 2021 due to relative
saturation of the market.
Residential Values per New Unit
The estimated average assessed value of a new home (all types) constructed during
calendar year 2019 is estimated to be approximately $549,138, a 10% increase over the
average assessed value of homes built in 2018. It should be noted that the overall assessed
value of a new home is affected by the mix of single family, townhouse, and condominium
units constructed in any given year.
The estimated average assessed value of a new single-family home is projected to be
approximately $640,050 in 2019. The estimated average assessed value of a new
townhouse and a condominium unit are estimated to approximately be $416,091 and
$362,033, respectively.
8Commercial Real Estate
Calendar year 2019 market activity in Prince William County resulted in commercial
properties appreciating approximately 5.3%. Commercial real estate vacancy rates
improved slightly as the year progressed. The strongest performing sector remained the
industrial properties, which showed approximately 10.0% appreciation.
Commercial appreciation for FY 2021 is forecasted as follows:
Fiscal Year FY 2021
Calendar Year Activity 2019
Landbook Year (real estate) 2020
Commercial Appreciation 5.3%
Average assessed values per square foot for FY 2021 are determined based on the added
building value resulting from new construction completed during calendar year 2019.4
These unit values are adjusted to reflect the general appreciation of commercial properties
during the remainder of the forecast period.
Commercial properties are categorized into the following property types: retail, industrial,
hotel, office, special purpose, and miscellaneous. For FY 2021 (calendar year 2019 market
activity), approximately 1.8 million square feet of commercial space, including powered
shell warehouse data centers, was added to the assessment rolls. New commercial space
added can vary significantly from year to year due to a variety of factors including project
delays and changing dynamics of the commercial environment.
Retail
Approximately 73,000 square feet of new space was added to the retail sector in 2019.
Shopping centers specifically have experienced higher vacancies over the past three years
and are in absorption phase. The demand for retail space remains sluggish while the
capitalization rates are on the uptick.
Industrial
Construction of industrial properties added approximately 1.3 million square feet to the
commercial/industrial base in 2019, including a 352,000 square foot powered shell
warehouse data center. Another 571,000 square feet of industrial space is expected to be
completed in 2020. The current pipeline includes planned projects that should add roughly
400,000 square feet in calendar year 2021 and 300,000 square feet in the following years.
4
Note that increases or decreases in dollars per square foot from one year to the next are not indicative of
appreciation trends. Unit values are based on the contributory value of the new buildings in a category divided by
the added square footage in that category. Building values per square foot vary widely among different building
types within each category and the types of new buildings within categories vary from one year to the next.
9Hotels
In calendar year 2019 two new hotels - Candlewood Suites in Dumfries and Home2 Suites
in Woodbridge – were completed. Three more hotels are expected to be completed in 2020.
Office Buildings
Approximately 63,000 square feet of office space was added in the County in calendar year
2019. The office sector has been in absorption phase since 2010 when vacancies spiked.
Over the past few years, vacancies have been coming down slightly while rents have been
stabilized. Growth within the office sector is expected to be sustained at a low rate during
the forecast period since there is an ample supply of inventory and accordingly very few
projects in the pipeline. Industry experts also point to a growing trend of telecommuting,
office hoteling, and reduced employee workspace as a factor that will continue to stifle
office building construction.
Special Use
Properties within the special use category comprise nursing homes, healthcare facilities,
and other types of properties that have no foreseeable alternate uses. In 2019, an assisted
living facility was added totaling approximately 100,000 square feet. Five more assisted
living facilities totaling 825,000 square feet are planned and expected to be built over the
next few years.
Miscellaneous
Miscellaneous category includes golf courses, taxable schools, and other property types
that do not fit in one of the major categories. In 2019, approximately 125,157 square feet
was added due to the completion of the Lifetime Fitness Facility.
Data Centers
Three full data centers totaling almost one million square feet are under construction with
more planned in the out years. Full data centers are valued by the megawatt power
available to the facility.
Real Estate Exonerations
Estimated real estate tax exonerations are deducted from the gross local real estate tax
revenue to arrive at the net local real estate tax revenue.
Exonerations are decreases in revenue due to assessment reductions, changes in tax
liability, or tax relief programs. Assessment reductions are typically caused by appeals of
assessed values. Changes in tax liability occur when a property transfers from a taxable to
a tax-exempt status. Taxes are also exonerated on properties whose owners qualify for the
Tax Relief Program for the Elderly and Disabled or the Tax Relief Programs for Disabled
Veterans and Surviving Spouses. Tax Relief is expected to increase approximately 10%-15%
in each year of the forecasting period.
10Public Service Taxes
Public service taxes are levied on non-locally assessed properties. The State Corporation
Commission (SCC) assesses all telecommunications companies, water companies,
intrastate pipeline distribution companies, and electric light and power companies. The
Virginia Department of Taxation assesses railroads and interstate pipeline transmission
companies.
Historically, the majority of changes within the public service classification have been
attributable to new construction growth. Public service market values are not subject to the
same market changes as other real estate properties.
FY Actual % Change
FY 15 $ 17,589,241 -0.84%
FY 16 $ 18,830,860 7.06%
FY 17 $ 19,998,125 6.20%
FY 18 $ 20,706,349 3.54%
FY 19 $ 20,295,824 -1.98%
Current Year
$ 20,956,000 3.25%
Adopted
Current Year
$ 21,242,000 4.66%
Revised
Forecast
FY 21 $ 21,454,000 1.00%
Real Estate Tax Deferrals
If unpaid real estate taxes at the end of a fiscal year are less than at the beginning of that
fiscal year, the amount of the reduction is recorded as revenue in real estate tax deferrals.
If unpaid real estate taxes at the end of a fiscal year are more than at the beginning of that
fiscal year, the amount of the increase is recorded as negative revenue in real estate tax
deferrals. Real estate taxes collected after becoming more than three years’ delinquent are
accounted for as land redemption revenue.
The revenue forecast methodology considers an estimate of collections of unpaid taxes up
to five years’ delinquent. This revenue category varies depending on the amount of unpaid
taxes at the end of one year compared to the previous year due to 1) voluntary payment of
taxes, 2) County resources allocated to collection efforts, and 3) the success of those
collection efforts5.
5
The BOCS has continued to support this initiative and at the end of FY 2019, current real estate tax collections were
99.8% of the July 1, 2018, tax levy.
11Land Redemption
Land redemption is the recognition of real estate taxes collected after being more than
three years’ delinquent. The Code of Virginia allows Prince William County to pursue the
collection of delinquent real estate taxes for twenty years. This revenue category varies
depending on the amount of unpaid taxes three years and older, and the level of success
in collecting these past due amounts. A variety of methods are used to enforce the
collection of back taxes, including filing suit to force the sale of the property for unpaid
taxes. Unpaid land redemption taxes, as of June 30, 2019, were $782,528.
Real Estate Penalties
Prince William County assesses a 10% penalty on the late payment of real estate taxes on
the unpaid original tax balance. Interest at the rate of 10% per annum is added to any
unpaid balance beginning on the first day of the month following the original due date.
Revenue from real estate penalties is estimated by applying a fixed percentage
(approximately 0.23%) to the real estate revenue forecast excluding public service
properties.
Interest on Taxes
Delinquent personal property and real estate tax accounts incur interest at 10% of the
unpaid amount the first year. Subsequent years are incurred at 10% or the Internal
Revenue Service (IRS) delinquent tax rate, whichever is greater.
The revenue estimate is computed by multiplying a fixed percentage of 0.19% by the
combined estimate for gross current year real property tax revenue (excluding public
service revenue) and personal property tax revenue.
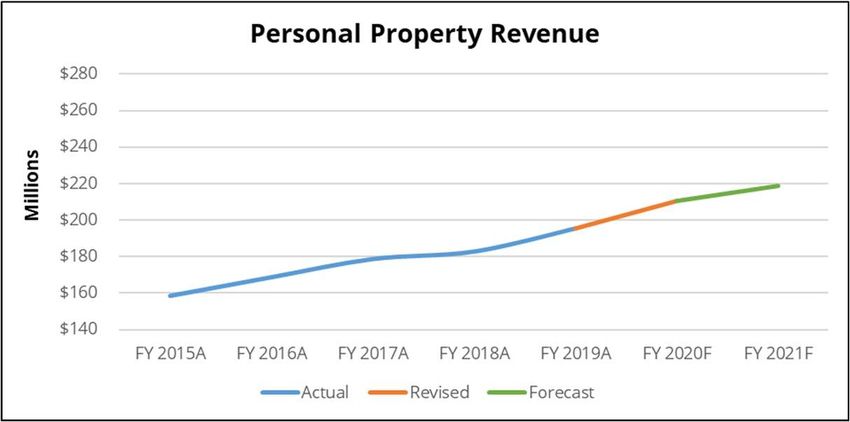
Personal Property Revenue
Vehicles
The personal property tax is assessed on vehicles, mobile homes, and business tangible
property. Approximately 75% of personal property tax revenue is derived from vehicles,
trailers, and mobile homes. The remaining 25% is derived from business tangible property.
12FY Actual % Change
FY 15 $ 158,750,155 5.25%
FY 16 $ 168,957,847 6.43%
FY 17 $ 178,876,546 5.87%
FY 18 $ 182,970,452 2.29%
FY 19 $ 195,606,549 6.91%
Current Year
$ 204,800,000 4.70%
Adopted
Current Year
$ 210,500,000 7.61%
Revised
Forecast
FY 21 $ 218,800,000 3.94%
The County has effectively exempted the personal property tax on several classifications of
personal property by adopting a tax rate of 0.001%. These classifications include farm
equipment, vanpool vans, aircraft, boats, motor homes, camping trailers, horse trailers, and
one vehicle owned by qualifying senior citizens and disabled persons or used by a volunteer
and auxiliary fire and rescue company member who regularly responds to calls or performs
other duties for a volunteer fire company. Other personal property is exempt by federal or
state law, or is granted a local property exemption. These classifications include personal
property used exclusively by churches, personal property owned by federal, state or local
governments, the personal property of non-profit organizations specifically enumerated in
state law, and the personal property of not-for-profits granted property tax exemption by
either the Virginia General Assembly or the Board of County Supervisors. Rental vehicles,
rental equipment, and the personal property of banks and insurance companies is also
exempt because these organizations pay an alternative tax.
Car Tax Relief
The County receives a fixed amount of $54.3 million each year as reimbursement from the
Commonwealth pursuant to the Personal Property Tax Relief Act (PPTRA), §58.1-3524 of the
Code of Virginia, for providing tangible personal property tax relief on qualifying vehicles.
This amount is included in the personal property revenue estimate for each year. The
County has opted to allocate its reimbursement amount from the Commonwealth on a per
vehicle basis. The amount of tax relief allocated to each vehicle changes from year-over-
year based on the number and value of qualifying vehicles. For tax year 2019 (FY 2020), the
reduction in the property tax on qualifying vehicles is equal to 45.0% of the tax on the first
$20,000 of assessed value. The reduction in the property tax was equal to 100% of the tax
for qualifying vehicles assessed at $1,000 or less.
Personal Property Tax Estimate on Vehicles
Personal property tax revenue from vehicles is estimated based on the percentage change
in average assessed value per vehicle and the percentage change in the number of units
billed. The assessed value of taxable vehicles is obtained from standard pricing guides in
13accordance with State law. Prince William County uses the clean trade-in values published
in the National Automobile Dealers Association (NADA) value guide, which covers most
vehicles. Vehicles older than years covered in the guidebook are based on a percentage of
cost, depreciated by 10% for each subsequent year, or are set at a minimum value based
on the model year depending on the information available. Vehicles newer than years
covered in the guidebook are based on a percentage of cost. Trailers are assessed based
on a percentage of cost.
Revenue Value Avg. Units %
Year Value % Change Change
FY 21 $11,174 1.00% 2.43%
The per-unit average value is expected to increase slightly from FY 2020 to FY 2021 based
on information received from NADA. Generally, vehicles depreciate from year-over-year,
but the average includes both vehicles sold or moved out and new vehicles moving in.
Therefore, in many years the average increases. As reported in Automotive News6, the Cox
Automotive's Manheim Used Vehicle Index is expected to be flat to 1% in FY 2021. Thus, the
average value in Prince William County is expected to be mostly flat as well.
The FY 2021 forecast assumes a 2.43% increase in the number of vehicle units billed. The
growth in the number of vehicle units is a result of population and business growth.
Motor Vehicle License Fee
Section 46.2-752 of the Code of Virginia authorizes the County to levy a vehicle license fee.
The amount of the license fee cannot be greater than the annual or one-year fee imposed
by the Commonwealth on motor vehicles. On April 28, 2020, the Board of County
Supervisors adopted7 new motor vehicle license tax rates; $33 per year for each
automobile, truck or motor home normally garaged or parked in the County and $20 fee
per year for each motorcycle. The license fee revenue forecast is derived by multiplying the
license fee by the estimated billable units in the County.
6
Muller, David. “5 used-vehicle trends in 2020.” Automotive News. 30 Dec. 2019. Web. 15 Jan. 2020.
7
Prince William County Code Section 13-78. Prior fees ($24/$12) were in existence since 2006.
14FY Actual % Change
FY 15 $ 8,052,600 1.84%
FY 16 $ 8,260,395 2.58%
FY 17 $ 8,408,654 1.79%
FY 18 $ 8,845,474 5.19%
FY 19 $ 8,986,829 1.60%
Current Year
$ 9,400,000 4.60%
Adopted
Current Year
$ 9,000,000 0.15%
Revised
Forecast
FY 21 $ 12,840,000 42.67%
Business Tangible
Personal Property Tax Estimate on Business Tangible Property
The business portion of the personal property tax is levied on all general office furniture
and equipment, machinery and tools, equipment used for research and development,
heavy construction equipment, and computer equipment and peripherals located in Prince
William County as of January 1st of each year. Each business is required to file a return
annually declaring the item, its original cost, and year of purchase. Therefore, the assessed
value is determined from its original cost, year of purchase, and use of the equipment. On
April 28, 2020, the BOCS adopted a rate of $1.358 (an increase of $0.10). The revenue
forecast for FY 2021 incorporates this increase. General business equipment and heavy
equipment account for approximately 65% of taxes on business equipment. Taxes on
computer equipment and peripherals and machinery and tools account for the remaining
35%.
Taxes from business tangible property are expected to increase 6% in FY 2021. The growth
is driven mainly by increases in the revenue generated by the tax on computer equipment
and peripherals, specifically equipment located in data centers.
Personal Property Prior Year
This account is used to record changes to prior year personal property taxes because of
changes in estimated allowance for uncollectible taxes. These revenues are less than
$200,000 a year and are therefore not addressed in detail.
8
April 28, 2020, Resolution No. 20-330.
15Personal Property Deferrals
If unpaid personal property taxes at the end of a fiscal year are less than at the beginning
of that fiscal year, the amount of the reduction is recorded as revenue in personal property
tax deferrals. If unpaid personal property taxes at the end of a fiscal year are more than at
the beginning of that fiscal year, the amount of the increase is recorded as negative revenue
in personal property tax deferrals.
The revenue forecast is made by estimating collections of unpaid taxes up to five years’
delinquent. This revenue category varies depending on the amount of unpaid taxes at the
end of one year compared to the previous year due to: 1) voluntary payment of taxes, 2)
County resources allocated to collection efforts, and 3) the success of those collection
efforts9.
Personal Property Penalties - Current Year
Prince William County assesses a 10% penalty on the late payment of personal property
taxes. The 10% personal property penalty on late payments applies only to the local share
of the delinquency. The penalty is not applied to the portion paid by the Commonwealth
through the PPTRA.
Personal property penalty revenue is projected to increase in FY 2021 due to the increase
in the estimate of personal property taxes billed each year.
Local Sales Tax Revenue
Prince William County, by adopted ordinance, has elected to levy a 1% general retail sales
tax. This tax is levied on the sale, lease or rental of tangible property, excluding motor
vehicle sales and trailers, vehicle rentals, boat sales, gasoline sales, natural gas, electricity,
and water, and the purchases by organizations that have received tax-exempt status. Sales
tax revenue is collected by the Virginia Department of Taxation and is distributed to the
County monthly. There is a two-month lag between the date of sale and the actual receipt
of funds by the County.
The four incorporated towns within Prince William County (Dumfries, Haymarket,
Occoquan, and Quantico) share in the local sales tax based on the ratio of school age
population in the towns to the school age population of the entire County according to the
latest statewide school census. Therefore, the County realizes approximately 98% of the
monthly sales taxes collected.
9
The BOCS has continued to support this initiative and at the end of FY 2019, current personal property tax collections
for the year ended June 30, 2019, were 97.5%, of the July 1, 2018 tax levy.
16FY Actual % Change
FY 15 $ 59,708,982 5.66%
FY 16 $ 60,550,579 1.41%
FY 17 $ 63,021,936 4.08%
FY 18 $ 64,565,705 2.45%
FY 19 $ 68,699,741 6.40%
Current Year
$ 68,176,000 -0.76%
Adopted
Current Year
$ 66,800,000 -2.77%
Revised
Forecast
FY 21 $ 65,130,000 -2.50%
Sales tax revenue remained strong pre COVID-19. On a year-to-date basis, through March,
sales tax revenue had risen 5.7% versus the 3% estimate. As reported by the
Commonwealth of Virginia’s Secretary of Finance, growth can be attributed to the new
Wayfair related tax dealers. It is anticipated that COVID-19 related impacts such as the
nationwide closing of non-essential businesses, stay-at-home orders, travel restrictions,
social distancing along with consumer uncertainty warrants a decrease of 2.5% in FY 21.
The factors that contribute to the County’s sales tax revenue are:
a strong local economy;
increase in registered remote sellers 10;
stable number of retail establishments buoyed by CARES Act funding and County Small
Business Relief Micro-Grants;
a high level of household income in the County - 2018 median household: $101,059 11;
comparatively lower unemployment rate and increased wage growth; and
continued population growth.
Consumer Utility Revenue
Prince William County levies a consumer utility tax on electric and natural gas utilities. The
County does not tax water and sewer services. Effective January 1, 2001, the Code of
Virginia12 required Prince William County to convert its existing tax on purchasers of natural
gas and electricity from a dollar-based tax to a consumption-based tax.
Since consumer utility taxes are capped, inflation and utility rate increases are not a factor
in the five-year forecast. The FY 2021 forecast reflects a modest increase due to limited new
home construction and possible COVID-19 impacts on household decisions to delay home
purchases due to job losses/furloughs.
10
Effective July 1, 2019 HB 1722/SB 1083 Remote Sales & Use Tax Collection
11
Source: Median household income in the past 12 months (in 2017 inflation-adjusted dollars) - U.S. Census Bureau,
2013-2017 American Community Survey 5-Year Estimates.
12
Code of Virginia §58.1-3814
17FY Actual % Change
FY 15 $ 13,974,213 1.52%
FY 16 $ 13,976,627 0.02%
FY 17 $ 14,195,902 1.57%
FY 18 $ 14,417,046 1.56%
FY 19 $ 14,443,344 0.18%
Current Year
$ 14,590,000 1.02%
Adopted
Current Year
$ 14,590,000 1.02%
Revised
Forecast
FY 21 $ 14,700,000 0.75%
The levy for electricity13 consumption based on kilowatt-hours (kWh) is:
Residential users: $1.40 minimum billing charge plus the rate of $0.01509 on each
kWh delivered monthly by a service provider not to exceed $3.00 per month.
Commercial users: $2.29 minimum billing charge plus the rate of $0.013487 on each
kWh delivered monthly to commercial consumers, not to exceed $100.00 monthly.
The levy for natural gas14 consumption based on 100 units of cubic feet (CCF) is:
Residential consumers: $1.60 minimum billing charge plus the rate of $0.06 on each
CCF delivered monthly to residential consumers, not to exceed $3.00 per month.
Commercial consumers: $3.35 minimum billing charge plus the rate of $0.085 on
each CCF delivered monthly to commercial consumers, not to exceed $100.00
monthly.
The chart below shows the five-year history of electric and gas utility revenue in Prince
William County.
Revenue Utilities
Year Electric Gas
FY 15 1.75% 0.94%
FY 16 0.66% -1.56%
FY 17 1.25% 2.36%
FY 18 1.27% 2.27%
FY 19 0.18% 0.20%
Communications Sales and Use Tax Revenue
Under legislation enacted by the 2006 General Assembly, House Bill 568, the Virginia
communications sales and use tax, also referred to as the communications sales tax,
13
Prince William County, VA-Code of Ordinances Sec. 26-111
14
Prince William County, VA-Code of Ordinances Sec. 26-112
18replaced most of the previous state and local taxes and fees on communications services,
effective on January 1, 2007.
The communications sales tax, imposed on the charge for sale of communications services
at the rate of 5%, is generally collected from consumers by their service providers and
remitted to the Virginia Department of Taxation each month on the following services:
Landline Telephone Satellite Television
Wireless Telephone Paging
Cable Television Voice Over Internet Protocol
As enumerated in § 58.1-662 of the Code of Virginia, the communications sales and use tax
revenue will be distributed to localities according to the percentage of telecommunications
and cable television tax revenue each locality received relative to the statewide total. The
County’s current allocation is 4.63% of the statewide telecommunications sales and use tax.
FY Actual % Change
FY 15 $ 18,146,347 -0.46%
FY 16 $ 17,490,453 -3.61%
FY 17 $ 17,035,603 -2.60%
FY 18 $ 16,509,503 -3.09%
FY 19 $ 15,289,789 -7.39%
Current Year
$ 15,500,000 1.37%
Adopted
Current Year
$ 14,900,000 -2.55%
Revised
Forecast
FY 21 $ 14,530,000 -2.48%
Despite housing growth, this revenue source continues to decline as landline usage
decreases. Preliminary results from the National Center for Health Statistics’ January-June
201915 National Health Interview Survey (NHIS) indicate that the number of American
homes with only wireless telephones continues to grow. The survey states that over one-
half of American homes (59.2%) had only wireless telephones. Additionally, the
Commonwealth’s 2020--2022 biennium budget provides an annual deposit16 to the
Commonwealth’s general fund of $2 million each year, further reducing the revenue that is
allocated to the localities. This revenue source is projected to continue to decline in FY 2021
as uncertainty remains as to when this revenue source will level out.
15
In January 2019, the NHIS launched a redesigned questionnaire.
16
2018 Appropriation Act, Chapter 2 paragraph KK
19BPOL Revenue
The Business, Professional, and Occupational License (BPOL) tax is imposed on commercial
and home occupational businesses operating in Prince William County. The County has
adopted a multiple tax rate schedule according to the type of business activity subject to
the tax. The BPOL tax is currently levied on17:
County businesses with annual gross receipts (from the prior calendar year) greater
than $500,000;
New businesses in the County based on an estimate if gross receipts are greater
than $500,000 for the current year; and
Building contractors located outside the County but performing work within the
boundaries of Prince William County when the amount of work in the County
exceeds the $500,000 threshold.
BPOL revenue is made up of the following components: retail (50%), building construction
(15%), business services (20%), professional services (13%), and hotels and other (2%). The
basis for the FY 2021 BPOL tax revenue is business gross receipts from calendar year 2020.
In most years, the forecast model assumes that BPOL will change at an average close to
growth plus inflation for all business classes. However, at this time, it is challenging to
predict the impacts to many businesses, especially that of retailers and restaurants due to
COVID-19 closures and stay-at-home orders. Accordingly, a conservative decrease of 8.42%
has been made to the FY21 forecast.
FY Actual % Change
FY 15 $ 24,744,036 4.09%
FY 16 $ 25,065,213 1.30%
FY 17 $ 25,340,993 1.10%
FY 18 $ 26,553,957 4.79%
FY 19 $ 26,945,229 1.47%
Current Year
$ 28,000,000 3.91%
Adopted
Current Year
$ 26,615,000 -1.23%
Revised
Forecast
FY 21 $ 24,375,000 -8.42%
Investment Income
Investment income represents interest receipts, interest accrual, and gains or losses from
the sale of investments for Prince William County’s share of earnings on the “general” cash
17
On November 21, 2017, the BOCS amended Prince William County, VA-Code of Ordinances Sec. 11.1-17 to
increase the gross receipts threshold for business from $400,000 to $500,000 for fiscal year 2018 and subsequent
license years thereafter.
20investment portfolio. The general portfolio consists of those funds that are not restricted
such as the proceeds of bond issues that have strict requirements as to how they are spent
and invested. The general fund available cash constitutes 46% to 48% of the total pooled
investments. All funds are invested in accordance with the Code of Virginia and the Board
adopted Investment Policy that sets the County’s investment guidelines based on the core
principles of legality, safety, liquidity, and yield. Prince William County’s investment strategy
addresses these guidelines by investing in a diversified portfolio with specific security types,
financial institutions, and maintaining sufficient liquidity to meet anticipated operating
requirements. In addition, the County seeks to match its cash flow needs to the overall
maturity structure of the portfolio in order to maximize yield.
To forecast investment income, the average portfolio yield and portfolio value are projected
to determine the current or estimated future year’s investment revenue. The general fund
share is calculated based on the prior year actual share of cash balances available to invest.
The average total dollar value of the portfolio is affected by the increase in County revenues
and fund balance. Therefore, the revenue forecast itself becomes a key determinate of
interest income. The table provides the forecasted growth in Projected Portfolio
the portfolio. Increases in portfolio size typically come from Value (in 000s)
additions to fund balance/year-end savings as well as a FY 20 $ 1,205,900
portion of annual revenue growth. FY 21 $ 1,242,100
Prince William County’s portfolio earnings yield is broadly correlated to the Federal Funds
Rate and current holdings in the portfolio. In response to the perceived impact of COVID-
19, the Federal Open Market Committee (FOMC) cut the target Federal Funds rate 150 basis
points in March to a range of 0.00% to 0.25%. The action taken by the FOMC, coupled with
an average interest rate decline of over 135 basis points spanning the County’s investment
horizon, will create downward pressure on interest income earned over the foreseeable
future. Additionally, the timing of security purchases, cash flow requirements, interest rate
environment at the time securities are purchased, and the duration of securities are all
major factors affecting the portfolio’s yield.
FY Actual % Change
FY 15 $ 6,036,382 -11.68%
FY 16 $ 7,832,996 29.76%
FY 17 $ 9,417,266 20.23%
FY 18 $ 9,424,113 0.07%
FY 19 $ 11,893,648 26.20%
Current Year
$ 13,940,000 17.21%
Adopted
Current Year
$ 11,200,000 -5.83%
Revised
Forecast
FY 21 $ 8,050,000 -28.13%
21All Other Revenue Sources
Recordation Tax
A recordation tax is levied when a legal instrument regarding real property such as a deed
or deed of trust is recorded with the Clerk of the Circuit Court. This tax is charged for
transfers in ownership of property, deeds of trust, and mortgage refinancing. On April 28,
2004, the Commonwealth of Virginia increased the State recordation tax rate from $0.15
per $100 of value to $0.25 per $100 of value effective September 1, 2004 (FY 2005). Section
58.1-814 of the Code of Virginia grants Prince William County the authority to levy an
optional, local recordation tax rate equal to one-third of the State recordation tax rate.
Therefore, the local recordation tax rate increased from $0.05 per $100 of value to $0.083
per $100 of value. The forecast reflects only Prince William County’s share of recordation
tax revenue and does not include the state portion of recordation revenue.
Recordation tax revenue is driven by home sale activity and price appreciation as well as
refinance activity. Low mortgage rates coupled with low unemployment rates and high
consumer confidence, continue to encourage market entry. According to the Metropolitan
Regional Information Systems (MRIS) sales data for March 2020, the average residential
sales price of $432,656 is a 9.9 percent increase over March 2019. The number of sales for
the same period totaled 589 units, an increase of 4.06 percent when compared to March
2019 (566 units sold). The County’s residential market remains, mixed with tight inventories
and a decrease in active listings, down 27.9 percent, when compared to the same period in
2019. On average, units are 22 days on the market, a sharp decrease from 32 days the same
period last year. According to the Virginia Realtors March 2020 Virginia Home Sales Report,
“strong economic fundamentals in Virginia should help the Commonwealth weather the
COVID-19 pandemic better than some other places.” The outlook for Virginia’s housing
market in 2020 is positive, though the biggest challenges will be a lack of inventory and
growing affordability challenges. Mortgage rates remain at near-record low levels, which
provides a major incentive to homebuyers. However, uncertainty in the economy and
expected job losses/furloughs may delay home purchases. Accordingly, the FY 2021
forecast reflects a modest decrease of approximately 8.2% as activity slows.
FY Actual % Change
FY 15 $ 7,174,961 14.38%
Recordation Tax Revenue
FY 16 $ 8,383,183 16.84% $10
FY 17 $ 8,965,151 6.94%
$9
Millions
FY 18 $ 7,624,383 -14.96%
FY 19 $ 8,317,640 9.09% $8
Current Year
$ 7,900,000 -5.02% $7
Adopted
Current Year
$ 8,500,000 2.19% $6
Revised
FY 2015A FY 2016A FY 2017A FY 2018A FY 2019A FY 2020F FY 2021F
Forecast
Actual Revised Forecast
FY 21 $ 7,800,000 -8.24%
22On October 26, 2004, the Board of County Supervisors adopted Resolution No. 04-1034,
which earmarks a portion of recordation tax revenues for transportation purposes in the
County. Beginning in FY 2006, recordation tax revenues generated by the rate increase of
$0.033 plus a portion of recordation tax revenues generated from the base rate of $0.05
will be used to improve County roads. The remaining amount of recordation tax revenue is
retained by the County as general revenue. The table below identifies the portion of
recordation tax revenues designated for transportation and general revenue use.
General
Transportation TOTAL
Revenue
FY 21 $ 2,010,000 $ 5,790,000 $ 7,800,000
Tax on Deeds
The tax on deeds is imposed when real estate deeds of conveyance (not deeds of trust) are
recorded with the Clerk of the Circuit Court. It is important to note that the tax on deeds is
not levied on mortgage refinancing. The tax on deeds is levied when:
property ownership changes;
property ownership is conveyed in any manner; or
a legal instrument is recorded with a transfer amount.
The tax on deeds rate is $1.00 per $1,000 of value. The State and locality each receive half
of the revenue generated by this tax (equal to $0.50 per $1,000 of value). The revenue
forecast reflects only Prince William County’s share of revenues.
Similar to the recordation tax, the FY 2021 forecast represents a decrease over the FY 2020
estimate.
FY Actual % Change
FY 15 $ 1,693,083 5.46%
FY 16 $ 2,229,997 31.71%
FY 17 $ 2,184,206 -2.05%
FY 18 $ 2,214,691 1.40%
FY 19 $ 2,369,274 6.98%
Current Year
$ 2,225,000 -6.09%
Adopted
Current Year
$ 2,370,000 0.03%
Revised
Forecast
FY 21 $ 2,130,000 -10.13%
23Additional Revenue Sources
Listed below are additional general revenue sources estimated to be less than $5 million
each. The forecast and a description of each revenue source follows:
FY 2021
All Other Revenue Sources
Forecast
Daily Rental Equipment Tax $ 519,000
Bank Franchise Tax $ 2,300,000
BPOL Public Utility $ 1,515,000
Transient Occupancy Tax $ 1,120,000
Interest Paid to Vendors $ (150,000)
Interest Paid on Refunds $ (20,000)
Undistributed & Miscellaneous $ 5,000
Rolling Stock Tax $ 93,000
Rental Car & Passenger Car Tax $ 985,000
Manufactured Home Titling Tax $ 44,000
Payments in Lieu of Taxes $ 75,000
Total All Other Revenue $ 6,486,000
Daily Rental Equipment Tax
The County levies a daily rental equipment tax of 1% on certified short-term rental
businesses. The tax applies to businesses that rent items held by users for less than 91
consecutive days. Examples of such businesses include bowling alleys, hardware stores,
and equipment rental stores. These businesses are required to collect 1% of the daily rent
and remit it to the County quarterly.
Bank Franchise Tax
The County levies a bank franchise tax on the net capital of each bank, banking association,
savings bank, or trust company that operates in the County. The tax is based on 0.8% of the
net capital multiplied by the percentage of deposits on hand at that branch compared to its
statewide deposits.
BPOL Taxes - Public Service
The Business, Professional, and Occupational License (BPOL) tax is imposed on public utility
companies that operate in the County. The tax of $0.29/$100 of assessed value was identical
to the County’s BPOL tax on other businesses but was authorized under separate statute.
The Commonwealth repealed the tax for electric companies and replaced it with the
Corporate Net Income Tax and the declining Consumption Tax. The State set the latter at a
maximum of $0.50/$100 of assessed value. If a locality’s rate is below the maximum, the
State receives the difference. Therefore, the Board of County Supervisors increased this tax
24only for electric companies from $0.29/$100 of assessed value to $0.50/$100 of assessed
value effective January 1, 2001.
Transient Occupancy Tax
The County levies a transient occupancy tax (TOT) of 5% of the amount charged for the
occupancy of hotels, motels, boarding houses, travel campgrounds and other facilities
offering guest rooms rented out for continuous occupancy for fewer than 30 consecutive
days. This tax does not apply to miscellaneous charges such as in-room telephone usage,
movie rentals, etc. The tax is remitted directly to the County on a monthly basis. The general
revenue share of this tax is 40% and the remaining 60% is budgeted for tourism-related
purposes. Appropriation by the Board of County Supervisors is based on budgetary
requirements requested by the Department of Parks, Recreation, and Tourism. The
transient occupancy tax forecast is based on number of hotel rooms, occupancy rates, room
rates and tourism related events. [Note: There is an additional 2% TOT on the amount of
the charge for the occupancy of any room or spaced occupied in the County, as a member
of the Northern Virginia Transportation Authority (NVTA), that is specifically earmarked for
public transportation purposes in accordance with State statute. This revenue is not
included in the general revenue estimate.]
Interest Paid to Vendors
When a vendor with whom the County does business overpays for any reason, or when a
performance bond is repaid to a developer, the refunded amount includes interest. This
interest is recorded as negative revenue.
Interest Paid on Refunds
The County must pay interest on taxpayer refunds based on delinquent taxes that were
erroneously assessed. This interest is recorded as negative revenue.
Rolling Stock Tax
The rolling stock of railroads and freight car companies doing business in the
Commonwealth is taxed at the rate of $1.00 on each $100 of assessed value. This tax is
levied in lieu of the personal property tax. Revenues are distributed to counties, cities, and
incorporated towns based on: (i) the percentage of track miles located in the locality versus
the state-wide total or (ii) vehicle miles operated by a carrier in the locality versus the state-
wide total.
25You can also read