Joint Dispatch Agreement Energy Imbalance Market Participation Benefits Study
←
→
Page content transcription
If your browser does not render page correctly, please read the page content below
Attachment B
                                                                     Proceeding No. 19M-0495E
                                                                                  Page 1 of 55

                                Joint Dispatch Agreement
                                Energy Imbalance Market
                                Participation Benefits Study

                                PREPARED FOR
                                Black Hills Corporation
                                Colorado Spring Utilities
                                Platte River Power Authority
                                Public Service Company of Colorado
Colorado PUC E-Filings System

                                PREPARED BY
                                Judy W. Chang
                                Johannes P. Pfeifenberger
                                John Tsoukalis
                                Sophie Leamon
                                Carson Peacock

                                January 14, 2020
Attachment B
                                                                            Proceeding No. 19M-0495E
                                                                                         Page 2 of 55

Notice
–––––
         •    This report was prepared for Black Hills Energy, Colorado Springs Utilities,
              Platte River Power Authority, and Public Service Company of Colorado in
              accordance with The Brattle Group’s engagement terms, and is intended to be
              read and used as a whole and not in parts.
         •    The report reflects the analyses and opinions of the authors and does not
              necessarily reflect those of The Brattle Group’s clients or other consultants.
         •    There are no third party beneficiaries with respect to this report, and The
              Brattle Group does not accept any liability to any third party in respect of the
              contents of this report or any actions taken or decisions made as a consequence
              of the information set forth herein.

Copyright © 2020 The Brattle Group, Inc.
Attachment B
                                                                                                                 Proceeding No. 19M-0495E
                                                                                                                              Page 3 of 55

Table of Contents
–––––
Executive Summary ................................................................................................................. ii
I.      Scope of the Study ...........................................................................................................1
II.     Modeling Approach and Assumptions ...........................................................................2
        A.      Review of the MWTG Study Modeling Approach and Assumptions.................4
        B.      JDA Modeling Approach and Assumptions .........................................................5
        C.      Scenarios and Sensitivities Simulated .................................................................13
                1.       Added Transmission Sensitivity ................................................................15
                2.       Natural Gas Price Sensitivity .....................................................................16
III.    Simulation Results .........................................................................................................17
        A.      Quantified Market Participation Benefits ..........................................................18
                1.       Base Case Results ........................................................................................20
                2.       Added Transmission Sensitivity Results ...................................................25
                3.       Natural Gas Price Sensitivity Results ........................................................26
        B.      Simulated Market Transactions and Prices ........................................................29
                1.       Simulated Real-Time Energy Imbalance Market Transactions ...............30
                2.       Simulated Real-Time Energy Imbalance Market Prices ..........................32
        C.      Market Participation Benefits Not Estimated in this Study ..............................34
IV.     Conclusion .....................................................................................................................36
V.      Appendix A: Simulated Real-Time Market Transactions and Prices for
        Sensitivities ....................................................................................................................38
VI.     Appendix B: Technical Description of the PSO Model..............................................44
Attachment B
Proceeding No. 19M-0495E
Page 4 of 55
Executive Summary
–––––
This study was conducted on behalf of the Black Hills Corporation, Colorado Springs Utilities,
Platte River Power Authority, and the Public Service Company of Colorado (together, we refer to
them as the Joint Dispatch Agreement (JDA) “JDA companies” or “JDA entities”). The four JDA
entities were participants in the Mountain West Transmission Group (MWTG) study released in
2017, and the simulations in this study are based on the model developed for that endeavor. We
analyze the production cost benefits from participation in two proposed real-time energy
imbalance markets relative to continued membership in the JDA. The two options for
participation in a broader regional energy imbalance market analyzed are: 1) the Western Energy
Imbalance Market (EIM) that is currently in operation throughout much of the western United
States and is administered by the California Independent System Operator (CAISO), and 2) the
Western Energy Imbalance Service (EIS) proposed by the Southwest Power Pool (SPP).
The production cost benefits presented in this study are only one element of evaluating
participation in a RTO-operated regional wholesale market. The study does not estimate any
production-cost-related impacts beyond those captured in the simulations and the APC metric,
such as discrepancies between congestion charges and congestion hedging or congestion revenue
distribution mechanisms, marginal loss refunds, and the likely significant additional benefits
related to the lower-cost, intra-hour balancing of uncertain loads and renewable generation
achieved in a regional market during real-time operations. As such, the benefits quantified here
are conservative, and likely understate actual achievable production cost savings. Similarly, this
report does not address other considerations related to the formation of, or the participation in, a
regional market such as the implications of alternative market governance structures,
implementation and administrative costs related to market participation, or reliability benefits of
regional market operations.
These energy imbalance market options are simulated across different market participation
scenarios, which analyze different membership options for the four JDA entities and the remaining
six companies of the former MWTG 1. In total, four cases are simulated using 2024 as a test year to
estimate the potential impact associated with the JDA entities participating in the two imbalance
markets considered. These four cases are:
• Status Quo Case: Represents current market operations in the WECC. This includes a
representation of the EIM for all the existing members and the utilities that had
announced publicly at the start of our study that they are planning to join before 2024.
1 The remaining MWTG companies are Basin Electric Power Cooperative, Black Hills Power, Cheyenne
Light Fuel & Power, Tri-State Generation and Transmission Cooperative, and Western Area Power
Administration’s Loveland Area Projects and Colorado River Storage Project.Attachment B
Proceeding No. 19M-0495E
Page 5 of 55
The four JDA entities are represented as participating in the JDA. The other MWTG
members are not represented in any regional market. This case assumes that only the
current imbalance markets operating in the WECC will be operating in 2024, with their
current and already-planned memberships as had been announced at the initiation of
this study in the summer of 2019. The Status Quo Case serves as the baseline against
which the benefits of participation in the EIM or EIS are calculated for the JDA entities.
• JDA in EIM Case: Simulates the four JDA entities as part of the broader Western EIM
footprint. The other MWTG entities are not included in any regional market structure
in this case. The representation of the rest of the WECC is unchanged from the Status
Quo Case. Therefore, the JDA in EIM Case is compared to the Status Quo Case to
estimate the benefit for the JDA companies if only they join the EIM.
• MWTG in EIM Case: Simulates the entire MWTG footprint, including the JDA entities,
participate in the EIM in 2024. The representation of the rest of the WECC is the same
as in the Status Quo Case. Therefore, comparing the MWTG in EIM Case with the
Status Quo Case indicates the benefits if all ten MWTG companies joining the EIM.
• MWTG in EIS Case: Models the full MWTG footprint, including the JDA companies,
in the Western EIS. The representation of the rest of the WECC is the same as in the
Status Quo Case. Comparing the MWTG in EIS Case with the Status Quo Case indicates
the benefits if all ten MWTG companies joining the EIS.
We simulated the entire WECC for this analysis. We used Power System Optimizer (PSO) to
conduct the nodal production cost analysis and simulate the economic unit commitment and
dispatch of generating plants that would be results from a centralized regional wholesale market.
The model developed during the MWTG study was updated with new data inputs provided by the
JDA entities and collected from publicly available data sources to create an updated database
reflecting the expected system conditions for 2024.
The key results metric estimated in this study is the Adjusted Production Cost (APC) of the JDA
entities, which is a high-level approximation of the cost to serve customers. The APC metric
includes production costs of generation resources owned by the JDA entities, and the cost of
market purchases less revenues from market sales. The APC metric also includes applicable make-
whole payments that would be received by the JDA entities from the energy imbalance markets
to compensate them for production costs included in the APC that are not covered by market
revenues. These make-whole payments are called Bid Cost Recovery (BCR) payments in the EIM.
The proposal for the EIS does not include such payments, and are therefore not estimated in this
study. If the EIS implements similar make-whole payments, they would need to be considered as
part of the benefit of participating in that market.
The majority of BCR payments received by JDA resources would be recovered from the JDA
entities themselves, implying that most of the BCR payments are not benefits additive to the JDA
entities’ APC reduction estimated through our simulations. We estimate only the portion of the
BCR payments that are related to EIM exports out of the JDA footprint, which will result in BCR
payments received by the JDA entities, but funded by neighboring EIM entities. The productionAttachment B
Proceeding No. 19M-0495E
Page 6 of 55
costs incurred by following EIM commitment and dispatch instructions, which allow for exports
out of the JDA footprint to occur, are included in the APC metric, implying that any BCR payment
received by the JDA entities to recover those production costs needs to be incorporated in our
benefit calculation.
In this study, we have not conducted any analyses to determine any potential benefits due to the
optimal dispatch of the DC intertie between the JDA entities and the SPP footprint (in the case
where the JDA joins the EIS along with the MWTG) because the current proposal for the EIS
imbalance market does not include the capability for SPP to optimally dispatch the DC interties
that are owned or controlled by potential EIS members. Therefore, we have simulated the power
flows across the interties to be constant across all the cases in this study, based on the hourly flows
provided by the MWTG entities during the MWTG study. Other benefits not quantified in these
market simulations of imbalance markets (neither for EIM or EIS) are noted below.
Table 1 below shows the estimated production cost savings due to market participation for all the
cases simulated. The simulated production cost results for the JDA in EIM, MWTG in EIM, and
MWTG in EIS Cases are compared to the Status Quo Case to determine the reduction in production
cost due to market participation.
Table 1: Summary of Estimated Market Participation Benefits for the JDA Entities
JDA in EIM MWTG in EIM MWTG in EIS
$million/yr % of APC $million/yr % of APC $million/yr % of APC
Adjusted Production Cost Reduction $1.24 0.28% $16.27 3.62% $1.62 0.36%
Bid Cost Recovery Payment $0.74 0.17% $1.07 0.24% N/A N/A
Estimated Market Participation Benefit $1.98 0.44% $17.34 3.86% $1.62 0.36%
The results in Table 1 indicate that the estimated production cost benefit for the four JDA entities
joining the EIM (JDA in EIM Case) are about $1.98 million/year, or 0.44% of production costs.
The estimated production cost benefit for the four JDA entities increases to about $17.34
million/year, or about 3.86% of production costs, if the entire MWTG footprint joins the EIM
together. The estimated production benefits for the JDA entities if the entire MWTG footprint
joins the EIS is about $1.62 million/year, or about 0.36% of production costs. The MWTG in EIM
Case provides the largest reduction in production costs of all three cases relative to the Status Quo
Case. The large reduction in production costs in the MWTG in EIM Case is driven by two factors.
First, the size and generation resource diversity of the EIM footprint provides more opportunity
for trading energy in the imbalance market. The EIM footprint contains a more diverse mix of
generation resources, such as solar in the Southwest and hydro in the Northwest, which creates
more opportunity to economically trade power across the footprint. Second, the additional
transfer capability between the JDA and the EIM footprint available in the MWTG in EIM Case
provides the JDA entities with greater access to the EIM market.
The study includes two sensitivity analyses that test how the production cost benefits of market
participation change under two modeling assumption changes. First, the Added TransmissionAttachment B
Proceeding No. 19M-0495E
Page 7 of 55
Sensitivity simulates the JDA in EIM Case with 200 MW of additional transmission rights to export
from the JDA companies to the EIM footprint. Table 2 shows that the additional 200 MW of export
rights provide $530,000/year of additional benefits in reduced APC for the JDA entities ($1.24
million/year in reduced APC in the Base JDA in EIM in Table 1 vs $1.77 million/year in reduction
in Table 2). In the Added Transmission Sensitivity, increased EIM exports also yield higher BCR
payments received by the JDA entities. As shown, the total benefits from EIM participation in the
Added Transmission Sensitivity are about $3.66 million/year, or 0.82% of production costs.
Table 2: Summary of Estimated Market Participation Benefits for the JDA Entities
Added Transmission Sensitivity
JDA in EIM
$million/year % of APC
Adjusted Production Cost Reduction $1.77 0.39%
Bid Cost Recovery Payment $1.90 0.42%
Estimated Market Participation Benefit $3.66 0.82%
The second sensitivity, the Natural Gas Price Sensitivity, analyzes the effects of changing the
natural gas price assumptions used in the model. The natural gas prices used in this sensitivity are
higher than the natural gas prices used in the Base Cases. This sensitivity also tests an alternative
regional differential between the natural gas prices in Colorado and the Southwest region. The
natural gas price differential between Colorado and the Southwest is relevant because it drives the
potential for economic energy transactions between the JDA and the broader EIM footprint. The
results of the Natural Gas Price Sensitivity are shown in Table 3.
Table 3: Summary of Estimated Market Participation Benefits
Natural Gas Price Sensitivity
JDA in EIM MWTG in EIM MWTG in EIS
$million/year % of APC $million/year % of APC $million/year % of APC
Adjusted Production Cost Reduction $1.30 0.26% $10.66 2.13% $3.45 0.69%
Bid Cost Recovery Payment $0.53 0.11% $1.51 0.30% N/A N/A
Estimated Market Participation Benefit $1.83 0.37% $12.17 2.43% $3.45 0.69%
The results of this sensitivity illustrate two effects of the change in natural gas price assumptions.
First, the JDA in EIM Case results do not change significantly in this sensitivity. The Base JDA in
EIM Case showed a market participation benefit of $1.98 million/year or 0.44% of APC, while the
Natural Gas Price sensitivity shows a benefit of $1.83 million/year or 0.37% of APC. The estimated
production cost benefit for the JDA entities if the entire MWTG footprint were to join the EIM
together (MWTG in EIM Case) is lower than in the Base Cases ($12.17million/year vs $17.34
million/year). This illustrates the effect of the smaller natural gas price differential between
Colorado and the Southwest, as there are fewer economic real-time purchases and sales between
the JDA and the broader EIM footprint. Second, the higher natural gas prices in this sensitivityAttachment B
Proceeding No. 19M-0495E
Page 8 of 55
increase the estimated production cost benefits from having a more diverse fuel mix in the real-
time energy imbalance market footprint, as the production cost savings from fuel switching are
larger with the higher natural gas prices. For example, the former MWTG has a more diverse
generation mix than just the four JDA entities alone, which is why this sensitivity shows higher
production cost benefits for the JDA entities if all the former MWTG members participate in a
single real-time energy imbalance market together. This is illustrated in the MWTG in EIS Case,
which shows an estimated reduction in production costs for the JDA entities of $3.45 million/year
(0.69% of production costs) in the Natural Gas Price Sensitivity compared to a $1.62 million/year
(0.36% of production cost) reduction under the Base set of assumptions.Attachment B
Proceeding No. 19M-0495E
Page 9 of 55
I. Scope of the Study
The Brattle Group was retained by the Black Hills Corporation, Colorado Springs Utilities, Platte
River Power Authority, and the Public Service Company of Colorado (collectively referred to as
the “JDA companies” or “JDA entities”) 2 to analyze how participation in a real-time energy
imbalance market could provide benefits in the form of lowering the overall cost of serving load.
Specifically, this study analyzes the potential generation-related variable costs (production costs)
of serving electricity customers in the JDA under three possible energy imbalance markets:
• The Status Quo: represents staying in the Joint Dispatch Agreement (JDA) as currently
constituted (including Colorado Spring Utilities’ participation).
• The Western Energy Imbalance Market (EIM): joining the EIM footprint that is
currently operated across parts of the WECC and is administered by the California ISO
(CAISO).
• The proposed Western Energy Imbalance Service (EIS): joining the energy imbalance
market proposed by the Southwest Power Pool (SPP) in the WECC.
These three energy imbalance market options are simulated across different footprints to represent
alternative market participation scenarios.
To conduct the analysis, we used a state-of-the-art production cost simulation tool, Power System
Optimizer (PSO), to simulate the entire Western Electricity Coordinating Council, (WECC),
which includes the JDA study region. As do most production cost simulation tools, PSO simulates
the economic unit commitment and dispatch of generating plants that would be conducted in a
centralized regional wholesale market. To simulate the bilateral markets in the WECC, where a
centralized market operator does not optimize commitment and dispatch decisions we impose
specific restrictions and limitations on the simulations to derive a unit commitment and dispatch
solution for the generating units within the JDA and other areas in WECC that reflects the actual
function of utility-specific decision making, including bilateral market transactions. This approach
is widely used in these types of analyses.
The key metric discussed in this report, Adjusted Production Cost (APC), is a high-level
approximation of the production costs, including purchase costs net of sales revenues, incurred by
the JDA companies to serve their customers. The APC metric uses the simulation outputs to
estimate production costs for all generating units in the JDA as well as the off-system purchase
expenses and sales revenues for all participants in the group. These three components are
aggregated across the JDA footprint to determine a group-wide estimate of production costs
2 Colorado Spring Utilities is not currently a JDA participant, but is set to join the JDA in April 2020.
Therefore, Colorado Spring Utilities is expected to be a full member of the JDA prior to the future year
we studied in this report (2024).Attachment B
Proceeding No. 19M-0495E
Page 10 of 55
incurred to serve customers. We compare the resulting APC metric across various energy
imbalance market structures to estimate the likely range of production cost benefits that the JDA
companies would derive as a result of joining one of the two broader regional energy imbalance
markets relative to remaining in the JDA.
The production cost model simulates the wholesale electricity market on an hourly basis, with
every generation resource, transmission facility, and load represented in the entire WECC,
including the JDA footprint. Thus, the model provides as output simulated generation dispatch
and hourly locational market prices at every generator location and for every load zone, consistent
with optimized unit commitment and dispatch based on the marginal production cost of every
generator and taking into account transmission constraints in the region. From the resulting
generator dispatch and locational price data, we estimated the total production costs of generation
owned or contracted by the JDA companies, payments made for purchasing power from others,
revenues that entities receive for selling power in excess of what is needed to serve their own load,
and any make-whole payment received by the JDA companies from the energy imbalance markets
to compensate them for production costs that are not covered by market revenues.
Production cost impacts are only one element of evaluating participation in a RTO-operated
regional wholesale market. The study does not estimate any production-cost-related impacts
beyond those captured in the simulations and the APC metric, such as discrepancies between
congestion charges and congestion hedging mechanisms, marginal loss refunds, and the likely
significant additional benefits related to the lower-cost, intra-hour balancing of uncertain loads
and renewable generation achieved in a regional market during real-time operations. This report
does not address other considerations related to the formation of, or the participation in, a regional
market such as the implications of alternative market governance structures, implementation and
administrative costs, reliability benefits of regional market operations.
II. Modeling Approach and Assumptions
The starting point for the modeling conducted for this study was the western power market
simulation model developed during the MWTG Regional Market Benefit Study we conducted in
2016 – 2017. In that study, we used the Power System Optimizer (PSO) 3 production cost model to
simulate the WECC footprint, with particular focus on representing the MWTG area in sufficient
detail. For that purpose, the MWTG study participants provided company-specific (confidential)
input assumptions that allowed for accurate simulations of the entire MWTG area and surrounding
region. The 2017 study estimated the benefits of creating a regional wholesale power market in
the MWTG footprint. 4
3 See Technical Appendix for a detailed description of the PSO model and its functionality.
4 The MWTG study can be accessed here:
https://www.wapa.gov/About/keytopics/Documents/mountain-west-brattle-report.pdfAttachment B
Proceeding No. 19M-0495E
Page 11 of 55
Over the last three years, we have been engaged by multiple former MWTG members to utilize
the MWTG model developed during the original study for proprietary follow-up studies that
required a detailed production cost simulation of the MWTG footprint within the WECC region. 5
During the course of these follow-up engagements, the input assumptions in the model have been
updated numerous times with new confidential data provided by several different former MWTG
entities.
In the current study, conducted for the four JDA entities, we are using the most recently updated
version of the MWTG model and have additionally updated it with new features, functionalities,
and data inputs provided by the JDA entities. Overall, we follow a similar modeling approach in
this study as that used in the original MWTG study, but made the necessary adjustments to
estimate the benefits of participation in a real-time energy imbalance market for the JDA
companies.
One of the most important differences in the modeling approaches between the 2017 MWTG study
and this current analysis is that we have developed and now represent the real-time energy
imbalance markets in the model used for this study. In the 2017 MWTG study, we estimated the
benefits of creating a full “day-two” regional wholesale power market that incorporated the ten
members of the MWTG. The current study analyzes the potential benefit of participating in a
real-time energy imbalance market for the JDA companies. Such participation could involve a
broader footprint than the original MWTG areas. In addition, subsequent to the 2017 MWTG
study, the JDA was developed in Colorado and the function of the JDA includes serving as a real-
time dispatch entity. Therefore, the modeling approach in this study requires us to update the
previous model to include both a representation of current JDA operations and the operations of
the two real-time energy imbalance markets that the JDA entities are considering joining: (a) the
CAISO-operated Western Energy Imbalance Market (WEIM or EIM) and (b) the SPP-proposed
Western Energy Imbalance Services (WEIS or EIS) market.
Furthermore, we updated the modeling assumptions to reflect recent projections of the 2024
generation mix and fuel prices for the WECC regions, and simulated multiple cases to represent
different market participation scenarios for the JDA companies and the other former MWTG
members. This study includes simulations of different sensitivities to account for the possibility of
adding additional transfer capabilities between the JDA and the EIM footprints and to account for
different natural gas price assumptions.
5 The multi-lateral non-disclosure agreement (NDA) entered into between The Brattle Group and the ten
MWTG entities allowed each individual MWTG entity to engage Brattle and utilize the model for
follow-up studies. The confidential data used to augment the MWTG model were originally provided
to The Brattle Group on a confidential basis and the data are not shared across the MWTG participants.
All data provided to Brattle and the individual participant level results of the simulations are
confidential and protected by multi-lateral NDA. Brattle has maintained this level of confidentiality in
all subsequent engagements with MWTG members, including during this study. All participant level
data remains confidential and are not shared across the study participants.Attachment B
Proceeding No. 19M-0495E
Page 12 of 55
A. Review of the MWTG Study Modeling
Approach and Assumptions
The objective of the 2017 MWTG study 6 was to simulate the benefits of a full “day-two” regional
power market in the MWTG footprint. To accomplish that objective in 2016 – 2017, we used the
PSO model to simulate unit commitment and dispatch decisions made in the day-ahead timeframe.
We did not simulate real-time unit commitment or dispatch decisions. That day-ahead analytical
approach was used in the MWTG study because the MWTG entities were interested in analyzing
a full regional market, in which the large majority of production cost savings would be from a full
day-two regional market, accrued from efficiency gains in the day-ahead unit commitment and
dispatch decisions. The current imbalance market participation analysis, which estimates the
benefits of participating in a real-time energy imbalance market, requires that we simulate both
day-ahead and real-time unit commitment and dispatch decisions.
The PSO model built for the MWTG study was based on the 2024 WECC Transmission Expansion
Planning Policy Committee (TEPPC) Common Case database. This publicly available (for WECC
members) data was augmented with confidential data inputs provided by the MWTG study
participants. The augmented Common Case database was further updated to include the following
changes:
• A representation of the bilateral market in the WECC was built into the model by
implementing several changes to the model:
o Hurdle rates were applied between utilities to simulate bilateral trading
frictions. The hurdle rates included an $8/MWh hurdle on the unit
commitment optimization to represent utilities’ preference for scheduling their
own resources, a $4/MWh hurdle on the dispatch optimization to represent
trading margins, the OATT wheeling fees (which vary by utility), and a
$1/MWh fee for administrative charges for transmission services specified in
the OATTs. These hurdles were removed in the market participation cases to
represent the optimized commitment and dispatch of resources and shared
transmission usage in a regional market.
o The flow limits on defined physical transmission constraints (defined by WECC
path ratings) in the MWTG footprint were de-rated to reflect the inefficiencies
of bilateral transmission scheduling along contract paths.
• Long-term transmission contracts were reflected in the bilateral market structure to
allow utilities to conduct bilateral trading without paying wheeling fees on a
transaction-specific basis.
6 A complete description of the model approach, study scope, and modeling assumptions in the MWTG
study is provided in the study report.Attachment B
Proceeding No. 19M-0495E
Page 13 of 55
• The operating characteristics of certain MWTG generating resources were updated
based on the confidential operational data provided by the MWTG study participants.
• Unit-specific fuel prices (including delivery costs to individual plants) were
incorporated into the model based on confidential company data.
• The reserve requirements for each utility were updated based on the information
provided by the MWTG study participants.
• Projected generation retirements and additions for the MWTG participants, which
were not reflected in the TEPPC Common Case, were added to the model database.
For the 2016 – 2017 MTWG analysis, the augmented model was used to simulate two test years,
2016 and 2024 and multiple market participation cases. The 2016 simulations covered four market
participation cases:
• A Status Quo Case in which the MWTG entities were not participating in a market;
• A Joint Transmission Tariff Case where the MWTG shared a common (de-pancaked)
transmission tariff but not an organized wholesale market;
• A Regional Market Case where all MWTG entities participated in a regional market;
and
• A Regional Market Case that maintained some must-run generation.
The 2024 simulations covered two Current Trends Cases to reflect the most likely projected
operating conditions in 2024, one with the Status Quo (no market in the MWTG) and a second
with a full Regional Market.
We also tested the benefits of a regional market under two sensitivities, a High Natural Gas Price
Sensitivity and a Market Stress Sensitivity that simulated higher loads, higher fuel prices, and lower
hydro production.
B. JDA Modeling Approach and Assumptions
The starting point for the analysis conducted for this study is the 2024 Current Trends Status Quo
Case from the 2017 MWTG study. The assumptions used to simulate this case have been used by
multiple former MWTG entities in follow-up engagements, and all of the data updates
incorporated during those follow-up engagements are reflected in the model used for this current
analysis. We further augmented the model by incorporating updates provided by the JDA entities
as part of this study. The updated 2024 model assumptions provided by the JDA entities include:
• Updated load forecasts for the JDA entities.
• Planned generation retirements and additions in the JDA footprint, which includes all
the generation retirements and additions related to PSCo’s Colorado Clean Energy Plan
(such as retirement of Comanche units 1 and 2, addition of wind and solar, batteryAttachment B
Proceeding No. 19M-0495E
Page 14 of 55
storage, and gas generation). 7 The updated generation resources by fuel type in the JDA
footprint, as shown in Table 4, includes slightly less than 2,500 MW of coal-fired
generation resources, about 2,500 MW of gas-fired combined cycles, almost 3,500 MW
of gas-fired peaking capacity, almost 4,500MW of wind resources, and about 1,500 MW
of solar capacity.
• Updated information of long-term transmission contracts to reflect their ability to trade
bilaterally with neighboring utilities without paying transaction-specific wheeling fees.
• Unit-specific fuel costs (including delivery charges) and variable operating costs for the
generating resources in the JDA footprint.
Table 4: 2024 Generation Mix by Fuel Type in the JDA Footprint
Generation Capacity (MW)
Coal 2,395
NG CC 2,516
NG Peaker 3,625
Hydro 416
Wind 4,430
Solar 1,459
Other 1,864
The model was further updated with data from public sources, specifically generation retirements
and additions in the rest of the former MWTG footprint and for the EIM participants that are
adjacent to the MWTG footprint, which includes PacifiCorp east (PACE), Arizona Public Service
Company (AZPS), the Salt River Project (SRP), Tucson Electric Power Company (TEPC), and
Public Service Company of New Mexico (PNM). The generation retirements in adjacent regions
include the planned retirements of units at the San Juan, Craig, Colstrip, Cholla, and Navajo coal
plants.
While we did not conduct a comprehensive review of all of the potential generation retirements
and additions across the WECC region that are not directly interconnected with the former
MWTG footprint, we ensured that all western states with a renewable energy requirement are
simulated with adequate renewable energy generation in 2024 to be on track to meet their standard.
7 Some of the planned retirements and additions under the Colorado Clean Energy Plan are not expected
to occur until 2025 or 2026. We included these changes even though our future test year is 2024. This
was done so that the simulation would reflect expected system conditions after the plan is fully
implemented, which provides results that are more useful for the JDA companies as they decide on
market participation. To be consistent we applied the same logic to other generation retirements or
additions that have been publicly announced and are expected to be implemented prior to 2026 (e.g.,
Craig unit 1 is expected to come offline in 2025, so it has been retired in this study).Attachment B
Proceeding No. 19M-0495E
Page 15 of 55
Other updates made for the purpose of this study include:
• Implemented new natural gas price projections based on the California Energy
Commission’s (CEC) 2019 Preliminary Integrated Energy Policy Report (IEPR) Mid-
Demand Forecast of natural gas prices for the WECC. 8 The CEC 2019 Revised IEPR
Forecast was released after we had finalized the simulations for the Base Cases for this
study. We analyzed the possibility of using the 2019 CEC Revised Forecast as a
sensitivity in the study, but in consultation with the JDA entities we decided the CEC
2017 Revised Forecast was a better sensitivity to test (see discussion of the Natural Gas
Price Sensitivity). Table 5 below summarizes the natural gas price assumptions used in
the model for all the areas in the WECC.
Table 5: 2024 Average Annual Natural Gas Price Modeling Assumptions
Region Modeled NG Price
Colorado $2.69
Arizona North $2.52
Arizona South $2.11
California Blythe $3.61
California PGaE $4.28
California SDGE $4.28
California SJ Valley $3.34
SoCal Border $4.27
Idaho North $2.52
Idaho South $3.68
Montana $2.65
New Mexico North $2.48
New Mexico South $2.02
Nevada North $3.52
Nevada South $3.39
Oregon $3.89
Malin $2.89
Texas West $2.04
Utah $2.90
Washington $3.82
Wyoming $2.63
• Updated the assumptions to account for inflation since the 2017 MWTG study.
Therefore, all the results presented in this study are in 2019 dollars.
• Built in a modeling structure to account for the regions of WECC that have greenhouse
gas (GHG) emission reduction policies. This includes California, Washington, British
8 Accessed here: https://ww2.energy.ca.gov/assessments/ng_burner_tip.htmlAttachment B
Proceeding No. 19M-0495E
Page 16 of 55
Columbia, and Alberta. We also include Oregon as an area with a GHG emission
reduction policy, as they are in the process of developing a policy that likely will be in
place by 2024. We have not implemented a GHG price in Colorado. Instead, the GHG
policy in Colorado is reflected through the planned retirement of coal-fired resources
and the addition of renewable energy prior to 2024.
• While these regions within WECC are far from the JDA footprint and therefore likely
have little impact on the results of this study, we implemented GHG pricing in these
regions to be consistent with expected policy and system operation in 2024.
• To create the GHG region in the model, we used the same approach as in the recent
Brattle study of Extended Day-Ahead Market (EDAM) benefits. 9
• To approximate the boundary of the GHG region, we used the balancing areas already
defined in the model. For example, all of Bonneville Power’s balancing area was
included in the GHG region even though a portion of their balancing authority (BA) is
outside of the three U.S. states that are expected to have GHG limit in 2024. This
approach will imperfectly cover the resources that are impacted by GHG emission
limits, but given that modeling the GHG region was not the focus of the study, this is
an appropriate approximation.
• We imposed a GHG cost on all GHG-emitting generation resources in the affected
balancing areas (see above) and imposed a GHG hurdle rate on imports into the GHG
region that reflects the price of GHG emissions and the emissions rate of a natural gas-
fired combined cycle unit.
The final modeling change implemented for this study was to simulate real-time unit commitment
and dispatch decisions, which allows us to represent the real-time energy imbalance markets in
the model. The model simulates unit commitment and dispatch decisions in three sequential
optimization cycles, which are shown in Figure 1. 10 The first cycle optimizes (day-ahead) unit
commitment decisions. This first cycle includes hurdle rates between utilities, which represent
the utilities’ preferences to commit their own resources in the day-ahead. The second cycle
optimizes (day-ahead or intra-day bilateral) economic dispatch decisions subject to the results of
the unit commitment cycle. This economic dispatch cycle also contains hurdle rates that limit the
economic energy transactions between utilities to represent trading costs and margins in the
bilateral market. These first two cycles, because they include hurdle rates that limit the model’s
ability to optimize across multiple utilities, are designed to simulate utility-specific unit
commitment and dispatch decisions. In the 2017 MWTG study, the model was used to simulate
only these first two cycles.
To model real-time commitment and dispatch decisions, we added a third cycle to the model. The
real-time cycle re-optimizes unit commitment decisions in the EIM participation cases (if there
9 See modeling assumptions here: http://www.caiso.com/InitiativeDocuments/Presentation-
ExtendedDay-AheadMarketFeasibilityAssessmentUpdate-EIMEntities-Oct3-2019.pdf
10 The model also conducts a fourth cycle to calculate transmission losses across the WECC.Attachment B
Proceeding No. 19M-0495E
Page 17 of 55
are any resources that can be committed in real-time) and economic dispatch decisions, subject to
the results of the first two cycles. The real-time cycle is subject to different modeling assumptions
than the earlier two cycles. For example, the hurdle rates between utilities are reduced or
eliminated to represent participation in an energy imbalance market. With the real-time cycle
represented, the simulations are able to re-optimize commitment and dispatch decisions from the
utility-specific cycles in the final real-time cycle based on what the reduction in hurdle rates allows.
Figure 1: PSO Model Optimization Cycles
1st Model Cycle: 2nd Model Cycle: 3rd Model Cycle:
Utility-Specific Utility-Specific Real-Time
Unit Commitment Economic Dispatch Market Operations
• Individual utilities optimize • Individual utilities optimize • Regionally optimized re-
unit commitment dispatch and commitment of dispatch of committed
fast-start resources resources
• Hurdle rates between
utilities reflect hesitancy to • Hurdle rates between • Regionally optimized
de-commit resources to rely utilities reflect margins on commitment of certain fast-
on purchases bilateral trades start units (EIM only)
• OATT fees assessed on • OATT fees assessed on • No hurdle rates between
trades between utilities trades between utilities market participants
• Accounts for resources • Transmission rights modeled • Transfer capabilities reflect
needed to provide ancillary for off-system available transmission for
services sales/purchases use in the market
• Ancillary services procured
for each utility or BAA
Day-Ahead Cycles for Real-Time Cycle for
Utility-Specific Optimization Market Optimization
Altering the modeling assumptions between day-ahead/bilateral and the real-time cycle (as listed
in Figure 1) allows us to represent the different energy imbalance market options evaluated in this
study. Specifically, the assumptions for the first two (utility-specific) cycles are the same regardless
of which imbalance market that the JDA entities would join. The different real-time energy
imbalance markets are represented in the model by reducing hurdle rates between utilities,
modifying transfer capabilities across utilities, and allowing unit-commitment decisions in the
real-time (3rd) cycle. Note, however, that our simulations have only hourly granularity (i.e., do
not simulate the intra-hour dispatch of energy imbalance markets) and do not modify system
conditions across these simulation cycles to reflect uncertainty in loads, generation availability,
and renewable generation output. By not simulating intra-hour operation and not introducing
uncertainties such as load forecast error or variable resource output errors between the simulation
cycles, we the simulation results will understate the estimated benefit of real-time optimization
through the contemplated imbalance markets.Attachment B
Proceeding No. 19M-0495E
Page 18 of 55
We conducted this analysis with the simulation of three different energy imbalance markets: the
JDA by itself, the JDA entities joining the EIM, and the JDA entities joining the Western EIS.
Below, we describe the assumptions for representing each of the three options.
The modeling assumptions used to represent the JDA are as follows:
• A $2/MWh hurdle rate was imposed in the real-time cycle on transactions between
JDA members. This hurdle rate implies that the JDA dispatch will only make economic
energy transactions between JDA entities if the cost differential is $2/MWh or greater.
The $2/MWh hurdle rate (based on JDA-participants’ input) captures the inefficiencies
of the JDA market structure. The JDA clears their transactions using zonal prices
instead of nodal prices. This means that economic resources may not be dispatched if
the zonal price does not fully reflect the economics of that resource. The $2/MWh
hurdle rate is used to represent the inefficiency of zonal pricing compared to the nodal
pricing used in the EIM and EIS.
• Transfers between JDA entities in the real-time cycle of the model are limited by the
amount of transmission transfer capability that is available after accounting for the
transmission that has been scheduled in the first two cycles of the model. Specifically,
the transfers between the JDA entities are limited to total physical transfer capacity less
the transfer capability already utilized in the utility-specific unit commitment and
dispatch cycles.
• The JDA has no ability to commit or de-commit resources in the real-time cycle.
Therefore, the real-time cycle is limited to re-dispatching resources that are already
committed in the utility-specific dispatch cycles, subject to any operational constraints
of the resources.
The modeling assumptions used in the real-time cycles to represent the EIM are as follows:
• No hurdle rate is imposed between EIM participants. This reflects the efficiency of
EIM dispatch.
• The EIM has the ability to commit resources with a cycle time of less than 4.5 hours.
This means that the resources that have been identified to have cycle times shorter than
4.5 hours can be committed or de-committed during the real-time cycle of the model
in the scenarios when the JDA participates in the EIM.
• Participants in the EIM have two options for making transmission available for use by
the EIM. First, they can elect to provide all their available physical transmission for
use in the market, meaning all the physical transmission that remains unutilized after
utility-specific unit commitment, economic dispatch, and bilateral transactions.
Second, they can elect to only provide the transmission capabilities to which they have
contracted rights (and that have not already been utilized in the prior cycles of the
model). To be conservative in estimating market participation benefits, we assumed all
the MWTG members, except the JDA entities and the two Wyoming utilities owned
by the Black Hills Corporation (Cheyenne Light Fuel and Power and Black HillsAttachment B
Proceeding No. 19M-0495E
Page 19 of 55
Power), would choose the second option and only make available for the EIM their
contracted transmission capability. We assume that the JDA entities and Black Hills’
Wyoming utilities choose to provide all available physical transfer capability to be used
by the EIM when simulating the relevant cases.
• The amount of transfer capabilities between the JDA companies was provided by the
companies. The transmission rights between the other MWTG utilities was provided
by MWTG study participants during the MWTG study.
• To simulate the existing EIM market, all the existing and currently planned (as known
publicly when we began the study) members of the EIM are included. Therefore, all
modeling assumptions listed above were applied to all the existing and planned EIM
members (see the map in Figure 2). This means that regardless of the market
participation scenarios modeled in the JDA or the MWTG footprint, these assumptions
are applied to the existing and currently planned EIM members. This assumption
reflects the fact that the EIM is expected to continue operating with the current and
planned membership regardless of the market participation decisions reached by the
JDA companies.
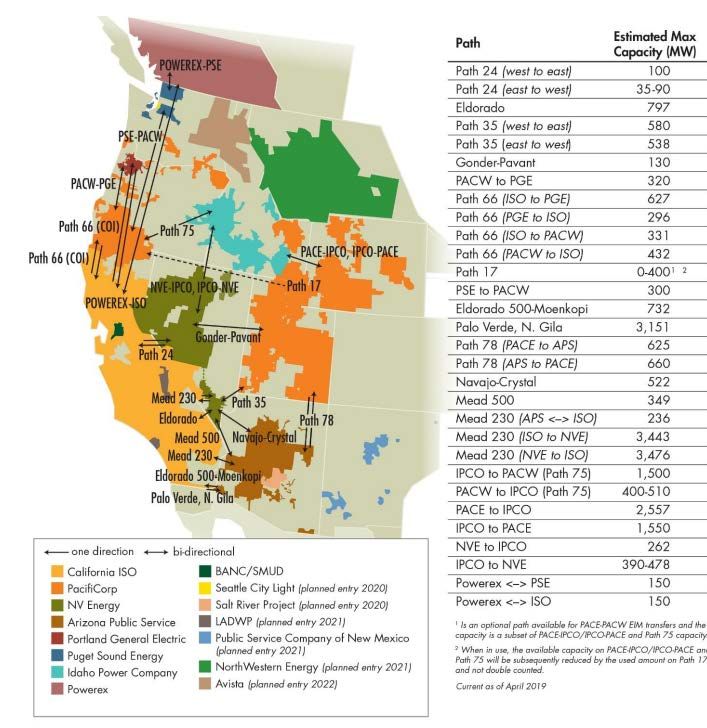
Figure 2 lists the transfer capabilities between the existing EIM members. The figure is taken from
the most recent CAISO EIM Benefit Report. We modeled the transfer capabilities between the
existing EIM members as shown in the Figure 2. There is no publicly available data on the transfer
capabilities between existing EIM members for the additional utilities that are planning to join the
EIM. Therefore, we approximated those transfer capabilities based on WECC Path Ratings and
other publicly available sources of information on the ownership of transmission rights in the
WECC.Attachment B
Proceeding No. 19M-0495E
Page 20 of 55
Figure 2: Transfer Capabilities between Current and Planned EIM Participants
PRPA
PSCO
CSU
BHCE
The modeling assumptions used in the real-time cycles to represent the EIS are as follows:
• There is no hurdle rate imposed between participants in the real-time cycle when
representing the EIS. This reflects the expected efficiency of dispatch decisions in the
EIS.
• The EIS does not have the capability to commit resources. Therefore, the real-time
cycle for the EIS is limited to re-dispatching resources previously committed in one of
the first two cycles of the model.
• The proposed EIS market requires that all the physical transmission capability (less
what is scheduled bilaterally) is made available to the market. This is similar to current
practice in the JDA. Therefore, transfer capabilities between the EIS members are
modeled in the same way as in the JDA.
• The existing SPP market in the Eastern Interconnection is not represented in the
model. Therefore, the model used in this study does not simulate flows across the DC
interties between the MWTG footprint and the existing SPP. The interties are modeled
as static hourly injections or withdrawals of power based on the data provided duringAttachment B
Proceeding No. 19M-0495E
Page 21 of 55
the MWTG study. The assumed physical power flows over the interties are the same
across all scenarios.
Table 6 summarizes the modeling assumptions used to represent the capabilities of the three
different energy imbalance options available to the JDA companies. The table summarizes the
assumptions on hurdle rates between market members, unit commitment capabilities of each
market, and how the transfer capabilities between members are determined for each of the options.
The simulated EIM and EIS membership scenarios are discussed in the next section below.
Table 6: Differences in Modeling Assumptions for the Three Real-Time Imbalance Options
Market Design
JDA CAISO EIM SPP EIS
Assumption
Hurdle Rate
$2/MWh None None
between Members
Yes, for resources with
Unit Commitment
No 4.5 hour cycle time or No
Capabilities
less
Transfer Capability =
Physical Limit less
Capacity used in UC and
Transfer Capability = ED Cycles Transfer Capability =
Transfer Capability
Physical Limit less Physical Limit less
between Members
Capacity used in UC Or, for some entities: Capacity used in UC
and ED Cycles Transfer Capability = and ED Cycles
Transmission Rights less
Capacity used in UC and
ED Cycles
C. Scenarios and Sensitivities Simulated
This study consists of four Base Cases that simulate the current market operations in the JDA and
three different market participation scenarios, assuming the projected market conditions and
resource mix for 2024. The study also consists of two sensitivities that build on the four Base Cases.
The Added Transmission Sensitivity simulates the impact of additional transfer rights between the
JDA and the EIM. The Natural Gas Price Sensitivity analyzes the same four Base Cases, but with
new natural gas price assumptions for the WECC. All of the cases simulated, both the Base Cases
and the two Sensitivities, include, as described in the previous section, to reflect expected system
operating conditions in 2024.
The four Base Cases simulated in this study are:
• Status Quo Case: Represents current market operations in the WECC. This includes a
representation of the EIM for all the existing members and the utilities that had
announced publicly at the start of our study that they are planning to join before 2024.Attachment B
Proceeding No. 19M-0495E
Page 22 of 55
The four JDA entities are represented as participating in the JDA. The other MWTG
members are not represented in any regional market. This case assumes that only the
current imbalance markets operating in the WECC will be operating in 2024, with their
current and already-planned memberships as had been announced at the initiation of
this study in the summer of 2019. The Status Quo Case serves as the baseline against
which the benefits of participation in the EIM or EIS are calculated for the JDA entities.
• JDA in EIM Case: Simulates the four JDA entities as part of the broader Western EIM
footprint. The other MWTG entities are not included in any regional market structure
in this case. The representation of the rest of the WECC is unchanged from the Status
Quo Case. Therefore, the JDA in EIM Case is compared to the Status Quo Case to
estimate the benefit for the JDA companies if only they join the EIM.
• MWTG in EIM Case: Simulates the entire MWTG footprint, including the JDA entities,
participate in the EIM in 2024. The representation of the rest of the WECC is the same
as in the Status Quo Case. Therefore, comparing the MWTG in EIM Case with the
Status Quo Case indicates the benefits if all ten MWTG companies joining the EIM.
• MWTG in EIS Case: Models the full MWTG footprint, including the JDA companies,
in the Western EIS. The representation of the rest of the WECC is the same as in the
Status Quo Case. Comparing the MWTG in EIS Case with the Status Quo Case indicates
the benefits if all ten MWTG companies joining the EIS.
Since we began this study, certain members of the MWTG have announced that they plan to join
the proposed SPP-administered Western EIS. This decision is not represented in the Status Quo
or JDA in EIM Case simulations. We do not expect that modeling MWTG members in the EIS
would materially impact the results of either the Status Quo or JDA in EIM Cases. In both the
Status Quo and JDA in EIM Cases, the JDA and the rest of the MWTG footprint are separated by
very high hurdle rates to prevent any trading of power in the real-time cycle of the simulations,
which would not change by modeling any portion of the MWTG footprint in the EIS in these two
cases. Table 7 summarizes the market participation assumptions in each of the four Base Cases,
the Status Quo Case and the three market participation scenarios.Attachment B
Proceeding No. 19M-0495E
Page 23 of 55
Table 7: Market Participation Assumptions in each Case
JDA Group Rest of MWTG
Updated 2024 Rest of WECC
Case Name Market Market Participation
Assumptions Market Participation
Participation
EIM
Status Quo JDA None
(where applicable)
EIM
JDA in EIM EIM None
(where applicable)
EIM
MWTG in EIM EIM EIM
(where applicable)
EIM
MWTG in EIS EIS EIS
(where applicable)
1. Added Transmission Sensitivity
The Added Transmission Sensitivity Case re-simulates the JDA in EIM Case, except for an increase
in the transfer capability between the JDA and the broader EIM. In this sensitivity, 200 MW of
additional transmission rights, in the export direction, are added to the model between PSCo and
its neighboring EIM entities. Of the 200 MW, 100 MW of transfer rights is between the JDA
footprint to PACE and the other 100 MW is between the JDA footprint and three EIM members
in Arizona and New Mexico that interconnect at the Four Corners hub. To do so, we added 34
MW of transfer rights between PSCo and AZPS, 33 MW of transfer rights with SRP, and 33 MW
of transfer rights with PNM.
Under this sensitivity, based on assumptions provided by the JDA entities, we did not add new
physical transmission lines to the model. We simulate a scenario where PSCo purchases additional
long-term transmission rights on existing transmission lines to PACE and down into the area
around Four Corners (where they can connect with AZPS, SRP, and PNM).
The new transfer rights were added to the model connecting PSCo with the neighboring EIM
members, but that does not restrict the other JDA entities from using the added transfer rights
between the JDA footprint and PACE, AZPS, SRP, and PNM, when transacting with the existing
EIM entities. PSCo is well interconnected with the other JDA companies and there are no hurdle
rates on trades between JDA companies in the EIM. Therefore, the new transfer rights can be
accessed by all the JDA companies to import or export economic energy to the broader EIM
footprint.
The Status Quo Case is not re-simulated as part of this sensitivity, because the new transmission
rights are not likely to be purchased if the JDA does not join the EIM. The market participation
benefit in this sensitivity is estimated by comparing the Status Quo Case from the Base Cases to
the JDA in EIM Case with the additional transfer rights. The cost of acquiring the added transfer
rights is not estimated in this study. Therefore, one should account for the cost of adding the
transfer capability when analyzing the market participation benefit estimated in this sensitivity.Attachment B
Proceeding No. 19M-0495E
Page 24 of 55
2. Natural Gas Price Sensitivity
The Natural Gas Price Sensitivity Cases simulate all four Base Cases, but with adjusted natural gas
price assumptions for all regions in the WECC. All the other modeling assumptions remain the
same as in the Base Cases.
The motivation for the Natural Gas Price Sensitivity is to address some of the characteristics of the
CEC’s 2019 Preliminary IEPR natural gas price forecast, which was used in the Base Cases (“the
Base Case natural gas price assumptions”). The Base Case natural gas price assumptions reflect the
recent supply and demand dynamics in the WECC, which have resulted in relatively low natural
gas prices compared to recent history.
This is particularly true for natural gas prices in the southwest region (Arizona and New Mexico),
which are significantly lower than in the surrounding areas of WECC (e.g., Colorado and Utah) in
the Base Case natural gas price assumptions. The historically low gas prices in the southwest are
due to excess natural gas production from the Permian Basin in west Texas. The differential
between natural gas prices in the southwest and in Colorado may have a significant effect on the
market participation benefits when the JDA joins the EIM, as it will drive how much economic
energy transactions occur between the JDA companies and the southwest EIM members.
Therefore, the Natural Gas Price Sensitivity was developed to estimate the market participation
benefits when the price differential for natural gas between Colorado and the southwest is smaller
than in the Base Cases.
The CEC’s Preliminary 2019 IEPR forecast is accurately depicting the current natural gas supply
and dynamics in the WECC, but there is no guarantee that the excess supply from Permian will
continue for the next five years as assumed in the CEC preliminary forecast. In fact, there are
several planned pipeline projects meant to move excess supply away from the Permian to meet
demand in other regions. The Natural Gas Price Sensitivity is designed to reflect where natural
gas prices might settle in the WECC if the excess production from the Permian experienced in the
last couple years does not persist into the future.
The natural gas price assumptions used in this sensitivity come from the CEC’s (previous) 2017
Revised IEPR natural gas price forecast (the mid-forecast case). The 2017 CEC forecast did not yet
account for the effect of the excess supply from the Permian. Therefore, the natural gas price
assumptions in this sensitivity are slightly higher across the WECC. Moreover, the differential
between natural gas prices in the southwest (Arizona and New Mexico) and Colorado is much
lower than in the Base Cases.
Table 8 shows the natural gas price assumptions used in the Base Cases compared to the
assumptions used in the Natural Gas Price Sensitivity. As Table 8 documents, the differential in
natural gas prices between Colorado and the southwest is much smaller in the Natural Gas Price
Sensitivity. The average annual natural gas price used in this sensitivity for Colorado is
$3.61/MMBtu, compared to $3.69/MMBtu in Arizona South and $3.53/MMBtu in New Mexico
South, implying almost no differential between the regions. In the Base Cases, the priceYou can also read