ETHNIC RESTAURANTS AND TAKEAWAYS - UK, JANUARY 2017 - Brakes ...
←
→
Page content transcription
If your browser does not render page correctly, please read the page content below
ETHNIC RESTAURANTS AND
TAKEAWAYS
UK, JANUARY 2017
NEXT 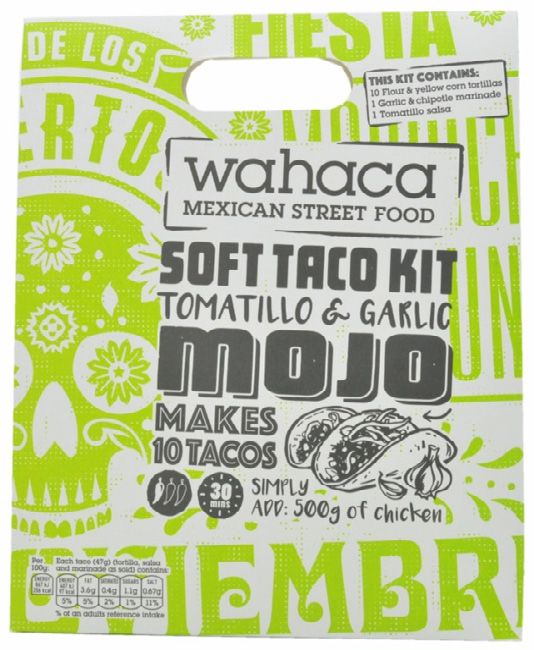
CONDITIONS OF USE
Congratulations on your purchase of a limited license to this Mintel report! Mintel Group Ltd. (“Mintel”) is the
publisher and licensor of this report; the licensee of this report is the original purchaser (“you”). Absent another
written agreement between Mintel and you, the following conditions of use govern your access to and use of this
report.
1. GRANT AND SCOPE OF LICENSE. Subject to the restrictions under clause 2, Mintel grants to you a
personal, revocable, non-exclusive, non-sublicensable, and non-transferable right and license to access and
use this report for your internal business purposes.
2. LICENSE RESTRICTIONS.
A. Absent advance written consent by Mintel, you may not grant access to, sell, pass on,
communicate, or distribute this report or its content to any third party, including any of your affiliates.
Principles of Fair Use do not apply to your use of this report.
B. The purchase or use by a Non-Participating Retailer (or an agent or professional advisor working
on its account) of any Infoscan data sourced by Information Resources, Inc., and contained in this
report is prohibited. Accordingly, you will not knowingly disclose any Infoscan data contained in this
report to a Non-Participating Retailer. As of 1 October 2015, the Non-Participating Retailers are
Aldi, Amazon, Costco, Dollar Tree, Lidl, Trader Joe’s, and Whole Foods (current list available at
www.mintel.com/legal/non-participating-retailers).
C. You will neither encourage financial reliance by third parties upon, nor invite investment from others
based upon, this report without first obtaining the written consent of Mintel’s corporate secretary to
do so, which Mintel may withhold in its absolute discretion. Absent such consent, you will defend,
indemnify, and hold harmless Mintel against any claims made against Mintel based upon such
encouragement or invitation.
3. INTELLECTUAL PROPERTY. As between Mintel and you, this report, including but not limited to the
content, design, look, layout, appearance, and graphics, is the copyright property and confidential
information of Mintel. You disclaim, and Mintel reserves, all right, title, and interest in this report, and all
copies thereof, not expressly granted by these conditions of use, whether by implication, estoppel, or
otherwise.
4. DISCLAIMER OF WARRANTY. THIS REPORT IS PROVIDED “AS IS.” MINTEL MAKES NO
REPRESENTATION OR WARRANTY WITH RESPECT TO CORRECTNESS, COMPLETENESS, OR
CURRENTNESS AND SPECIFICALLY DISCLAIMS ANY WARRANTY, WHETHER EXPRESS, IMPLIED,
OR STATUTORY, INCLUDING ANY WARRANTY OF MERCHANTABILITY OR FITNESS FOR A
PARTICULAR PURPOSE. THIS REPORT NEITHER GIVES INVESTMENT OR PROFESSIONAL ADVICE
NOR ADVOCATES ANY COURSE OF ACTION.
5. INDEMNIFICATION. You will defend, indemnify, and hold harmless Mintel from and against all costs,
liabilities, losses, and expenses (including reasonable attorneys’ fees) (collectively, “Losses”) arising from
any third party claim, demand, complaint, or action arising from unlicensed access or use of this report.
Mintel will defend, indemnify, and hold harmless you from and against any Losses arising from any third
party claim, demand, complaint, or action arising from your licensed access or use of this report and alleging
that this report infringes any intellectual property right.
6. LIMITATION OF LIABILITY. TO THE FULLEST EXTENT PERMITTED BY APPLICABLE LAW AND
EXCEPT FOR ANY INDEMNITY UNDER CLAUSE 5, NEITHER PARTY, NOR ANY OF ITS AFFILIATES,
OFFICERS, EMPLOYEES, OR AGENTS, WILL BE LIABLE IN CONNECTION WITH THIS REPORT FOR
ANY INDIRECT, SPECIAL, EXEMPLARY, PUNITIVE, OR CONSEQUENTIAL DAMAGES, INCLUDING
WITHOUT LIMITATION LOSS OF GOOD WILL AND LOST PROFITS OR REVENUE, WHETHER OR NOT
SUCH DAMAGES ARE BASED IN CONTRACT, WARRANTY, TORT, NEGLIGENCE, STRICT LIABILITY,
OR OTHERWISE (EVEN IF ADVISED OF THE POSSIBILITY OF SUCH DAMAGES), AND NEITHER
PARTY’S AGGREGATE LIABILITY WILL EXCEED THE FEE PAYABLE TO MINTEL BY YOU FOR THIS
REPORT.
7. ENTIRE AGREEMENT. These conditions of use, together with any Mintel documentation of your order,
constitute the entire understanding between Mintel and you regarding this report and may be amended only
by a written instrument duly executed by Mintel and you. No purchase order issued by you will modify these
conditions of use, even if signed by Mintel.
8. CHOICE OF LAW AND JURISDICTION. Use of this report and any dispute arising out of such use is subject
to the laws of England, and you irrevocably submit to the exclusive jurisdiction of the English courts situated
in London, United Kingdom, provided that if your use or a dispute arising from your use arises within the
United States, then such use or dispute is subject to the laws of the State of Illinois, and you irrevocably
submit to the exclusive jurisdiction of the state and federal courts situated in Chicago, Illinois.
v 090915 Single
PREVIOUS NEXT 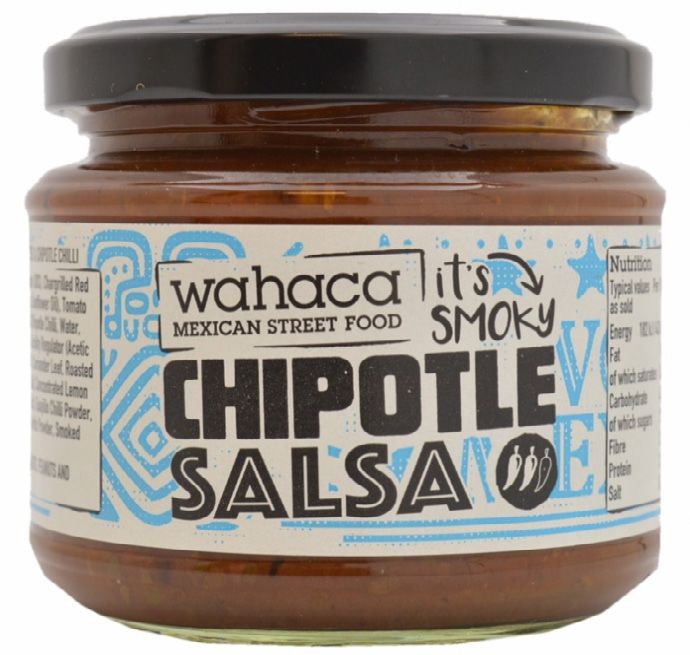
ETHNIC RESTAURANTS AND TAKEAWAYS, UK - JANUARY 2017
Contents
OVERVIEW...........................................................................................................................................................................................6
What you need to know................................................................................................................................................ 7
Products covered in this Report................................................................................................................................... 7
EXECUTIVE SUMMARY...................................................................................................................................................................8
Figure 1: Selected consumer spending priorities (after bills), November 2009-16............................................................................................9
Figure 2: Trends in the age structure of the UK population, 2011-16 and 2016-21...........................................................................................9
Key players................................................................................................................................................................. 10
The consumer............................................................................................................................................................ 10
Figure 3: Frequency of visiting an ethnic restaurant for a sit-down meal, February 2012, November 2012,
October 2015, and October 2017....................................................................................................................................................................10
Figure 4: Frequency of ordering an ethnic takeaway/home delivery, February 2012, November 2012,
October 2015, and October 2017....................................................................................................................................................................10
Figure 5: Usage of ethnic restaurants/takeaways by cuisine, October 2017...................................................................................................11
Figure 6: Average spend when visiting an ethnic restaurant for a sit-down meal, October 2016....................................................................12
Figure 7: Average spend when ordering a takeaway/home delivery from an ethnic restaurant, October 2016...............................................12
Figure 8: Most important qualities when choosing an ethnic restaurant, October 2016..................................................................................13
Figure 9: Attitudes towards ethnic restaurants and takeaways, October 2016................................................................................................14
What we think............................................................................................................................................................. 14
ISSUES & INSIGHTS........................................................................................................................................................................ 15
Lunch options can strengthen ethnic restaurants....................................................................................................... 16
Produce high-quality and healthy dishes.................................................................................................................... 16
Digital innovation can add value to the dining experience......................................................................................... 17
THE MARKET.................................................................................................................................................................................... 18
What you need to know.............................................................................................................................. 19
Ethnic restaurants market is in growth....................................................................................................................... 19
Brands need to provide more reasons to visit............................................................................................................ 19
Costs are going up..................................................................................................................................................... 19
Shortfall of hospitality staff intensifies........................................................................................................................ 19
Potential to target older age groups........................................................................................................................... 19
Segment performance, market size, and forecast.................................................................................... 20
Ethnic restaurants are in growth................................................................................................................................. 20
Figure 10: Value sales^ of the total UK ethnic restaurant/takeaway market, 2011-21.....................................................................................20
Consumer confidence starts to falter in the year ahead............................................................................................. 21
Figure 11: UK ethnic restaurants total market, value sales and forecast, 2011-21..........................................................................................21
The takeaway/home delivery market set to slow........................................................................................................ 22
Figure 12: UK ethnic takeaways, market size and forecast, 2011-21..............................................................................................................22
Dine-in segment to overtake home delivery............................................................................................................... 23
Figure 13: UK ethnic takeaways, value sales and forecast, 2011-21..............................................................................................................23
Figure 14: UK ethnic dine-in restaurants, market size and forecast, 2011-21.................................................................................................24
Figure 15: UK ethnic dine-in restaurants, value sales and forecast, 2011-21..................................................................................................24
The impact of the EU referendum vote...................................................................................................................... 25
Eating out has been resilient in previous slowdowns................................................................................................. 25
Figure 16: Alternative market scenarios for the post-Brexit ethnic restaurants total market, at current prices, 2016-21.................................25
Forecast methodology................................................................................................................................................ 25
Market drivers.............................................................................................................................................. 26
Eating out remains a key discretionary spending area............................................................................................... 26
Figure 17: Selected consumer spending priorities (after bills), November 2009-16........................................................................................26
PREVIOUS NEXT
© Mintel Group Ltd. All rights reserved.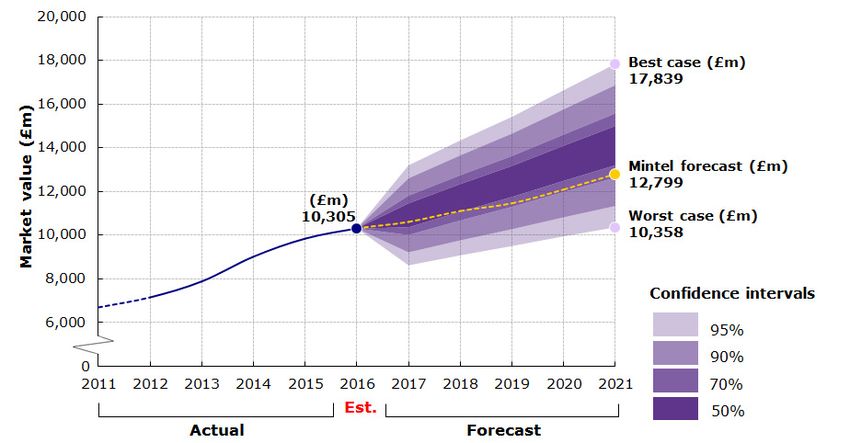
ETHNIC RESTAURANTS AND TAKEAWAYS, UK - JANUARY 2017 4
Costs are going up..................................................................................................................................................... 27
Shortage of skilled chefs threatens the survival of ethnic restaurants....................................................................... 27
Potential to target older age groups........................................................................................................................... 28
Figure 18: Trends in the age structure of the UK population, 2011-16 and 2016-21.......................................................................................28
Unbranded ethnic restaurants are challenged........................................................................................................... 28
UK pork consumption losing out to world foods......................................................................................................... 28
KEY PLAYERS.................................................................................................................................................................................... 29
What you need to know.............................................................................................................................. 30
Giraffe trials World Kitchen......................................................................................................................................... 30
Cinnamon Collection expands.................................................................................................................................... 30
Wahaca launches supermarket range........................................................................................................................ 30
Zing Zing is the one to watch..................................................................................................................................... 30
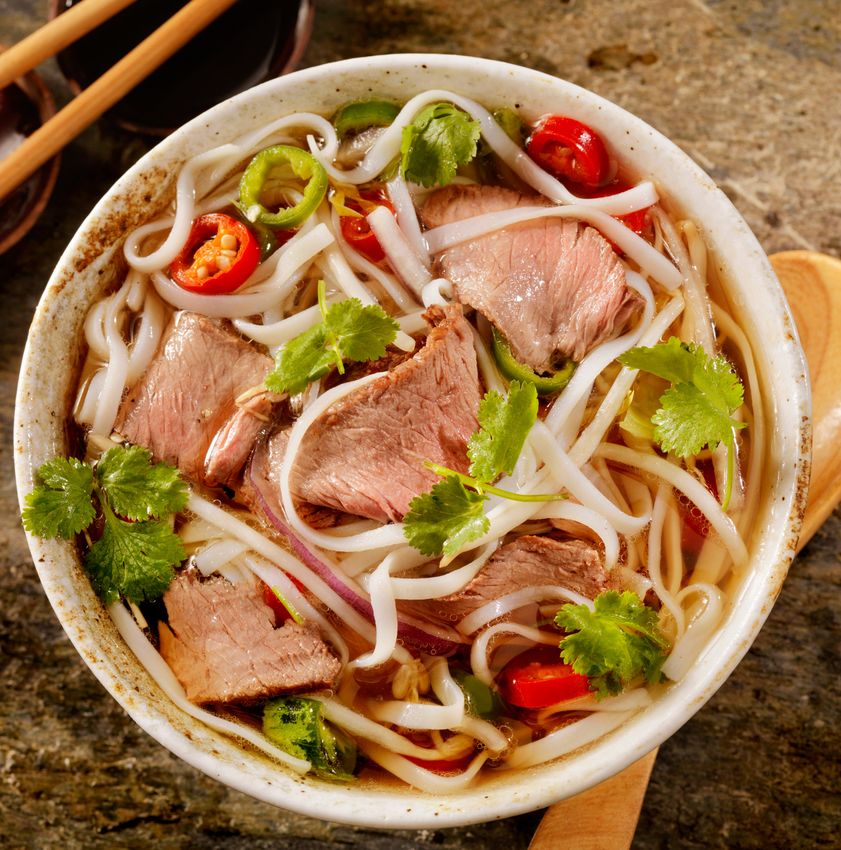
Pho targets millennial market through Snapchat........................................................................................................ 30
Market share................................................................................................................................................ 31
Taco Bell teams up with KitKat................................................................................................................................... 31
Figure 19: Selected South American restaurant/takeaway chains, by outlet numbers, 2011-16.....................................................................31
Figure 20: Selected other Asian restaurant/takeaway chains, by outlet numbers, 2012-16............................................................................31
Zing Zing attracts heavyweight investors................................................................................................................... 32
Figure 21: Selected Chinese restaurant/takeaway chains, by outlet numbers, 2011-16.................................................................................32
Japanese concepts take root..................................................................................................................................... 32
Figure 22: Selected Japanese restaurant/takeaway chains, by outlet numbers, 2011-16...............................................................................32
Gourmet Indian concepts gain traction....................................................................................................................... 33
Figure 23: Selected Indian restaurant/takeaway chains, by outlet numbers, 2011-16.....................................................................................33
A focus on Middle Eastern cuisine............................................................................................................................. 33
Figure 24: Selected Middle Eastern restaurant/takeaway chains, by outlet numbers, 2011-16......................................................................33
Launch activity and innovation.................................................................................................................. 34
Wasabi invests in staff benefits and healthy options.................................................................................................. 34
Pho gains gluten-free accreditation............................................................................................................................ 34
A mash-up of ethnic cuisines can broaden appeal..................................................................................................... 34
Opportunities for late night trading............................................................................................................................. 35
Wahaca launched supermarket range....................................................................................................................... 35
Figure 25: Examples of Wahaca Grocery’s retail brands in the UK, 2016.......................................................................................................35
Non-specialists encroach on ethnic offers.................................................................................................................. 35
THE CONSUMER............................................................................................................................................................................. 36
What you need to know.............................................................................................................................. 37
Chinese and Indian cuisines continue to dominate.................................................................................................... 37
34% of diners typically spend no more than £14.99 on takeaway............................................................................. 37
26% of diners would spend up to £20 on a sit-down meal......................................................................................... 37
58% of diners say good food hygiene ratings is most important................................................................................ 37
45% of diners turn to recommendations from friends or family.................................................................................. 37
Menus should display the nutritional content............................................................................................................. 37
50% of diners want customisable dishes................................................................................................................... 37
40% of diners want grab-and-go lunch options.......................................................................................................... 37
Frequency of visiting ethnic restaurants/takeaways............................................................................... 38
Decline in overall visits in 2016.................................................................................................................................. 38
More users order home delivery than dine-out…....................................................................................................... 38
Figure 26: Frequency of visiting ethnic restaurants/takeaways, October 2017...............................................................................................38
…but home delivery saw more non-users in 2016..................................................................................................... 39
Figure 27: Frequency of ordering an ethnic takeaway/home delivery, February 2012, November 2012,
October 2015, and October 2017....................................................................................................................................................................39
Meanwhile twice a week or more restaurant visits for sit-down meals have grown in 2016...................................... 39
Figure 28: Frequency of visiting an ethnic restaurant for a sit-down meal, February 2012, November 2012,
October 2015, and October 2017....................................................................................................................................................................39
PREVIOUS NEXT
© Mintel Group Ltd. All rights reserved.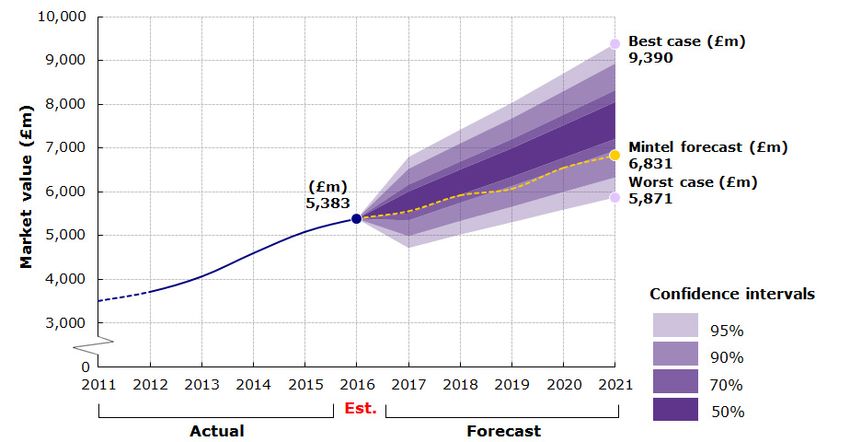
ETHNIC RESTAURANTS AND TAKEAWAYS, UK - JANUARY 2017 5
Usage of ethnic restaurants/takeaways by cuisine.................................................................................. 40
Chinese out in front.................................................................................................................................................... 40
Figure 29: Usage of ethnic restaurants/takeaways by cuisine, October 2017.................................................................................................40
Repertoire of secondary shops.................................................................................................................................. 41
Figure 30: Repertoire of ethnic restaurants used for a sit-down meal, October 2016.....................................................................................41
Figure 31: Repertoire of ethnic restaurants used for takeaway/home delivery, October 2016........................................................................41
Average spend on a sit-down or home delivered ethnic meal................................................................ 42
Average spend peaks at £15 for a home delivered meal…....................................................................................... 42
Figure 32: Average spend when ordering a takeaway/home delivery from an ethnic restaurant....................................................................42
…rises to £20 for a sit-down meal.............................................................................................................................. 42
Figure 33: Average spend when visiting an ethnic restaurant for a sit-down meal, October 2016..................................................................42
Potential to chase higher expenditure among frequent users.................................................................................... 43
Figure 34: Average spend when visiting an ethnic restaurant for a takeaway/home delivery meal, by frequency of
visiting ethnic restaurants/takeaways, October 2016......................................................................................................................................43
…while a fifth of twice a week or more restaurant-goers spend £30+....................................................................... 44
Figure 35: Average Spend When Visiting an Ethnic Restaurant for a Sit-Down Meal, by Frequency of Visiting Ethnic
Restaurants/Takeaways, October 2016...........................................................................................................................................................44
Restaurant choice drivers.......................................................................................................................... 45
Good food hygiene rating is most important............................................................................................................... 45
Word-of-mouth and reviews help users choose......................................................................................................... 45
Improved restaurant atmosphere can elevate the leisure experience........................................................................ 46
Figure 36: Most important qualities when choosing an ethnic restaurant, October 2016................................................................................46
Attitudes towards ethnic restaurants and takeaways.............................................................................. 47
Diners want to make informed choices...................................................................................................................... 47
The flexibility to customise a dish to one’s taste is appealing.................................................................................... 47
Grab-and-go lunch options can broaden appeal........................................................................................................ 47
Figure 37: Attitudes towards ethnic restaurants and takeaways, October 2016..............................................................................................48
APPENDIX......................................................................................................................................................................................... 49
Data sources, abbreviations and supporting information....................................................................... 50
Abbreviations.............................................................................................................................................................. 50
Consumer research methodology.............................................................................................................................. 50
Market size and forecast............................................................................................................................. 51
Forecast Methodology................................................................................................................................................ 51
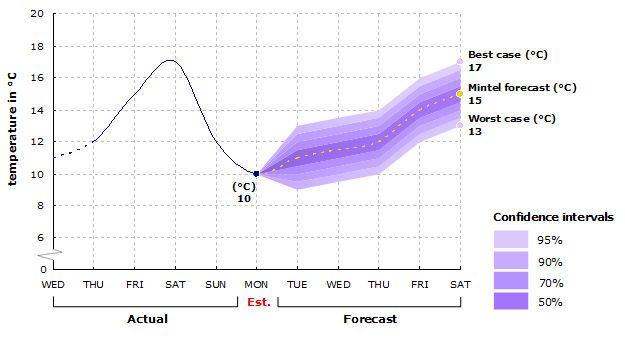
Best- and worst-case forecast.................................................................................................................................... 51
Figure 38: Best- and worst-case forecasts for UK ethnic restaurants and takeaways market, 2016-21.........................................................51
Figure 39: Best- and worst-case forecasts for UK Takeaway ethnic restaurants market, 2016-21.................................................................52
Figure 40: Best- and worst-case forecasts for UK Dine-in ethnic restaurants market, 2016-21......................................................................52
RESEARCH METHODOLOGY..................................................................................................................................................... 53
UK Research Methodology......................................................................................................................... 54
Sampling and weighting............................................................................................................................................. 54
Face to Face Surveys ............................................................................................................................................... 54
Brand & Social Media Research................................................................................................................................ 56
Trade research........................................................................................................................................................... 56
Desk research............................................................................................................................................................ 56
Statistical Forecasting................................................................................................................................................ 56
The Mintel fan chart.................................................................................................................................................... 57
PREVIOUS NEXT
© Mintel Group Ltd. All rights reserved.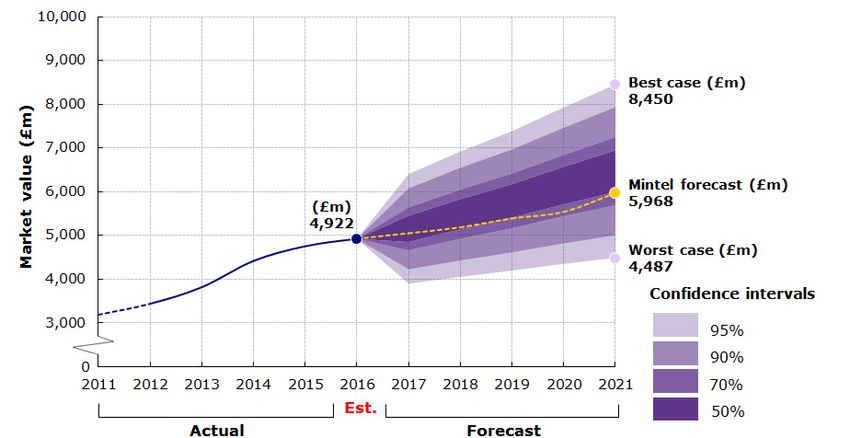
OVERVIEW PREVIOUS NEXT
ETHNIC RESTAURANTS AND TAKEAWAYS, UK - JANUARY 2017 7
What you need to know Products covered in this Report
The ethnic restaurants market is in growth but looks set to slow, This Report examines the UK ethnic restaurant market. Within the
as consumer confidence is expected to decline. Meanwhile, scope of the Report, takeaway, delivery and sit-down restaurants
operators that actively seek new ways to drive efficiency and are considered. The market size comprises turnover from ethnic
improve productivity may stand a chance to offset the impact restaurants (restaurant and home delivery/takeaway) as well as
of rising costs, namely the increase in business rates and food independents.
costs.
This Report includes ethnic restaurants and takeaways
As the population of over-55s is forecast to grow, it becomes more specialising in any cuisines outside Europe, Russia, Australasia
important to provide additional reasons to visit and win favour and North America.
among these older cohorts. Offering ethnic-styled grab-and-go
lunch options should also help create more occasions for diners The following definitions apply to the various cuisines referred to
to use ethnic restaurants. Continued focus on communicating in this Report:
good food hygiene ratings looks much needed, given that more
and more diners seek consensus that their purchase will be • Chinese: Peking, Cantonese and other Chinese variations;
worthwhile.
• Tex-Mex: a blend of Mexican and Texan food culture (eg
fajitas);
• Caribbean includes cuisine from Jamaica as well as other
Caribbean islands;
• North African, including, for example, Moroccan and Algerian
cuisine;
• Other African food includes cuisine from all other African
countries, such as Nigerian or Ghanaian;
• Middle Eastern food refers to all food from countries in the
Middle Eastern region, such as the Emirates, Israel, Lebanon
and Turkey;
• South American cuisine includes cuisine from all countries on
the continent, such as Brazil.
Excluded from this Report are:
• All ethnic ready meals and food products bought through retail
channels, eg supermarkets
• Ethnic meals bought in non-specialist ethnic restaurants, eg
pubs, hotels, sandwich shops etc
• All European and North American foods, with the exception of
Tex-Mex.
Further research on the home delivery and takeaway sectors can
be found in Mintel’s Attitudes to Home Delivery and Takeaway
Food – UK, March 2016 Report.
PREVIOUS NEXT
© Mintel Group Ltd. All rights reserved.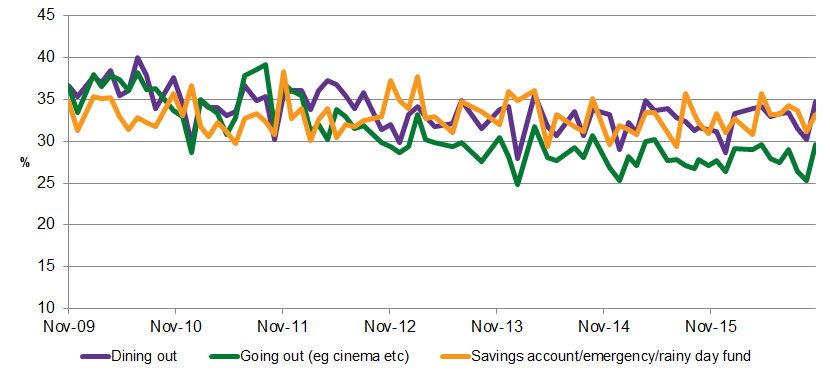
EXECUTIVE SUMMARY PREVIOUS NEXT
ETHNIC RESTAURANTS AND TAKEAWAYS, UK - JANUARY 2017 9
IT IS BECOMING MORE IMPORTANT TO PROVIDE ADDITIONAL REASONS TO VISIT, AS ETHNIC RESTAURANTS FACE
MOUNTING PRESSURES ON RECRUITMENT, RISING COSTS AND WEAKENING CONSUMER CONFIDENCE. CASUAL DINING
CONCEPTS THAT FOCUS ON COMMUNICATING GOOD FOOD HYGIENE AND OFFERING LEISURE EXPERIENCES SHOULD
SUPPORT GROWTH BUT STAND TO IMPACT ON INDEPENDENT PLAYERS.
Trish Caddy, Foodservice Analyst
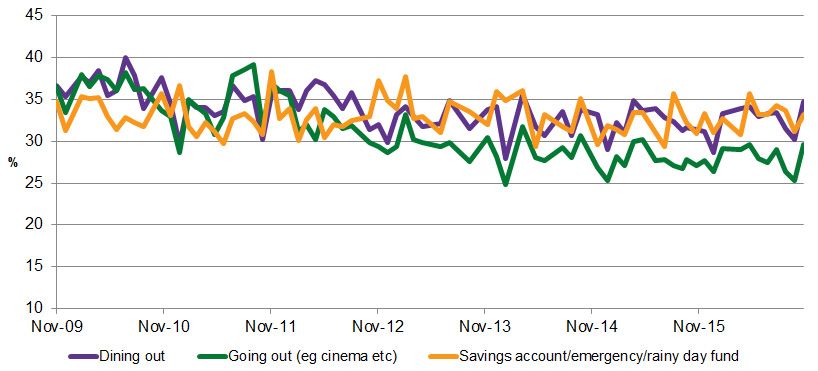
The market FIGURE 1: SELECTED CONSUMER SPENDING PRIORITIES (AFTER BILLS),
NOVEMBER 2009-16
Brits are still dining out
“Where do you choose to spend your extra money (once all of your bills are paid
Dining out and going out continue to be the and you have bought all of the things you really need)? Please select all that
most popular things people prefer to spend apply.”
their extra money on. The main challenger
for these leisure activities has been
savings, signalling that a level of consumer
caution has continued to linger since the
2008/09 recession. These priorities have
gone unchanged even as real incomes
began to rise in mid-2014, after the long
post-recession income squeeze.
Potential to target the over-55s
The population of 15-34-year-olds – ethnic
restaurants’ core users – grew by 3% from
2011 to 2016 to just 17 million people in
the UK. This age group is projected to
decline by 0.4% from 2016 to 2021, which Base: 2,000 internet users 16+
means the growth of customers coming Source: Lightspeed/Mintel
into this market will slow. Meanwhile, the
over-55s are forecasted to grow by 9.9%
from 2016 to 2021 to 21 million people in FIGURE 2: TRENDS IN THE AGE STRUCTURE OF THE UK POPULATION, 2011-
the UK, and these older cohorts represent 16 AND 2016-21
a customer group the foodservice sector
cannot overlook.
Shortage of skilled chefs
threatens the survival of ethnic
restaurants
The introduction of the new immigration
rules in 2011 stipulates that chefs hired
from outside Europe and the European
Economic Area (EEA) must earn £29,570
a year, excluding accommodation and
meals, which is a wage level beyond
the National Living Wage of £7.20 per
hour. The reduction in non-EU migration
work and the ongoing struggle to recruit
staff that are skilled in ethnic cuisines
will continue to intensify in a sector that
relies heavily on skilled chefs from outside
Europe and the EEA. Source: Office for National Statistics/Mintel
PREVIOUS NEXT
© Mintel Group Ltd. All rights reserved.
ETHNIC RESTAURANTS AND TAKEAWAYS, UK - JANUARY 2017 10
Key players than their older cohort to be the core living in Inner and Greater London (see
users of any ethnic restaurant/takeaway, Frequency of Visiting Ethnic Restaurants/
Zing Zing attracts heavyweight including women aged 16-24 and those Takeaways).
investors
London-based Chinese takeaway FIGURE 3: FREQUENCY OF VISITING AN ETHNIC RESTAURANT FOR A SIT-
brand, Zing Zing, has attracted Michael DOWN MEAL, FEBRUARY 2012, NOVEMBER 2012, OCTOBER 2015, AND
Sherwood, vice chairman of Goldman OCTOBER 2017
Sachs and the co-chief executive officer
of Goldman Sachs International, to “Thinking about ethnic restaurants/takeaways (eg Indian, Chinese, Thai, Mex-
back the business alongside 230 other ican, Middle Eastern etc), how frequently, if at all, do you normally use them,
armchair investors on Crowdcube. Its menu either for a sit-down meal or for a takeaway/home delivery? Please select one
innovation, for instance, Asian sesame per column.”
supergrain, and deep-fried Creme Egg
wontons, creates product standout in a
crowded takeaway sector and offers growth
opportunities for investors to buy into its
business model (see Market Share).
Wahaca launches supermarket
range
Sustained consumer interest in Mexican
flavours has led to continued product
launches in the retail segment aimed
at home cooks looking to emulate the
foods that they have tasted out of home.
Wahaca’s range of Soft Taco Kits,
launched in Tesco in July 2016, look well
placed to resonate, as at-home table Base: 2,000 internet users 16+
sauce users are more likely to buy a new Source: Lightspeed/Mintel
table sauce after trying it in a restaurant
(see Launch Activity and Innovation). FIGURE 4: FREQUENCY OF ORDERING AN ETHNIC TAKEAWAY/HOME
DELIVERY, FEBRUARY 2012, NOVEMBER 2012, OCTOBER 2015, AND
Giraffe trials World Kitchen OCTOBER 2017
When Giraffe launched Giraffe World “Thinking about ethnic restaurants/takeaways (eg Indian, Chinese, Thai, Mex-
Kitchen in Basingstoke in September 2016 ican, Middle Eastern etc), how frequently, if at all, do you normally use them,
under its new management, Boparan either for a sit-down meal or for a takeaway/home delivery? Please select one
Restaurant Holdings, it revealed a per column.”
menu of ethnic dishes from around the
world. Taking a cue from such casual
dining concepts in terms of their leisure
experiences and services may help
specialists win favour and drive footfall
(see Launch Activity and Innovation).
The consumer
Ethnic restaurant visits declined
in 2016
Ethnic restaurant visits declined between
2015 and 2016, with takeaway usage
falling by 2%, dine-in usage declining
by 3%, and non-usage increasing by Base: 2,000 internet users 16+
2%. 16-34-year-olds are more likely Source: Lightspeed/Mintel
PREVIOUS NEXT
© Mintel Group Ltd. All rights reserved.ETHNIC RESTAURANTS AND TAKEAWAYS, UK - JANUARY 2017 11
Chinese and Indian cuisines top meal, while women are more likely to use cohort (see Usage of Ethnic Restaurants/
the chart Chinese restaurants for takeaway meals Takeaways by Cuisine).
than men. Meanwhile, those aged 45-64
Both men and women are just as likely to are more likely to visit an Indian restaurant
visit a Chinese restaurant for a sit-down for a sit-down meal than their younger
FIGURE 5: USAGE OF ETHNIC RESTAURANTS/TAKEAWAYS BY CUISINE, OCTOBER 2017
“Which, if any, of the following types of ethnic restaurant/takeaway have you used when visiting a restaurant for a sit-
down meal/ordering a takeaway/home delivery? Please select all that apply per type.”
Base: 1,537 internet users aged 16+ that have eaten in an ethnic restaurant
Base: 1,584 internet users aged 16+ that have ordered a takeaway/home delivery from an ethnic restaurant/takeaway
Source: Lightspeed/Mintel
PREVIOUS NEXT
© Mintel Group Ltd. All rights reserved.ETHNIC RESTAURANTS AND TAKEAWAYS, UK - JANUARY 2017 12
£20 is the spend cap on a sit-down FIGURE 6: AVERAGE SPEND WHEN VISITING AN ETHNIC RESTAURANT FOR A
meal SIT-DOWN MEAL, OCTOBER 2016
Most diners would spend up to £20 on a “Approximately how much, if anything, do you typically spend on yourself when
sit-down meal in an ethnic restaurant; it visiting an ethnic restaurant for a sit-down meal? Please use the slider to indi-
is the average earners and women aged cate how much you typically spend.”
25-44, and those financially struggling
who tend to spend within this range (see
Average Spend on a Sit-Down or Home
Delivered Ethnic Meal).
Diners spend up to £15 for a home
delivered meal
Diners typically spend no more than
£14.99 on an ethnic meal, suggesting that
price is a key consideration when ordering
takeaway. Those who say that they are
financially tight are most likely to spend no
more than £15 on takeaway (see Average
Spend on a Sit-Down or Home Delivered
Ethnic Meal).
Base: 1,537 internet users aged 16+ that have had visited an ethnic restaurant/takeaway for a sit-down meal
Source: Lightspeed/Mintel
FIGURE 7: AVERAGE SPEND WHEN ORDERING A TAKEAWAY/HOME
DELIVERY FROM AN ETHNIC RESTAURANT, OCTOBER 2016
“Approximately how much, if anything, do you typically spend on yourself when
ordering a takeaway/home delivery from an ethnic restaurant (excluding delivery
charges)? Please use the slider to indicate how much you typically spend.”
Base: 1,584 internet users aged 16+ that have had ordered takeaway/home delivery from an ethnic restaurant/
takeaway
Source: Lightspeed/Mintel
PREVIOUS NEXT
© Mintel Group Ltd. All rights reserved.ETHNIC RESTAURANTS AND TAKEAWAYS, UK - JANUARY 2017 13
Good food hygiene ratings FIGURE 8: MOST IMPORTANT QUALITIES WHEN CHOOSING AN ETHNIC
RESTAURANT, OCTOBER 2016
Having good food hygiene ratings is one
of the most important qualities when “Which, if any of the following qualities are most important to you when deciding
choosing an ethnic restaurant. Older which ethnic restaurant/takeaway to visit/use? Please select up to 5.”
women and those from lower socio-
economic groups are also interested in
good hygiene ratings (see Restaurant
Choice Drivers).
Restaurant atmosphere can boost
the dining experience
Restaurant atmosphere, such as
decoration and music, is one of the most
important factors when choosing which
ethnic restaurant to visit. Older diners aged
45+ are more likely to consider restaurant
atmosphere than those aged 16-44 (see
Restaurant Choice Drivers).
Base: 1,732 internet users aged 16+ that have eaten in/ordered a takeaway/home delivery from an ethnic
restaurant/takeaway
Source: Lightspeed/Mintel
PREVIOUS NEXT
© Mintel Group Ltd. All rights reserved.ETHNIC RESTAURANTS AND TAKEAWAYS, UK - JANUARY 2017 14
Nutritional content on menu restaurants to leverage the demand for Streamlining menu items to focus on
greater lunch choices in the UK and high-quality ingredients and authentic
Most diners agree that menus should rival non-specialists that have been flavours should continue to appeal but
display the nutritional content for each encroaching on the ethnic restaurants’ the real winner is offering grab-and-
item, suggesting that people want to market share (see Attitudes towards Ethnic go lunch options to help create more
make informed choices when eating out of Restaurants and Takeaways). occasions for visiting ethnic restaurants.
home. Women aged 16-44 are more likely
to actively seek out nutritional contents What we think Continued focus on communicating
on menus (see Attitudes towards Ethnic good food hygiene ratings as well
Restaurants and Takeaways). Ethnic restaurants have enjoyed robust as displaying nutritional content on
growth since 2015 but this looks set to menus looks much needed, given
Grab-and-go lunch options slow as operators grapple with price hikes, that consumers want to know what
shortage of staff and weakening consumer they are eating and if their purchases
Grab-and-go lunch options such as confidence. are worthwhile. However, flexibility to
Vietnamese sandwiches and Korean- customise one’s own dish is also an
inspired salads from an ethnic restaurant Traditional ethnic restaurants that lack enticement to visit an ethnic restaurant
would appeal to young diners aged 16-34. innovation are at risk of falling behind for many diners.
This suggests an opportunity for ethnic more upscale casual dining concepts.
FIGURE 9: ATTITUDES TOWARDS ETHNIC RESTAURANTS AND TAKEAWAYS, OCTOBER 2016
“To what extent do you agree or disagree with the following statements about ethnic restaurants and takeaways? Please
select one per statement.”
Base: 2,000 internet users aged 16+
(a) eg Kerala region in India, Sichuan region in China
(b) eg Vietnamese sandwiches, Korean-inspired salads
(c) eg mobile payments, pre-ordering etc
(d) eg British-grown wasabi
(e) eg okonomiyaki – a savoury Japanese pancake
(f) eg level of spice, portion sizes, choice of glaze
(g) ie a sharing platter consisting of 3-5 menu items at one price
(h) eg courgette noodles, cauliflower rice etc
Source: Lightspeed/Mintel
PREVIOUS NEXT
© Mintel Group Ltd. All rights reserved.ISSUES & INSIGHTS PREVIOUS NEXT
ETHNIC RESTAURANTS AND TAKEAWAYS, UK - JANUARY 2017 16
Lunch options can strengthen The facts
ethnic restaurants
• 9% of Brits strongly agree and 31% of Brits agree that grab-and-go lunch options from
an ethnic restaurant would be appealing.
• 11% of Brits strongly agree and 39% of Brits would like to try street food-style dishes.
• 6% of Brits strongly disagree and 27% of Brits disagree that ethnic food is cooked with
unhealthy ingredients.
• 11% of Brits strongly agree and 39% of Brits agree that customisable dishes would be
appealing.
• 7% of Brits strongly agree and 30% of Brits agree that using high-quality ready-made
ingredients are just as authentic as cooking from scratch.
The implications
Branded sandwich shops have encroached into the ethnic sector and made inroads
into offering ethnic-inspired sandwiches and salads. It is now increasingly important for
specialist ethnic restaurants to innovate around healthy grab-and-go lunch options to
play in the lunch market.
Given that many people perceive ethnic food to be cooked with healthy and authentic
ingredients, rolling out healthy grab-and-go lunch options will in many cases increase
popularity.
Chop & Wok, the Birmingham-based Indian and pan-Asian takeaway restaurant chain,
stands out from other grab-and-go operators with its range of healthy, customisable lunch
meal deals – currently available as a £5.95 build-your-own salad, wrap or stir-fry dish
meal deal with complimentary prawn crackers and a drink.
Produce high-quality and healthy The facts
dishes
• 15% of consumers strongly agree and 36% of consumers agree that menus should
display nutritional content for each item.
• 12% of Brits strongly agree and 36% of Brits agree that healthier alternatives would be
appealing.
• Healthier ingredients are important to 16% of ethnic restaurant users.
• Local ingredients are important to 15% of ethnic restaurant users.
• Sustainability certified meat/seafood/poultry are important to 10% of ethnic restaurant
users.
PREVIOUS NEXT
© Mintel Group Ltd. All rights reserved.ETHNIC RESTAURANTS AND TAKEAWAYS, UK - JANUARY 2017 17
The implications
Consumers’ desire for healthy eating may explain the interest in seeing nutritional
content displayed on menus, giving them a perception of control over what they eat.
Though such features remain rare in this market, they have been explored in non-
specialists, such as Leon, Crussh, and POD. This suggests that consumers want to
make informed decisions on what to eat when choosing a restaurant to visit.
Offering healthy ethnic food options should also inspire concept development that will
lure customers who buy into clean eating. As consumers look for alternatives to healthy
sandwiches and salads, fast casual concepts featuring a strong ethnic proposition have a
good shot at filling the gap in the market.
Itsu’s continued push into the healthy pan-Asian fast casual sector paid off when the
company saw net income increase to more than £800 million in 2010 from just £60
million in 2005. This example offers something of a litmus test for operators looking for
new routes to market and how they can leverage consumers’ interest in healthy, ethnic
food options in the UK.
Digital innovation can add value to The facts
the dining experience
• 13% of consumers strongly agree and 35% of consumers agree that receiving a
rewards-based loyalty card would be appealing.
• 11% of consumers strongly agree and 29% of consumers agree that they would be
interested in using electronic payment methods.
• Online reviews are important to 20% of ethnic restaurant users.
• 11% of consumers strongly agree and 42% of consumers agree that bundle value
deals are appealing.
The implications
Traditional sit-down restaurants that offer takeaway options have been allowing
customers to order and pre-pay in advance via mobile apps. What started out as a
simple solution that centres on technology to shave minutes off a restaurant visit looks
set to become a mainstay in UK’s foodservice sector as consumers reach towards a
cashless dining experience.
When Tossed, a London-based fast casual concept, became UK’s first cashless
restaurant, it noted the efficiency of self-ordering kiosks has helped free up staff to focus
on meal preparation and other back-of-house roles, and as a result, Tossed started
turning tables at a faster rate than ever before.
Such technology should rapidly gain traction in the foodservice sector as it grapples
with staff shortage; automating some aspects of customer-facing processes may allow
operators to cut the frontline staff and focus on back-of-house functions. Operators slow
to adopt such technologies will find themselves in a competitive disadvantage.
In the longer term, operators should focus on adopting a seamless customer journey
through a single integrated system that consolidates table booking, placing an order,
paying for the meal, collecting loyalty points and leaving an online review, within one app.
PREVIOUS NEXT
© Mintel Group Ltd. All rights reserved.THE MARKET PREVIOUS NEXT
ETHNIC RESTAURANTS AND TAKEAWAYS, UK - JANUARY 2017 19
What you need to know
Ethnic restaurants market is in growth Shortfall of hospitality staff intensifies
Amid concerns over the political uncertainty caused by the Brexit While Brexit has caused some uncertainty in the market, it also
vote, the UK foodservice sector enjoyed an increased in overall offers opportunities for the UK government to adopt policies or
spend in 2015, fuelled by an uplift in new entrants into the market change laws to offer greater support for the foodservice sector
and consumer appetite to spend on the experience economy. that has clearly demonstrated how heavily dependent it is on
However, the market is expected to slow to 4.7% in 2016 from foreign nationals, especially to fill back-of-house roles in the
£9.8 billion to £10.3 billion, as the weakened pound looks set to ethnic restaurants sector. Without government intervention, the
dampen both business and consumer confidence (see Segment staffing crisis will intensify in restaurant kitchens and drive up
Performance, Market Size and Forecast). wage levels beyond legislative thresholds and stifle business
growth (see Market Drivers).
Brands need to provide more reasons to visit
Potential to target older age groups
The savvy consumer habits adopted in and since the last
recession have been retained by many people. As such, any Although usage of ethnic restaurants declines with age, the drop
tightening of incomes is more likely to simply halt or reverse the is gradual between age groups, given that 84% of consumers
slow shift away from austerity habits than to see a sharp change aged 45-64 have used ethnic restaurants, as compared to 93%
in behaviour similar to that nearly a decade ago. The onus of those aged 16-34 and 88% of those aged 35-44. These trends
remains on operators to provide additional reasons to visit, as should urge ethnic restaurant operators to focus on retaining
consumers have learnt frugal lessons during the tough economic usage among their core users as they move into an older age
times (see Segment Performance, Market Size and Forecast). bracket (see Market Drivers).
Costs are going up
The weakened pound against the US dollar and euro looks set to
lead to food price inflation for ethnic restaurants that import most
of their raw ingredients. Meanwhile, a new rating list provided by
The Valuation Office Agency is due to roll out in April 2017. This
2017 revaluation will see business rates increase significantly
across London as well as prime cites such as Manchester and
Newcastle. Further rises in the National Living Wage pose
a challenge as operators grapple with weakening consumer
confidence and the falling pound (see Market Drivers).
PREVIOUS NEXT
© Mintel Group Ltd. All rights reserved.ETHNIC RESTAURANTS AND TAKEAWAYS, UK - JANUARY 2017 20
Segment performance, market
size, and forecast
Ethnic restaurants are in growth of trade interviews, analysis of company the weakened pound looks set to dampen
results and consumer research findings, both business and consumer confidence.
This data is not directly comparable to Mintel believes that the previous market
the market size given in previous editions size underestimated the total size of the The top end of the takeaway segment
of this report, or in the data included in market. This, combined with the change in continues to make concerted efforts to
Mintel’s The Eating Out Review – UK, July the coverage, means that the market size push digital innovation and e-commerce
2016 Report. Mintel previously estimated reported in the 2016 Report is significantly with advanced technology, while
the market size based on sales of food higher than that seen in previous Reports. restaurants become a destination
only, and excluded the value of any business with healthy options and
alcoholic and non-alcoholic drinks sales. The ethnic restaurants market enjoyed customer service as main areas of focus.
For this year’s Report, Mintel has revised robust growth in 2015. Amid concerns
this approach and decided that including over the political uncertainty caused by However, growth stands to impact on
the value of drinks sales gives a more the Brexit vote, the increased overall independent players. The onus is on
complete picture of the overall health of spend in 2015 was fuelled by an uplift operators to adapt their business model
the market. in new entrants into the market and by changing their offering to maximise
consumer appetite to spend on the sales or risk being priced out of the
This change has also allowed Mintel to experience economy. However, the market by casual dining concepts that
re-examine the methodology used to market is expected to slow to 4.7% in operate on sales volume and market
estimate market size. Using a combination 2016 from £9.8 billion to £10.3 billion, as share.
FIGURE 10: VALUE SALES^ OF THE TOTAL UK ETHNIC RESTAURANT/TAKEAWAY MARKET, 2011-21
Total Index % £ m at Index %
£m annual change 2016 prices annual change
2011 6,692 65 na 7,433 72 na
2012 7,151 69 6.9 7,705 75 3.7
2013 7,880 76 10.2 8,264 80 7.3
2014 9,015 87 14.4 9,241 90 11.8
2015 9,839 95 9.1 9,926 96 7.4
2016 (est) 10,305 100 4.7 10,305 100 3.8
2017 (fore) 10,605 103 2.9 10,771 105 4.5
2018 (fore) 11,104 108 4.7 11,438 111 6.2
2019 (fore) 11,457 111 3.2 12,035 117 5.2
2020 (fore) 12,088 117 5.5 12,697 123 5.5
2021 (fore) 12,799 124 5.9 13,471 131 6.1
^ data is not comparable to previous years’ Reports. Please see main text for further details.
Source: Mintel
PREVIOUS NEXT
© Mintel Group Ltd. All rights reserved.ETHNIC RESTAURANTS AND TAKEAWAYS, UK - JANUARY 2017 21
Consumer confidence starts to to linger (see Average Spend on a Sit- Given that the over-55s make up almost
falter in the year ahead Down or Home Delivered Ethnic Meal). 30% of the population, these older cohorts
represent a customer group the eating
While eating out remains one of the top While consumer confidence will start out sector can ill afford to ignore. This
priorities for what consumers spend any to falter in the year ahead in response suggests scope for operators to win over
extra money on, 34% of diners typically to the changing economic and political this growing age group to help bolster
spend no more than £14.99 on a takeaway picture, the prospect remains that real sales.
ethnic meal, as frugal tendencies picked household incomes will come under
up during the 2008/09 recession continue pressure.
FIGURE 11: UK ETHNIC RESTAURANTS TOTAL MARKET, VALUE SALES AND FORECAST, 2011-21
Source: Mintel
PREVIOUS NEXT
© Mintel Group Ltd. All rights reserved.You can also read