EU economic developments and projections - European ...
←
→
Page content transcription
If your browser does not render page correctly, please read the page content below
BRIEFING
EU economic developments and
projections
This briefing provides a summary of the recent economic developments in the EU
Member States and gives an overview of relevant economic projections forecasted by
major international and EU institutions.
1. Recent economic developments
According to the latest Eurostat data, the seasonally-adjusted Gross Domestic Product (GDP) in the euro
area has rebounded by 12.5% in the third quarter of 2020, compared to the previous quarter while the
growth in the EU was 11.5% during the same period. This was a rebound compared to the second quarter
of 2020, when GDP had decreased by 14.7% in the euro area and by 13.9% in the EU.
While a rebound was observed for all these countries compared to the second quarter, the year on year
growth rates were still negative in all the EU Member States.
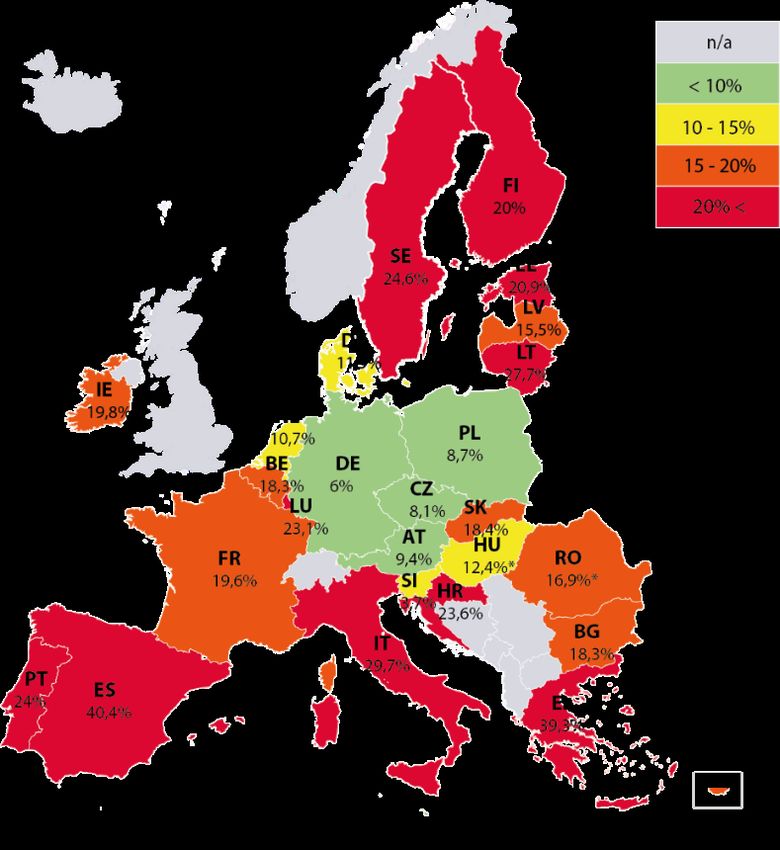
Figure 1: Youth unemployment (aged 15-24, % of labour force, September 2020)
Source: EGOV based on Eurostat; Note: * Latest data is available only for August 2020 (EE and HU), July 2020 (EL) and June 2020 (RO)
Economic Governance Support Unit (EGOV)
Authors: K. Grigaitė, J. Vega Bordell, I. Lara Miranda,
M. Marchionni, O. Turcu EN
Directorate-General for Internal Policies
PE 645.716 - January 2021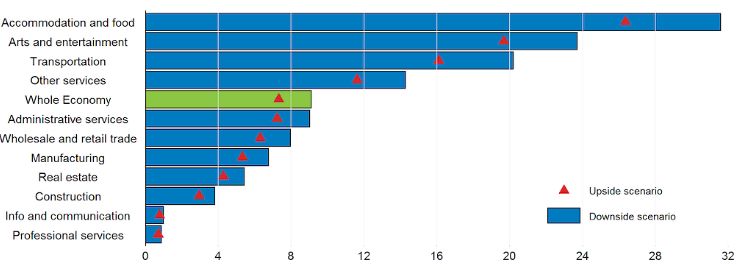
EU economic developments and projections

According to the most recent Eurostat estimates, the number of employed persons increased by 1.0% in the
euro area and 0.9% in the EU in the third quarter of 2020, compared with the previous quarter. In the second
quarter of 2020, employment had decreased by 3.0% in the euro area and by 2.8% in the EU.
In September 2020, the youth unemployment rate was 17.1 % in the EU and 17.6 % in the euro area, down
from 17.8 % and 18.3 % respectively in the previous month (see Figure above).
Euro area annual inflation was -0.3% in November 2020, stable compared to October according to Eurostat
estimate. The main components that contributed positively were food, alcohol and tobacco, as well as
services, while industry goods and most notably energy contributed negatively.
Please see the Annexes for an overview of a more detailed data on GDP and Inflation for each Member State.

                                Box 1: COVID-19 crisis impact on service sector
 The COVID-19 pandemic, combined with the confinement measures have strongly influenced the service sector.
 According to the latest analysis published by Eurostat, the production of services have declined since the beginning
 of the pandemic.
 The production of services in the EU has fluctuated over the first quarter of 2020. In March and April, due to the strict
 containment measures implemented by Member States the production of services decreased by 11.7% and 13.0%
 respectively (in comparison to the previous month). In May, the production of services remained relatively stable and
 amounted to only 0.5% decrease; whereas in June, as most of the restrictions were partly lifted, there was an increase
 of 8.6% in comparison to the previous month (developments in service sector observed in the euro area countries
 has been similar). In the second quarter of 2020, the total services turnover in the EU declined by 16.5% and in euro
 area countries by 18.1%. However, the levels of service production before the pandemic were still higher than
 observed lately.
 The most affected subsector has been accommodation and food services (hotels and restaurants), in which the
 turnover in the second quarter of 2020 decreased by 55.4% in the EU and 57.1% in euro area countries. The turnover
 of tourism services (air transports, hotels, tour operators, etc.) decreased severely between February and June 2020.
 Even though there was a recovery during May and June, the turnover in June was still 70% lower than in February
 2020. Countries that rely more on the tourism sector, such as Portugal (-93.5%) and Spain (-88.7%), have suffered the
 most. On the contrary, the subsector that recorded the lowest growth change has been Information and
 Communication. It dropped by 3.1% and 3.6% in the EU and euro area respectively over the second quarter of 2020.
 The effects of this crisis in the service sector has had a strongest impact than in 2008. In 2008, the total production of
 services dropped only by 4.7 index points (2015 are taken as base year for the index, when the index is set to be equal
 to 100). In 2020, only from February to June it decreased by 20.4 index points.

2. Latest economic forecasts
2.1. European Central Bank (ECB)
On 10 December, the ECB published its latest economic projections for the euro area. Given the recent
intensification of containment measures, another decline in the economic activity in both the fourth quarter
of 2020 and first quarter of 2021 is expected.
Based on the above mentioned baseline scenario, the ECB is projecting that the euro area real GDP will
contract by 7.3% in 2020 and should rebound by 3.9% in 2021, followed by 4.2% growth in 2022. By the end
of the projection horizon (end-of-2023), the level of real GDP would stand 2.5% above its 2019 pre-crisis
level. Similarly, the HICP inflation is expected to increase from 0.2% in 2020 to 1.0% and 1.1% in 2021 and
2022, respectively. Compared with the ECB staff projections published in September, inflation predictions
has been revised down for 2020 and 2022.
In view of the uncertainty about how the pandemic will evolve, the ECB has once again prepared economic
projections under two alternative scenarios: “The mild scenario sees a more successful containment of the virus,
a swift roll-out of vaccines and limited scarring. In this scenario, real GDP would rebound by 6.0% next year,
reaching pre-crisis levels as early as the end of 2021, with inflation rising to 1.5% in 2023. In contrast, the severe

                                                           2                                                  PE 645.716
IPOL | Economic Governance Support Unit

scenario, with a delayed resolution of the health crisis and substantial and permanent losses to economic
potential, would imply a marginal increase in 2021 in real GDP, which would stand in 2023 still almost 2% below
its pre-crisis levels, with inflation at only 0.8% in that year.”
See Annexes for the forecast figures for all Member States.

2.2. Organisation for Economic Co-operation and Development (OECD)
On 1 December, the OECD published its latest economic projections and was the first institution to take into
account the announcement of few available vaccines against Covid-19. It is projected that the recovery will
gain momentum over the coming two years, as it is expected that scientific progress, pharmaceutical
advances, more effective tracing and isolation, as well as adjustments in the behaviour of people and firms
will allow to progressively lift off the restrictions on mobility. The reduced uncertainty together with active
policy support improvements are expected to fuel consumption and investment.
The OECD projects that the euro area GDP will decline by 7.3% in 2020 and will pick up by 4.7% and 2.9% in
2021 and 2022 (year-on-year) respectively. Nevertheless, the OECD highlights that there are considerable
differences projected across individual countries. Globally, it is projected that the GDP level at the end of
projection period (end-of-2022) will be around 5% below pre-crisis level.
Despite the slight upward revision of the economic projections for 2021, the economic outlook continues
to be exceptionally uncertain, with both upside and downside risks plausible. “On the upside, efficient
vaccination campaigns and better co-operation between countries could accelerate the distribution of the
vaccine worldwide. Conversely, the current resurgence of the virus in many places reminds us that governments
may be forced again to tighten restrictions on economic activity, especially if the distribution of effective vaccines
progresses slowly. And confidence would take a hit if vaccine distribution or secondary effects proved
disappointing. The toll on the economy could be severe, in turn raising the risk of financial turmoil from fragile
sovereigns and corporates, with global spillovers.”
See Annexes for the forecast figures for all Member States.

PE 645.716                                               3
EU economic developments and projections

       Box 2: Assessment of insolvency and debt overhang following the COVID-19 outbreak
Together with their recent economic projections, the OECD has published an analytical note investigating the
likelihood of corporate insolvency and the potential implications of debt overhang for non-financial corporations
as an aftermath pf the pandemic outbreak.
The estimations reveal that the decline is profits is sizeable (on average between 40% and 50% of normal-time
profits), which leads to a conclusion that 7.3% of otherwise viable companies (9.1% in the downside scenario) would
become distressed (see Figure A). This effect that is due to the COVID-19 shock should be added to approximately
8% of firms who are estimated to already be endangered in a no-COVID-19 scenario (resulting in a double total
number of distressed firms as compared with “normal times”).
Figure 2: Percentage of otherwise viable firms turning distressed: Whole economy and sectorial
disaggregation

Note: The figure shows the percentage of distressed firms in the upside (red triangles) and downside (green and blue bars)
scenarios for the whole economy and at the sector level (1-Digit NACE Rev2 classification). Firms are defined as distressed if their
book value of equity is predicted to be negative one year after the implementation of containment measures. The sample is
restricted ex-ante to firms having both positive profits and book value of equity in the 2018 reference year. Source: OECD
calculations based on Orbis® data.

2.3. European Commission (Commission)
On 5 November, the Commission presented its Autumn 2020 Economic Forecast. Given the rapidly changing
economic environment and uncertainty, the Commission relies on several key patterns when estimating the
projections: “first, it is clear that the future course of the pandemic will play a key role in determining the future
path of economic growth ... second, the economic impact of the pandemic and future recovery prospects will
differ widely across the EU ... [and] third, policy measures matter”. Given such a strong reliance on the
abovementioned assumptions, the Commission has provided one alternative scenario analyses for the
plausible evolution of the pandemic and its economic impact.
The baseline scenario assumes that containment measures after a significant tightening in the fourth
quarter of 2020, will gradually ease in 2021 and 2022, however, will remain to some degree in force through
the entire forecasting horizon (which is end-of-2022). Another important baseline scenario assumption is
made with regard to the future trading relationship between the UK and the EU, which assumes (without
any prejudice to the outcome of the ongoing negotiations) that “the EU and the UK will trade on WTO Most
Favoured Nation rules from 1 January 2021 onwards”.
Under this baseline scenario, “overall, EU GDP is forecast to contract by about 7½% this year before rebounding
by 4% in 2021, which is less than previously forecast, and by 3% in 2022. This implies that the output in the
European economy would barely return to pre-pandemic levels in 2022.”

                                                                4                                                        PE 645.716
IPOL | Economic Governance Support Unit
Based on the Commission baseline forecasts for each Member State, by the end of 2021, only Ireland and
Lithuania will recover to their pre-pandemic GDP level 1 (Ireland will have 0.5% and Lithuania will have 0.7%
higher GDP than at the end of 2019).
By the end of 2022, Germany (by 0.2%), Estonia (by 2.1%), Cyprus (by 0.2%), Latvia (by 2.5%), Luxembourg
(by 1.9%), Malta (by 1.4%), Slovenia (by 1.3%), Slovakia (by 1.0%), Finland (by 1.0%), Czech Republic (by 0.3%),
Denmark (by 1.9%), Hungary (by 1.7%), Poland (by 3.1%), Romania (by 1.6%) and Sweden (by 2.2%) will
surpass their GDP levels observed in 2019.
All the remaining Member States (Belgium, Greece, Spain, France, Italy, Netherlands, Austria, Portugal and
Croatia) will not reach their pre-pandemic GDP levels even at the end of 2022.
In addition, the Commission highlights several downside and upside risks that could have significant impact
on the economic outlook. Among the downside risk factors are: further unanticipated development of the
pandemic, deeper economic scars resulting from the pandemic and confinement, weaker global economic
developments as well as financial market stress would lead to lower growth, higher unemployment, higher
number of corporate bankruptcies and higher levels of non-performing loans, just to name a few. On the
upside: faster medical advances in the treatment and vaccine, a positive impact from a trade agreement
between the EU and the UK, and Next Generation EU programme (including the Recovery and Resilience
Facility) would provide a stronger boost to the EU economy that are not accounted for the in the current
projection round.
See Annexes for the forecast figures for all Member States.
2.4. International Monetary Fund (IMF)
On 13 October, the IMF published its latest World Economic Outlook including economic projections. Given
the better-than-anticipated second quarter GDP results and early indicators for a stronger recovery in the
third quarter, the IMF has revised its’ previous projections upwards. The baseline forecasting scenario
assumes that in the short-term “social distancing will continue into 2021 but will subsequently fade over time
as vaccine coverage expands and therapies improve“. “Adjustments costs and productivity impact for surviving
firms as they upgrade their workplace safety, the amplification of the shock via firm bankruptcies, costly resource
reallocation across sectors, and discouraged workers’ exit from the workforce” will be dominating negative
economic effects over the medium term, according to the baseline scenario.
Euro area GDP is projected to decline by 8.3% in 2020 and get back to positive 5.2% growth in 2021.
According to the IMF, in the medium term global growth is expected to average about 3.5% in 2020-2025,
which implies only limited progress towards catching up to the economic activity before the pandemic.
Overall, the pandemic crisis will setback the average living standards causing increasing inequality and rise
in extreme poverty.
There is a large uncertainty surrounding the baseline forecasting scenario: “A first layer relates to the path of
the pandemic, the needed public health response, and the associated domestic activity disruptions ... another
source of uncertainty is the extent of global spillover from soft demand, weaker tourism, and lower remittances
... a third set of factors comprises financial market sentiment and its implications for global capital flows”.
See Annexes for the forecast figures for all Member States.
1
EGOV calculations based on the European Commission Autumn 2020 forecast.
PE 645.716 5EU economic developments and projections
Box 3: Economic effects of COVID-19
In its recent World Economic Outlook, the IMF has tried to shed some light on the extent to which the economic
contraction was driven by the adoption of government lockdowns instead of by people voluntarily reducing
social interactions for fear of contracting or spreading the virus. The IMF argues “this issue is important to
understand retrospectively the nature of the recession and to provide insights into the strength of the upcoming
recovery. If lockdowns were largely responsible for the economic contraction, it would be reasonable to expect a quick
economic rebound when they are lifted. But if voluntary social distancing played a predominant role, then economic
activity would likely remain subdued until health risks recede.”
The analysis reveals that countries that endured more stringent lockdown measures experienced larger growth
declines relative to pre–COVID-19 forecasts. Furthermore, the analysis suggests that “lockdowns and voluntary
social distancing played a near comparable role in driving the economic recession. The contribution of voluntary
distancing in reducing mobility was stronger in advanced economies, where people can work from home more easily
and sustain periods of temporary unemployment because of personal savings and government benefits.”
“When looking at the recovery path ahead, the importance of voluntary social distancing as a contributing factor to
the downturn suggests that lifting lockdowns is unlikely to rapidly bring economic activity back to potential if health
risks remain. This is true especially if lockdowns are lifted when infections are still relatively high because, in those cases,
the impact on mobility appears more modest. Further tempering the expectations of a quick economic rebound, the
analysis documents that easing lockdowns tends to have a positive effect on mobility, but the impact is weaker than
that of tightening lockdowns. These findings suggest that economies will continue to operate below potential while
health risks persist, even if lockdowns are lifted.”
Therefore, IMF argues that policymakers should be wary of removing policy support too quickly and consider
ways to protect the most vulnerable and support economic activity consistent with social distancing. These may
include measures to reduce contact intensity and make the workplace safer, for example by promoting
contactless payments; facilitating a gradual reallocation of resources toward less-contact-intensive sectors; and
enhancing work from home.
Furthermore, the IMF notes that women carry a disproportionate burden in caring for children, which may
jeopardize their employment opportunities. Data also show that lockdowns tend to have a stronger impact on
younger cohorts, who are economically more vulnerable because they generally rely on labour income and have
less stable jobs. Thus, targeted policy intervention is needed to protect especially the employment prospects of
women and younger cohorts and prevent a widening of income inequality.
Disclaimer and copyright. The opinions expressed in this document are the sole responsibility of the authors and do not necessarily represent
the official position of the European Parliament. Reproduction and translation for non-commercial purposes are authorised, provided the
source is acknowledged and the European Parliament is given prior notice and sent a copy. © European Union, 2021.
Contact: egov@ep.europa.eu
This document is available on the internet at: www.europarl.europa.eu/supporting-analyses
6 PE 645.716IPOL | Economic Governance Support Unit
Annex 1: EU Gross domestic product
Eurostat* (12/2020) EC (11/2020) IMF (10/2020) ECB (12/2020) OECD (12/2020)
2018 2019 2020 Q1 2020 Q2 2020 Q3 2020 2021 2022 2020 2021 2022 2020 2021 2022 2020 2021 2022
BE 1.8 1.7 -3.4 -11.8 11.4 -8.4 4.1 3.5 -8.3 5.4 2.7 -6.7 3.5 3.1 -7.5 4.7 2.7
DE 1.3 0.6 -1.9 -9.8 8.5 -5.6 3.5 2.6 -6.0 4.2 3.1 -5.5 3.0 4.5 -5.5 2.8 3.3
EE 4.4 5.0 -0.8 -5.5 3.3 -4.6 3.4 3.5 -5.2 4.5 3.7 -2.5 2.9 4.2 -4.7 3.4 3.3
IE 8.5 5.6 -3.5 -3.2 11.1 -2.3 2.9 2.6 -3.0 4.9 4.3 0.5 3.1 3.9 -3.2 0.1 4.3
EL 1.6 1.9 0.1 -14.1 2.3 -9.0 5.0 3.5 -9.5 4.1 5.6 -10.0 4.2 4.8 -10.1 0.9 6.6
ES 2.4 2.0 -5.3 -17.9 16.4 -12.4 5.4 4.8 -12.8 7.2 4.5 -11.1 6.8 4.2 -11.6 5.0 4.0
FR 1.8 1.5 -5.9 -13.8 18.7 -9.4 5.8 3.1 -9.8 6.0 2.9 -9.3 4.8 5.0 -9.1 6.0 3.3
IT 0.9 0.3 -5.5 -13.0 15.9 -9.9 4.1 2.8 -10.6 5.2 2.6 -9.0 3.5 3.8 -9.1 4.3 3.2
CY 5.2 3.1 -0.9 -13.1 9.4 -6.2 3.7 3.0 -6.4 4.7 3.6 -6.2 4.1 3.4
LV 4.0 2.1 -2.3 -7.1 7.1 -5.6 4.9 3.5 -6.0 5.2 5.0 -4.7 2.8 5.3 -4.3 2.4 4.0
LT 3.9 4.3 0.0 -5.9 3.8 -2.2 3.0 2.6 -1.8 4.1 3.7 -2.0 1.9 4.0 -2.0 2.7 3.1
LU 3.1 2.3 -1.5 -7.4 9.8 -4.5 3.9 2.7 -5.8 5.9 3.7 -5.2 4.7 5.0 -4.4 1.5 3.8
MT 5.2 4.9 -2.7 -17.1 12.7 -7.3 3.0 6.2 -7.9 4.8 5.5 -7.5 5.9 4.4
NL 2.4 1.7 -1.5 -8.5 7.7 -5.3 2.2 1.9 -5.4 4.0 2.1 -4.3 2.9 2.9 -4.6 0.8 2.9
AT 2.6 1.4 -2.8 -11.6 12.0 -7.1 4.1 2.5 -6.7 4.6 2.1 -7.6 3.0 4.0 -8.0 1.4 2.3
PT 2.8 2.2 -4.0 -13.9 13.3 -9.3 5.4 3.5 -10.0 6.5 4.8 -8.1 3.9 4.5 -8.4 1.7 1.9
SI 4.4 3.2 -4.7 -9.8 12.4 -7.1 5.1 3.8 -6.7 5.2 3.4 -7.6 3.1 4.5 -7.5 3.4 3.5
SK 3.8 2.3 - - - -7.5 4.7 4.3 -7.1 6.9 4.8 -5.7 5.6 4.8 -6.3 2.7 4.3
FI 1.5 1.1 -1.5 -3.9 3.3 -4.3 2.9 2.2 -4.0 3.6 2.0 -3.8 2.2 2.5 -4.0 1.5 1.8
EA 1.9 1.3 -3.7 -11.7 12.5 -7.8 4.2 3.0 -8.3 5.2 3.1 -7.3 3.9 4.2 -7.5 3.6 3.3
BG 3.1 3.7 0.4 -10.1 4.3 -5.1 2.6 3.7 -4.0 4.1 3.7 -4.1 3.3 3.7
CZ 3.2 2.3 -3.3 -8.5 6.9 -6.9 3.1 4.5 -6.5 5.1 4.3 -6.8 1.5 3.3
DK 2.2 2.8 -1.5 -7.1 5.2 -3.9 3.5 2.4 -4.5 3.5 2.5 -3.9 1.8 2.5
HR 2.8 2.9 -1.3 -15.0 6.9 -9.6 5.7 3.7 -9.0 6.0 4.4
HU 5.4 4.6 -0.4 -14.6 11.4 -6.4 4.0 4.5 -6.1 3.9 4.0 -5.7 2.6 3.4
PL 5.4 4.5 -0.3 -9.0 7.9 -3.6 3.3 3.5 -3.6 4.6 4.5 -3.5 2.9 3.8
RO 4.5 4.2 0.0 -12.2 5.6 -5.2 3.3 3.8 -4.8 4.6 3.9 -5.3 2.0 4.4
SE 2.0 1.3 0.3 -8.0 4.9 -3.4 3.3 2.4 -4.7 3.5 2.9 -3.2 3.3 3.3
EU 2.1 1.5 -3.3 -11.3 11.5 -7.4 4.1 3.0
* Note: For 2018 and 2019 the GDP growth is provided year-on-year change, while 2020 Q1, Q2 and Q3 are quarter-on-quarter changes.
PE 645.716 7EU economic developments and projections
Annex 2: EU HICP Inflation (annual rate of change)
Eurostat (12/2020) EC (11/2020) IMF (10/2020) ECB (12/2020) OECD (12/2020)
2018 2019 2020 Q1 2020 Q2 2020 Q3 2020 2021 2022 2020 2021 2022 2020 2021 2022 2020 2021 2022
BE 2.3 1.2 0.4 0.2 0.5 0.4 1.4 1.6 0.6 1.2 1.4 0.4 1.7 1.9 0.5 0.7 0.6
DE 1.9 1.4 1.3 0.8 -0.4 0.4 1.4 1.3 0.5 1.1 1.3 0.4 1.8 1.3 0.4 1.1 1.3
EE 3.4 2.3 1.0 -1.6 -1.3 -0.5 1.4 2.1 0.2 1.4 2.2 -0.6 1.3 2.0 -0.7 1.3 2.1
IE 0.7 0.9 0.5 -0.6 -1.2 -0.5 0.3 1.6 -0.2 0.6 1.9 -0.6 -0.7 0.3 -0.4 0.4 1.0
EL 0.8 0.5 0.2 -1.9 -2.3 -1.3 0.9 1.3 -0.6 0.7 0.9 -1.3 -0.1 0.6 -1.2 -0.2 0.8
ES 1.7 0.8 0.1 -0.3 -0.6 -0.2 0.9 1.0 -0.2 0.8 1.4 -0.3 0.6 1.2 -0.3 0.4 0.6
FR 2.1 1.3 0.8 0.2 0.0 0.5 0.9 1.5 0.5 0.6 1.0 0.5 0.5 0.8 0.5 0.4 0.8
IT 1.2 0.6 0.1 -0.4 -1.0 -0.1 0.7 1.0 0.1 0.6 0.9 -0.2 0.5 0.9 -0.1 0.4 0.8
CY 0.8 0.5 0.1 -2.2 -1.9 -0.9 0.9 1.3 -0.6 1.0 1.0 -1.2 0.5 0.9
LV 2.6 2.7 1.4 -1.1 -0.4 0.3 1.3 1.8 0.6 1.8 2.2 0.1 1.1 1.6 0.1 0.4 1.5
LT 2.5 2.2 1.7 0.9 0.6 1.3 1.5 1.7 1.3 1.7 1.9 1.1 1.1 1.8 1.2 1.5 1.8
LU 2.0 1.6 0.3 -0.4 -0.3 0.2 1.5 1.8 0.4 1.4 1.8 0.0 1.9 1.7 0.1 0.9 1.3
MT 1.7 1.5 1.2 1.0 0.5 0.8 1.3 1.6 0.8 1.1 1.4 0.8 0.9 1.4
NL 1.6 2.7 1.1 1.7 1.0 1.1 1.3 1.4 1.2 1.5 1.5 1.2 1.5 1.5 1.0 0.9 1.1
AT 2.1 1.5 1.6 1.1 1.2 1.5 1.7 1.7 1.2 1.8 1.8 1.3 1.4 1.7 1.3 1.3 1.6
PT 1.2 0.3 0.1 0.2 -0.8 -0.1 0.9 1.2 0.0 1.1 1.2 -0.2 0.3 0.9 -0.2 -0.2 0.3
SI 1.9 1.7 0.7 -0.8 -0.7 0.0 0.9 1.8 0.5 1.8 1.7 -0.2 0.9 1.3 0.1 1.7 1.4
SK 2.5 2.8 2.4 1.8 1.4 2.0 0.7 1.4 1.5 1.5 1.9 2.0 0.6 1.8 1.9 0.9 1.4
FI 1.2 1.1 0.9 0.1 0.3 0.4 1.1 1.4 0.7 1.3 1.5 0.4 0.9 1.2 0.5 1.0 1.4
EA 1.8 1.2 0.7 0.3 -0.3 0.3 1.1 1.3 0.4 0.9 1.2 0.2 1.0 1.1 0.3 0.7 1.0
BG 2.6 2.5 2.4 0.9 0.6 1.2 1.4 1.8 1.2 1.7 2.1 1.6 1.4 1.8
CZ 2.0 2.6 3.6 3.4 3.3 3.4 2.3 2.0 3.3 2.4 2.2 3.3 2.2 2.0
DK 0.7 0.7 0.3 0.2 0.5 0.3 1.1 1.3 0.4 0.9 1.2 0.4 0.7 0.9
HR 1.6 0.8 0.5 -0.4 -0.3 0.1 1.2 1.5 0.3 0.8 1.1
HU 2.9 3.4 3.9 2.9 3.4 3.4 3.3 3.0 3.3 3.2 3.0 3.5 3.3 3.6
PL 1.2 2.1 3.9 3.8 3.8 3.6 2.0 3.1 3.3 2.3 1.9 3.4 2.3 2.6
RO 4.1 3.9 2.7 2.2 2.1 2.5 2.5 2.4 2.9 2.5 2.7 2.8 2.2 2.1
SE 2.0 1.7 0.8 0.9 0.6 0.6 0.8 1.3 0.8 1.4 1.5 0.6 1.1 1.2
EU 1.8 1.4 1.2 0.8 0.3 0.7 1.3 1.5
8 PE 645.716You can also read