Evaluation of Attend Anywhere video consultation platform. Service Users Feedback
←
→
Page content transcription
If your browser does not render page correctly, please read the page content below
Evaluation of Attend Anywhere video consultation platform.
                     Service Users Feedback

Executive Summary
Key findings

    •   Preliminary demographic data suggests that the uptake in video consultation was proportionally lower in the
        older adult population, BAME service users and people in a psychosis cluster. There appeared to be some
        correlation with measures of social deprivation.
    •   Attend Anywhere (AA) was positively received by patients, with 97% of survey participants reported that
        they would either or ‘definitely’ or ‘probably’ use the system again, were they to be offered the option,
        despite issues with video and audio quality reported in the survey.
    •   Patients reported significant savings in both time and money when given the option of attending
        appointments using Attend Anywhere. Patient estimates suggested that on average they saved £5 in travel
        costs and 40 min in time by not having to travel to their appointment. Carers who would have normally
        travelled to the appointment with the patient saved on average 33 minutes of time. 40% of people asked
        would have normally travelled to their appointment by car, suggesting a positive environmental impact with
        the use of video technology.
    •   Analysis of the free text comments using ‘Sentiment Analysis’ suggests an overall positive analysis, with a
        confidence rating of 95%. The themes raised within the free text comments were in keeping with a separate
        evaluation carried out as part of the SWLSTG Attend Anywhere qualitative evaluation.

Suggested next steps:

    •   This was a survey of a self-selected sample of people who have access to the internet and a suitable device
        to engage with video consultations. The primary aim of the survey was to establish whether Attend
        Anywhere was a suitable platform for service users as an alternative to face to face appointments. However,
        the survey did not capture the experience of people offered group treatments, and this should be explored
        further.
    •   Demographic data suggests that factors such as age, gender, ethnicity and diagnosis may further influence
        uptake of video consultation. It is reported that in 2020, 98% of people aged 16-64 have access to the
        internet on their mobile phone, compared to 53% in people aged over 65. Demographic data collected
        suggests that there may be a correlation between measures of social deprivation and engagement in video
        consultations. Further work needs to be completed to understand the reasons behind digital exclusion.
    •   This was a survey carried out during the COVID-19 pandemic. The feedback needs to be seen in the context
        of this, and further evaluation may be required once the pandemic has passed.
    •   The funding of Attend Anywhere will stop in March 2021. The Trust will need to develop a business case to
        continue to support video consultations beyond this point; however this survey demonstrates that the
        patients surveyed value having access to a video consultation platform and we need to continue to offer
        patients the choice to see their clinicians using video consultation technology.

                                                                                                        1|P a ge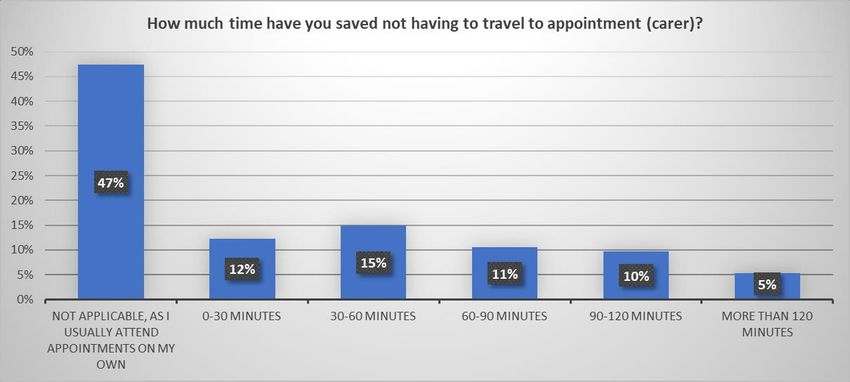
Introduction
The incorporation of video consultation into routine clinical practice was a key element of South West London and St
George's Mental Health Trust (SWLSTG) digital strategy before the COVID-19 2020 pandemic. The adoption of video
consultation was included in the Trust Global Digital Exemplar plan and talks had already taken place with NHS
England to take advantage of the Attend Anywhere video consultation pilot.

The Attend Anywhere video consultations solution was founded in Melbourne, Australia in 1998. Following its
adoption and roll out by NHS Scotland, NHS England offered Trusts the opportunity to enrol as UK Pilot Sites. Attend
Anywhere is a purpose-built suite of service, tools and resources. It is accessed via the web and can be used
anywhere, on everyday devices with good internet connection (see appendix 1 for further information). The
advantage that Attend Anywhere offers over some other video consultations solutions is that it offers a reception
area function, allowing real world adoption, enabling clinicians to incorporate video consultations alongside
traditional face-to-face appointments.

The progression of the COVID-19 pandemic led to a rapid roll-out of the Attend Anywhere platform across South
West London and St George's Mental Health Trust (SWLSTG). A project group was established to support the rapid
roll-out, meeting weekly from February 2020.

As the COVID-19 pandemic progressed, the Trust saw a rapid uptake of video consultation across all service lines.
The graph below shows the change in consultation types across the Trust from 1st week in January 2020 (week 1) to
the 1st week of October (week 40). Before the pandemic, approximately 70% of all contacts in the community were
face to face, 20% were telephone and approximately 3% were via video consultation (E-Consultation). The third
week of March (week 11) saw a dramatic decline in face to face appointments and a significant rise in telephone
consultations, corresponding to the announcement made by Matt Hancock, Secretary of State for Health and Social
Care, on the 16 March 2020 to the House of Commons, instructing that all unnecessary social contact should cease.
The peak of video consultation across the Trust occurred on week 27 (the 3rd week of July 2020), reaching 25%.
With the lessening of lock-down restrictions, the Trust currently see 1 in 5 of community patients using video
consultation platforms. The number of successful contacts peaked at week 17 (3rd Week of April 2020) as community
teams contacted vulnerable service users.

                                                                                           Trust Wide Staff Activity

                                                                                                         2|P a ge
Graphs of the uptake of video consultations within service lines can be viewed in Appendix 2. The highest rates of
video consultation were seen in the Forensic, Specialist and National Service Line, who reached 60% of all contacts
using this medium.

In order to maintain contact with patients during the COVID-19 period and lock-down restrictions, advice was issued
to staff in line with the guidance issued by NHS digital. Staff were told that to reduce the spread of COVID-19,
pending the Trust wide roll-out of Attend Anywhere, all video consultation tools could be considered, including
Skype, What's App and Face Time. Staff were however encouraged to use Skype, pending the roll-out of Attend
Anywhere for individual consultation, as the Trust had already developed clinical guidance for this use.

Based on current estimates, between 50 – 60% of all video consultations within the Trust take place using Attend
Anywhere. The majority of these are one-to-one consultations. Teams who primarily run groups have not found the
Attend Anywhere platform suitable for this purpose. With the new features on Microsoft teams (including breakout
room functionality), teams will be expected to transfer across to MS teams for group work.

All clinical staff from all disciplines were given the opportunity to sign up to the Attend Anywhere platform as part of
the roll-out strategy. Borough based clinic areas were established, in addition to clinic areas for hospital-based
services and CAMHS teams.

The COVID-19 crisis forced a rapid transition to a new way of working. For staff, this meant working from home and
contacting patients by phone or video consultation. New guidance was issued and training was provided via an MS
Teams webinar to support staff with this change. A survey of consultants was completed by the Qi Team seeking
their views on the new way of working (Appendix 3).

Evaluation
As part of the Attend Anywhere roll-out, a web link to a survey was embedded into the Attend Anywhere platform.
Once a patient had finished their consultation with their clinician, they were directed to a web link and asked to
provide initial feedback.

The main areas of focus of the evaluation were to ascertain the potential financial and environmental benefits to
patients in order to support the development of a formal business case for video consultation, and to gauge patients
overall experience using Attend Anywhere.

Conditional logic was used within the survey. First-time Attend Anywhere users who would have normally travelled
to their appointment to see their clinician were directed to questions 3-8 below. All other people were directed
straight to questions 9-16

An error was made in data collection for question 7, so this has been excluded from the analysis.

 Question         Question content
 number
 1             Was this your first-time using Attend Anywhere?
 2             Was this your first appointment with this particular clinician?

                                                                                                             3|P a ge
THE FOLLOWING QUESTIONS RELATE TO HOW YOU WOULD USUALLY ATTEND YOUR APPIONTMENT WITH THE
 CLINCIAN WHO YOU HAVE JUST SEEN USING ATTEND ANYWHERE:

 3             When you have met with this clinician in the past, how far do you have to travel to attend the
               appointment? (Please estimate)
 4             If you usually travel to attend your appointment with this clinician, what is your main form of
               transport?
 5             How much money do you save by not having to travel to your appointment?
 6             How much time do you save by not having to travel to your appointment?
 7             How much money does the person who usually attends the appointment with you save by not
               having to take you to your appointment?
 8             How much time does the person who usually attends the appointment with you save by not having
               to take you to your appointment?

 THE FOLLOWING QUESTIONS RELATE TO YOUR OVERALL EXPERIENCE OF USING ATTEND ANYWHERE

 9             How helpful were the staff in answering any questions you had about using Attend Anywhere?
 10            Thinking about the appointment itself, how would you rate your video consultation using Attend
               Anywhere?
 11            How would you rate your personal comfort in using the system?
 12            How would you rate the audio / sound quality during the consultation?
 13            How would you rate the visual / video quality during the consultation?
 14            Would you have preferred to see the clinician in person today?
 15            Would you use this system again?
 16            Do you have any other comments, questions or concerns relating to the use of Attend Anywhere?

The survey was live between the 17 June 2020 and the 24 August 2020.

An additional qualitative evaluation on video consultation took place within the Trust, led by Dr Sarah Cope, Principal
Clinical Psychologist. In order to understand both staff members’ and service users’ experiences of virtual
consultations during the COVID-19 pandemic, interviews were carried out in both adult and CAMHS teams to find
out how they found the transition from ‘in person’ to video interview. Transcripts of these interviews were analysed,
using thematic analysis, to draw out themes and subthemes. This is referenced in Appendix 5 below.

Demographic Data was collected as a separate process using PULSE data warehouse.

Results
Demographic Data

A total of 65,878 contacts were made during the period the survey was live.

                                                                                                           4|P a ge
Age
The majority of contacts (7818) occurred in the older adult, 75+ population, which was also the group least likely to
have a video consultation (2%).
Number of community contacts by age / type
9000
8000
7000
6000
5000
4000
3000
2000
1000
0
a. 0-17 b. 18-20 c. 21-25 d. 26-30 e. 31-35 f. 36-40 g. 41-45 h. 46-50 i. 51-55 j. 56-60 k. 61-65 l. 66-70 m. 71-75 n. 76+
Age
F2F Telephone eConsultation Other Total
Age Number of % Consultation Type by Age Range
Range contacts 120
a. 0-17 6804
100
b. 18-20 2627
c. 21-25 6404 80
d. 26-30 7212
60
e. 31-35 5505
f. 36-40 5408 40
g. 41-45 4029
20
h. 46-50 4287
i. 51-55 5081 0
3830 a. 0- b. 18- c. 21- d. 26- e. 31- f. 36- g. 41- h. 46- i. 51- j. 56- k. 61- l. 66- m. n. 76+
j. 56-60
17 20 25 30 35 40 45 50 55 60 65 70 71-75
k. 61-65 2679
l. 66-70 1732 %F2F %Telephone % eConsultation % Other
m. 71-75 2462
n. 76+ 7818
Gender
Most contacts were with females (41,322 Female: 24523 Male: 33 Other). 13% of all ‘female’ contacts were video
consultations, compared to 10% in ‘males’.
5|P a geConsultation Type and Gender
30000
25000
20000
15000
10000
5000
0
F2F Telephone eConsultation Other
Female Male Not Specified
Borough
The Local Authority 2019 Indices of Deprivation are designed to measure multiple forms of deprivation at
the small spatial level across England on a relative scale. It is common to describe how relatively deprived a
small area is by saying whether it falls among the most deprived 10 per cent, 20 per cent or 30 per cent of
all small areas in England (although there is no definitive cut-off at which an area is described as
‘deprived’).
While primarily designed to be a small-area measure of deprivation, they are commonly used to describe
deprivation for higher level geographies, including local authorities, by aggregating LSOA data. Authorities
with lower tier responsibilities (which include London boroughs) are ranked between 1 and 317 (1 being
the most and 317 the least deprived district in England).
South West London and St George's Mental Health Trust (SWLSTG) serve 5 Boroughs (Kingston, Richmond,
Sutton, Merton and Wandsworth). The Borough of Kingston completed the highest proportion of contacts
6|P a geduring the survey period using video consultation technology (17%); the Borough of Sutton recorded the
lowest proportion (7%).
% Contact Type Per Borough
80
70
60
50
40
30
20
10
0
percentage F2F Percentage telephone Percentage eConsultation Percentage Other
NHS KINGSTON CCG NHS MERTON CCG NHS RICHMOND CCG NHS SUTTON CCG NHS WANDSWORTH CCG
Local Authority Local Authority ‘Indices of Deprivation 2019’
Rank (1 – 317) 1= most deprived, 317 = least deprived
Wandsworth 173
Merton 214
Sutton 227
Kingston upon Thames 270
Richmond upon Thames 297
If we plot ‘LA Indices of deprivation’ against ‘% of borough contacts which took place using video
consultation’ during the survey period, there is a suggestion that the uptake of video consultation is
greater in areas of low social deprivation.
7|P a geEthnicity
The ethnicity breakdown of all community contacts is shown below.
Column1 F2F Telephone eConsultation Other Total
White - British 12828 24776 5328 2161 45093
White - Any other White background 934 3101 683 362 5080
Mixed - White and Asian 848 1253 1061 151 3313
Mixed - White and Black African 795 1461 434 96 2786
Black or Black British - Caribbean 42 907 5 98 1052
Black or Black British - African 53 817 27 77 974
Asian or Asian British - Any other Asian background 4 712 9 74 799
Asian or Asian British - Indian 42 569 11 79 701
Mixed - White and Black Caribbean 0 549 0 63 612
Mixed - Any other mixed background 14 516 13 60 603
Asian or Asian British - Pakistani 0 509 0 47 556
Other Ethnic Groups - Any other ethnic group 0 467 0 63 530
Not Stated 0 471 0 42 513
Other Ethnic Groups - Chinese 79 216 17 22 334
Unknown 0 222 0 40 262
Black or Black British - Any other Black background 0 230 1 24 255
Asian or Asian British - Bangladeshi 10 142 0 2 154
8|P a geMost of the contacts took place with people who were White British (45,093 in total). If we look at percentage of
contacts which took place using video consultation technology during the survey period, we can see that the
majority of these occurred in the Mixed - White or White ethnic groups and that the proportion of video
consultation was low in BAME groups, also noting the relatively low contact numbers within these ethnic groups
which makes drawing firm conclusions difficult. The data also suggests relatively a low proportion of F2F contacts in
BAME groups.
Ethnicity and % Contact Type
Unknown
Other Ethnic Groups - Any other ethnic group
Mixed - White and Black Caribbean
Missing
Asian or Asian British - Pakistani
Not Stated
Asian or Asian British - Bangladeshi
Black or Black British - Any other Black background
Black or Black British - Caribbean
Asian or Asian British - Any other Asian background
Asian or Asian British - Indian
Mixed - Any other mixed background
Black or Black British - African
Other Ethnic Groups - Chinese
White - Irish
White - British
White - Any other White background
Mixed - White and Black African
Mixed - White and Asian
0 20 40 60 80 100 120
Percentage F2F Percentage telephone Percentage video consultation Percentage other
Mental Health Cluster
A mental health cluster is a global description of a group of people with similar characteristics as identified from a
holistic assessment and then rated using the Mental Health Clustering Tool (MHCT).
Cluster Activity during the survey period is as follows:
Cluster Cluster Descriptor F2F Telephone eConsultation Other Total
1 Common mental health problems (low severity) 25 389 11 90 515
2 Common mental health problems (low severity with 9 1282 10 8 1309
greater need)
9|P a ge3 Non-psychotic (moderate severity) 38 2698 27 63 2826
4 Non-psychotic (severe) 154 1168 51 33 1406
5 Non-psychotic disorders (very severe) 1268 1119 237 65 2689
6 Non-psychotic disorder of over-valued ideas 191 291 393 44 919
7 Enduring non-psychotic disorders (high disability) 866 1847 746 103 3562
8 Non-psychotic chaotic and challenging disorders 1505 1990 1144 222 4861
10 First episode psychosis (with/without manic features) 345 478 535 75 1433
11 Ongoing recurrent psychosis (low symptoms) 279 346 61 20 706
12 Ongoing or recurrent psychosis (high disability) 1425 1350 219 53 3047
13 Ongoing or recurrent psychosis (high symptom and 1505 1440 221 113 3279
disability)
14 Psychotic crisis 1098 498 91 30 1717
15 Severe psychotic depression 63 20 6 1 90
16 Psychosis and affective disorder (high substance 121 117 12 11 261
misuse and engagement)
17 Psychosis and affective disorder – difficult to engage 142 174 13 11 340
18 Cognitive impairment (low need) 467 946 46 25 1484
19 Cognitive impairment or dementia complicated 602 1300 42 64 2008
(moderate need)
20 Cognitive impairment or dementia complicated (high 285 797 29 32 1143
need)
21 Cognitive impairment or dementia (high physical or 84 174 12 0 270
engagement)
Most contacts took place with people placed in Cluster 8 (Non-Psychotic Chaotic and Challenging Disorders)
If we look at the percentage contact type by cluster, the highest proportion of video consultations took place with
people in cluster 6 (non-psychotic disorder of overvalued ideas) and cluster 10 (1st episode psychosis).People in the
psychosis and organic clusters had a greater proportion of contacts either face to face or by telephone.
10 | P a g eSurvey evaluation results
The Attend Anywhere evaluation survey was completed by 929 patients. 445 service users who responded were
using Attend Anywhere for the first time. 114 patients were directed to the financial and environmental impact
questions. All patients were directed towards the quality of the consultation question bank and had the opportunity
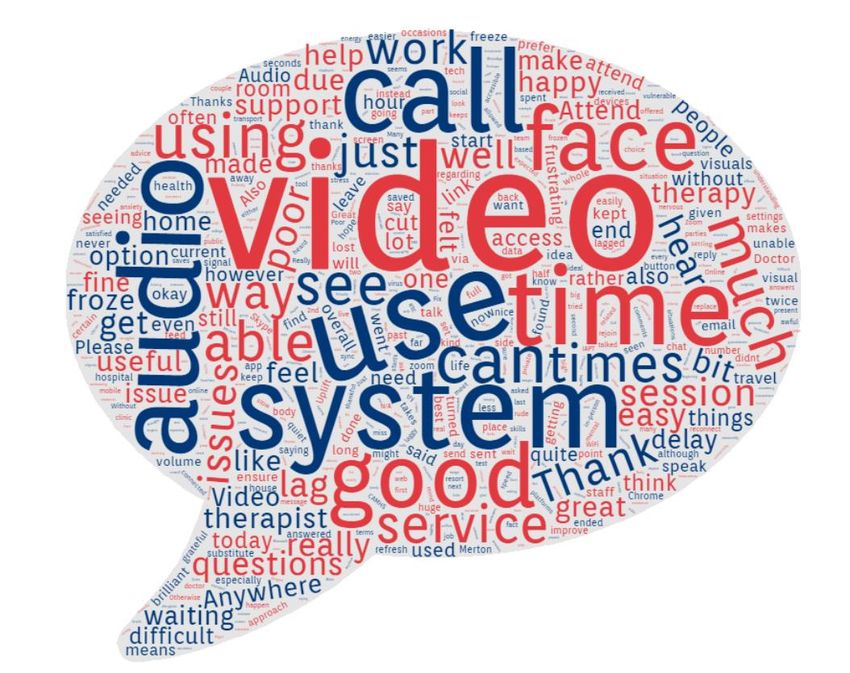
to leave free text comments. 258 (28% of survey respondents) service users provided free text comments.
Overall rating of video consultation
94% of service users rated their overall experience of using Attend Anywhere as either good or very good.
11 | P a g eRating Number of
responses Thinking about the appointment itself, how would you
Good 317 rate your video consultation using Attend Anywhere?
Poor 37 600
Very Good 557
500
Very Poor 18
Grand 929 400
Total
300
557
200
317
100
37 18
0
VERY GOOD GOOD POOR VERY POOR
Some of the comments made by people who rated the overall experience as good or very good included the
following:
• I prefer video consultation as it saves a lot of time. thank you
• Much better than using Zoom web confidence.
• Brilliant system happy to use in future. Thank you
• Thank you for your time and help!
• Great. I think most appointments should be done like this. Impressed
• I see the use of Attend Anywhere as necessary during the current situation.
• Efficient and easy to use saves lots of time and safer
• It was very nice
• There were no technical difficulties during the appointment, although I just find face to face appointments much
easier terms of my anxiety.
• This is a very good way to keep appointments when physical examinations ie blood pressures, height & weight
are not required. Also no need to cancel appointments if you are unwell and can't leave the house.
• The occasional face to face would be useful.
• Although this system of consultation works well, it is no substitute for face to face discussion with the consultant.
Without my assistance my wife would be unable to contact and talk to my doctor via this computer link, she is
not computer literate or competent and lacks the understanding needed.
• Mark was amazing and very helpful
• This is a very good way to keep appointments when physical examinations ie blood pressures, hight & weight are
not required. Also no need to cancel appointments if you are unwell and can't leave the house.
• Would be difficult to use on my own, but with support worked well.
• even though using the system was efficient, when talking about your child's sensitive information and challenges
its much nicer to be in person with the assessor
• Video next time
• With the number of people desperate to see a clinical for mental health issues, if this service can be used to
ensure higher levels of people accessing the treatment they need, it should continue to be an option even once
the pandemic is over. Making it possible to speak to a clinical remotely also helps the accessibility of a service
massively.
12 | P a g e• Would prefer to use this system rather than face to face. It is more convenient for me as i work full time and
means i do not have to leave work early.
• Very good, helpful & calming being at home. No stress getting to hospital & getting home again.
• I am really thankful that I have been allowed and able to use this service for keep receiving medical treatment. To
help with environmental issues I think this system could be used more often.
• A record feature would be really useful.
• Online consultations are brilliant for us, ADHDers. If we forget about them (which we very likely will), were a
phone call away and will be able to take the appointment, instead of missing an in-person appointment because
were 10 miles away. Its a brilliant system, please keep using it.
• It would be nice to share documents as I was asked to supply my dyslexia report and it would have saved time, if I
could have done this immediately like Zoom.
• Flawless system - well done
• Thank you for all the support and kind help that is given through this easy to access and use system.
Comments made by people who rated the overall experience as either poor or very poor included the following:
• One member of my team could not use the software, so we had to use the phone as well.
• Its is a great tool, but the video and audio quality were poor. The audio lagged and jumped around and the visual
froze a few times
• Video call was very bad quality, clinician called me on the phone instead.
• I didn’t actually have my appointment with the doctor; I was on hold for 1 hour from 10am to 11am. Please can
another appointment be sent to me?
96% of people using Attend Anywhere reported that staff were either very helpful or extremely helpful in answering
questions they had about using Attend Anywhere.
Rating Number of
responses
Extremely 511
helpful
Extremely 12
unhelpful
Not very 28
helpful
Very helpful 378
Grand Total 929
The following comments were received from people who rated the staff as unhelpful.
• Nobody answered my call!
13 | P a g e• I have spent two sessions waiting 30mins and 15mins waiting to be dialed into the call and have not been. It is
very frustrating as this is a huge waste of time.
• No one turned up, sat here for an hour. Sent an email to the person that set up the appointment but no reply -
difficult to know if anyone knew I was waiting. Not great
• Doctor did not attend
• The Dr hasn't turned up on the call. No indication of how long I should wait. It's uncomfortable sitting here
waiting with my phone looking at me. So I'm leaving to try and get on with my day.
• The sound alters from being very quiet to very loud all through a 90 minute video call! This makes it extremely
difficult to hear professionals speak.
• This appointment was awful. The doctor was not helpful at all. In fact her persona and tone is nothing but
unhelpful for someone who is already depressed. She was abrasive, rude…. This person should not be working in
mental health. On the phone call, i could not name any triggers, now i can.. .
94% of service uses reported that their personal comfort in using the system was either comfortable or very
comfortable.
Rating Number of
How would you rate your personal comfort in using
responses
Comfortable 353 the system?
Uncomfortable 43 600
Very 519 500
comfortable
Very 14 400
uncomfortable 300
Grand Total 929 519
200
353
100
43 14
0
VERY COMFORTABLE COMFORTABLE UNCOMFORTABLE VERY
UNCOMFORTABLE
Of the people who found the experience either ‘uncomfortable’ or ‘very uncomfortable’, eight people (14%)
reported that they would ‘definitely not’ use the system again; ten people (18%) reported that they would ‘probably
not’ use the system again. The remainder (68%) reported that they would ‘probably’ or ‘definitely’ use the system
again, suggesting that most people would persevere with using video consultation technology even if they found
their first experience uncomfortable.
14 | P a g e76% of people responding to the survey reported that the audio quality was either high or very high. 75% of people
responding also reported that the video quality was either high or very high.
Rating Number of
responses
How would you rate the audio / sound quality during
Very high 205 the consultation?
quality 600
High quality 499
500
Low quality 191
Very low quality 34 400
Grand Total 929
300
499
200
100 205 191
34
0
VERY HIGH QUALITY HIGH QUALITY LOW QUALITY VERY LOW QUALITY
Rating Number of
responses
How would you rate the visual / video quality during
Very high 203 the consultation?
quality 600
High quality 489
500
Low quality 208
Very low quality 29 400
Grand Total 929
300
489
200
100 203 208
29
0
VERY HIGH QUALITY HIGH QUALITY LOW QUALITY VERY LOW QUALITY
97% of survey participants said that they would either or ‘definitely’ or ‘probably’ use the system again, were they to
be offered the option.
15 | P a g eRating Number of
responses Would you use this system again?
Definitely 636
700
Probably 266
Probably not 19 600
Definitely not 8 500
Grand Total 929
400
300 636
200
266
100
19 8
0
DEFINITELY PROBABLY PROBABLY NOT DEFINITELY NOT
48% of survey responders were first time users and 52% of responders had used Attend Anywhere previously. There
were no observable differences between the experience of people using Attend Anywhere for the first time and
repeat users, suggesting that the information provided to patients before their appointment was adequate and that
the system was easy to use for first time users.
Rating of first- Number of
time users responses Rating of AA experience for first time users
Very good 251 and repeated users
Good 165 70.00%
Poor 16 60.00%
Very poor 13
50.00%
Total 445
40.00% Very Good
30.00% Good
Rating of repeat Number of
users responses 20.00% Poor
Very good 306 10.00% Very Poor
Good 152 0.00%
Poor 21 No Yes
Very poor 5 Was this your first time using AA?
Total 484
We asked service users who would have normally travelled to a clinic setting to see their doctor / therapist / nurse a
series of further questions, in addition to the questions noted above. 114 people completed this part of the survey.
The average distance travelled to the appointment was estimated by respondents to be approximately 4 miles.
16 | P a g eDistance Number of
How far do you usually travel for your appointments?
travelled to responses
appointment 45
0-2 miles 34 40
2-4 miles 25 35
5 miles and 15
30
above
I am usually 1 25
seen at home 20 39
for a face to 15
34
face 25
assessment, so I 10
15
don t have to 5
1
travel at all 0
I usually have 39 0 - 2 MILES 2 - 4 MILES 5 MILES AND I AM USUALLY I USUALLY HAVE
video ABOVE SEEN AT HOME VIDEO
consultations / FOR A FACE TO CONSULTATIONS
FACE / TELEPHONE
telephone ASSESSMENT, CONSULTATIONS
consultations so SO I DON T HAVESO I DON T HAVE
I don t have to TO TRAVEL AT TO TRAVEL AT
travel at all ALL ALL
Total 114
The majority of people would have normally driven to their appointment. The minority of people would have either
walked or used public transport to attend their appointment.
Mode of Number of
transport responses
Car / 46
Motorcycle /
Moped
Public Transport 30
Taxi 4
Walk 5
Not Applicable 29
Total 85
17 | P a g eWe asked patients to estimate the usual cost of attending appointments. On average, each patient saved
approximately £5 in travel costs using Attend Anywhere.
Cost of Number of
attending responses
Usual cost of attending appointment (Patient)
appointment 70%
less than £5.00 69 60%
£5.00 - £10.00 38
50%
£10.00 - £15.00 3
£15.00 - £20.00 3 40%
More than 1 30% 61%
£20.00
Total 114 20%
33%
10%
3% 3% 1%
0%
LESS THAN £5.00 - £10.00 £10.00 - £15.00 £15.00 - £20.00 MORE THAN
£5.00 £20.00
The average time saved by patients not having to travel to their appointment was 40 minutes,
Time saved Number of
responses
How much time have you saved not having to travel to
45 appointments (patient)?
0-30 minutes
30-60 minutes 40 45%
20 40%
60-90 minutes
35%
90-120 minutes 5
30%
More than 120 4
25%
minutes
20% 39%
Total 114 35%
15%
10% 18%
5% 4% 4%
0%
0-30 MINUTES 30-60 MINUTES 60-90 MINUTES 90-120 MORE THAN
MINUTES 120 MINUTES
We were also interested in estimating the impact on carers in supporting people to attend their face to face
appointments. Approximately 50% of people surveyed reported that they would normally be accompanied when
attending their appointments. Unfortunately, the data related to the financial impact on carers was incomplete, so
conclusions could not be drawn. However, on average it was estimated that carers would save 33 min of travel time
by not having to accompany their friend / relative to the appointment.
18 | P a g eTime saved Number of
responses
0-30 minutes 14
30-60 minutes 17
60-90 minutes 12
90-120 minutes 11
More than 120 6
minutes
Not applicable, 54
as I usually
attend
appointments
on my own
Total 114
Free Text Feedback
Two hundred fifty-eight people provided free text feedback / comments during the survey. These have not been
formally analysed but are available to read in Appendix 4 below.
Sentiment Analysis (monkeylearn.com) using AI software of all the text suggests an overall positive analysis, with a
confidence rating of 95%.
There was a broad mix of both positive and negative comments. Many people reported that they found the
technology and experience positive and were thankful to have the opportunity to remain in contact with their
clinician using this video consultation platform.
Several people thought that the quality of the consultation was adversely affected using video technology as the
clinician would have been less aware of the body language of the patient, suggesting that a face to face contact is
preferable despite the convenience of video consultation.
Most negative comments were in relation to technical difficulties, or problems with streaming of the audio or video
feed, causing intermittent broken connections, leading to frustration. Also people made reference to the lack of
privacy, as they were unable to identify a private safe space to speak to the clinician away from other people.
19 | P a g eDr Stuart Adams
Chief Clinical Information Officer and Consultant Psychiatrist
South West London and St George's Mental Health Trust (SWLSTG)
November 2020
Thank you to the Attend Anywhere project team for their support
20 | P a g eAppendix 1
Attend Anywhere
Quick Start Guide v1.0.pdf
Appendix 2. Staff Activity Reports from January 1 2020 (week 1) to October 6, 2020 (week
40)
Figure 2. Community Service Line Staff Activity
Figure 3. CAMHS Service Line Staff Activity
21 | P a g eFigure 4. Forensic, National and Specialist Service Line Staff Activity
Figure 5. Acute and Urgent Care Service Line Staff Activity
Figure 6. Cognition, Mental Health in Aging Service Line Staff Activity
22 | P a g eAppendix 3. Consultants and SAS Survey on Remote Consultation
SWLStG COVID19 -
Consultant and SAS doctor survey - results for SWL project.docx
Appendix 4. Free Text Comments received during the survey (Names of clinicians removed)
AA%20Free%20Text
%20Comments.docx
Appendix 5. Qualitative evaluation of Attend Anywhere
Staff and service
users' experiences of virtual consultations during COVID 19_Trust_Final.pdf
23 | P a g eYou can also read