Evaluation of epigenetic age calculators between preeclampsia and normotensive pregnancies in an Australian cohort
←
→
Page content transcription
If your browser does not render page correctly, please read the page content below
www.nature.com/scientificreports
OPEN Evaluation of epigenetic age
calculators between preeclampsia
and normotensive pregnancies
in an Australian cohort
Paulina Pruszkowska‑Przybylska1*, Shaun Brennecke2,3, Eric K. Moses4,5 &
Phillip E. Melton4,6
Advanced biological aging, as assessed through DNA methylation markers, is associated with several
complex diseases. The associations between maternal DNA methylation age and preeclampsia
(PE) have not been fully assessed. The aim of this study was to examine if increased maternal DNA
methylation age (DNAmAge) was shown to be accelerated in women with PE when compared to
women who had normotensive pregnancies. The case/control cohort available for study consisted of
166 women (89 with normotensive pregnancy, 77 with PE) recruited previously at the Royal Women’s
Hospital in Melbourne, Australia. DNA methylation profiles were obtained using the Illumina EPIC
Infinium array for analysis of genomic DNA isolated from whole blood. These profiles were used to
calculate seven estimates of DNAmAge and included (1) Horvath, (2) Hannum, (3) Horvath Skin and
Blood, (4) Wu, (5) PhenoAge, (6) telomere length and (7) GrimAge and its surrogate measures. Three
measures of DNA methylation age acceleration were calculated for all seven measures using linear
regression. Pearson’s correlation was performed to investigate associations between chronological
age and DNAmAge. Differences between chronological age and DNAmAge and epigenetic age
acceleration were investigated using t-tests. No significant difference was observed for chronological
age between women with PE (age = 30.53 ± 5.68) and women who had normotensive pregnancies
(age = 31.76 ± 4.76). All seven DNAmAge measures were significantly correlated (p < 0.001) with
chronological age. After accounting for multiple testing and investigating differences in DNAmAge
between normotensive women and women with PE, only Wu DNAmAge was significant (p = 0.001).
When examining differences for epigenetic age acceleration between PE and normotensive women
Hannum, Wu, and PhenoAge DNAmAge estimates (p < 0.001) were significant for both epigenetic
age acceleration and intrinsic acceleration models. We found that accelerated maternal DNAmAge
is increased in women with PE in some models of epigenetic aging. This research underlines the
importance for further investigation into the potential changes of differential DNA methylation in PE.
Preeclampsia (PE) is a complex pregnancy specific disorder clinically characterized by new onset hypertension
and proteinuria affecting 3—5% of pregnant w omen1. Known risk factors for PE include first pregnancy, obesity,
multiple gestation, periodontal diseases, advanced maternal age, inadequate diet, and family h istory2,3. Family
and population studies have shown that PE has a large heritable c omponent4–8. While there has been some suc-
cess in the identification of maternal susceptibility genes for PE9–11 they do not explain all the heritability. This
indicates that other genomic factors, including epigenetic modifications, may be involved in predisposing some
women to risk of developing PE.
Studies on the epigenetic modification of DNA methylation across time and different tissues has led to the
development of ‘epigenetic clocks’ as potential biomarkers for several complex diseases and disorders12. These
1
Department of Anthropology, Faculty of Biology and Environmental Protection, University of Łódź,
90‑237 Łódź, Poland. 2Pregnancy Research Centre, Department of Maternal‐Fetal Medicine, Royal Women’s
Hospital, Melbourne, VIC, Australia. 3Department of Obstetrics and Gynaecology, The Royal Women’s Hospital,
The University of Melbourne, Melbourne, VIC, Australia. 4Menzies Institute for Medical Research, University
of Tasmania, Hobart, TAS, Australia. 5School of Global Population Health, University of Western Australia,
Perth, Australia. 6School of Biomedical Science, University of Western Australia, Perth, Australia. *email:
paulina.pruszkowska@biol.uni.lodz.pl
Scientific Reports | (2022) 12:1664 | https://doi.org/10.1038/s41598-022-05744-4 1
Vol.:(0123456789)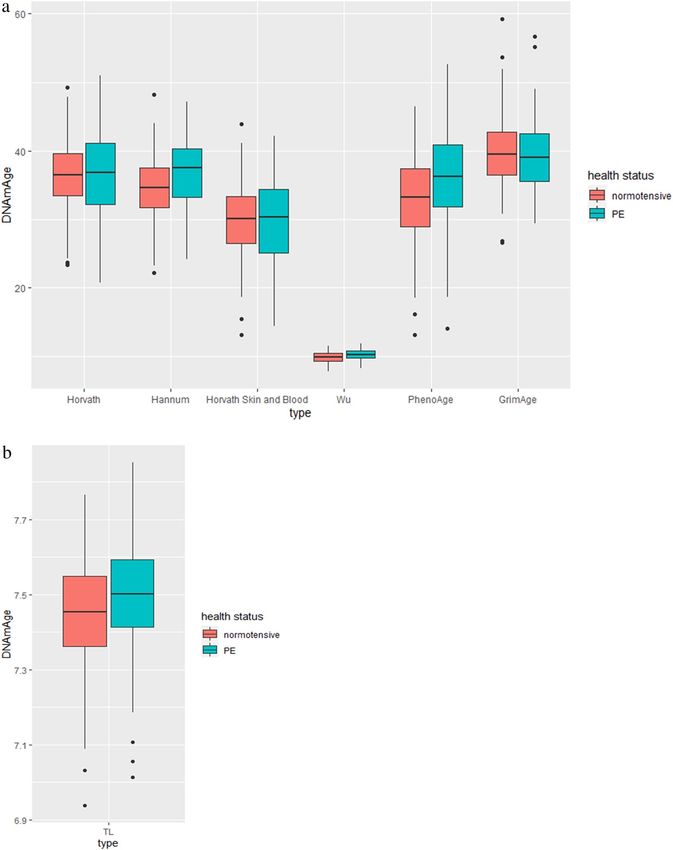
www.nature.com/scientificreports/
DNAm- age estimators Number of included CpGs Type of the cell/tissue Remarks
Chronological age predictors
Eighteen of the original 353 CpGs were not included in
Horvath16 335 CpGs Sorted cell types, tissues, and organs
our analyses as they are not available on the EPIC array
Immune blood types to age by weighting with cytotoxic T
Hannum17 71 CpGs It was measured using 65 of the original 71 CpGs
cells, exhausted cytotoxic T cells, and plasmablasts
Horvath Skin and Blood18 391 CpGs Skin and blood cells None
Wu19 111 cpG Blood cells More precise estimator in the case of younger individuals
Mortality predictors
PhenoAge20 513 CpGs Blood cell composition None
The composition of 8 DNA methylation-based biomarkers
for plasma proteins and self-reported smoking based on
packs per year. The plasma protein surrogates include:
GrimAge21 1030 CpGs Blood samples cystatin C, leptin, tissue inhibitor metalloproteinases 1
(TIMP1), adrenomedullin (ADM), beta-2-microglobulin
(B2M), growth differentiation factor 15 (GDF15), and
plasminogen activation inhibitor 1 (PAI-1)
Telomere length
TL22 140 CpGs Blood cells None
Table 1. Characteristics of the methyl clocks.
composite DNA methylation measures of age (DNAmAge) estimate an individual’s biological age over several
DNA methylation loci (CpGs) from blood or other biological tissues. Those individuals with an estimated
DNAmAge above their chronological age are then considered to be aging at an accelerated rate. The regres-
sion of DNAmAge on chronological age is defined as epigenetic age acceleration and has been shown to be an
accurate predictor of several complex disease including cancer13, cardiovascular disease14, and all-cause and
cause-specific mortality15.
Several DNAmAge measures have been developed that differ based on their composition of CpGs and out-
come (Table 1). These DNAmAge measures include H orvath16, Hannum17, Horvath Skin and B lood18, and W
u19
and are widely utilised due to their robust ability to correlate with chronological age or biological age discrepan-
cies in various tissues. However, as these DNAmAge measures were initially developed with chronological age as
their primary outcome, they do not detect those individual DNA methylation differences associated with biologi-
cal decline beyond that of advancing age. This has led to the more recent development of DNAmAge measures for
mortality prediction that incorporate composite outcomes of age-related clinical measurements that differentiate
between healthy and unhealthy aging. These include P henoAge20 and GrimAge21, which have been developed
using longitudinal data and well-defined mortality outcomes, thus providing the ability to provide potential use-
ful biomarkers of biological age. Finally, telomere length (TL), which is known to be associated with biological
aging and complex disease has also been shown to be estimated from a subset of CpGs. This estimated measure
of TL using DNA methylation markers has been shown to be more strongly correlated with chronological age
and complex disease than TL as traditionally measured from leukocytes22.
Previous research of DNAmAge and PE has demonstrated that differential DNA methylation may be an indi-
cator of the accelerated placental aging observed in early onset PE p regnancies23,24. While advanced maternal
age has been shown to be associated with increased risk for P E , differences in DNAmAge measures have not
25,26
been widely investigated in maternal DNA methylation profiles. A study by Heisenberg et al.27 did not identify
any significant differences between DNA methylation age and PE in a multi-ethnic cohort. However, their
investigation only included a single DNAmAge measure and did not investigate difference in any of the more
recent DNAmAge mortality predictors.
The purpose of this study was to evaluate different DNAmAge measures to determine if significant differences
could be identified between women who had been diagnosed with PE and those who had normotensive pregnan-
cies. We hypothesize that using composite epigenetic scores such as those employed in DNAmAge measures may
be a useful tool for understanding PE susceptibility. To address the relationship between chronological age and
DNAmAge we evaluated seven different DNAmAge measures to determine if an association could be identified
between normotensive and preeclamptic women in a pregnancy cohort of Australian w omen28.
Material and methods
Study population. The Australian case–control cohort of 166 unrelated women used in this study included
77 PE cases and 89 normotensive pregnancy controls randomly and retrospectively ascertained from a larger
Australian case–control cohort of 1,774 women that were recruited at the Royal Women’s Hospital (RWH),
Melbourne, Australia over a five period from 2007 to 2011. The Australian population seen at the RWH in Mel-
bourne is ∼70% Caucasian and for this current study the focus was on the inclusion of subjects of confirmed
European genetic ancestry (Fig. 1). Blood samples were collected at the end of pregnancy after the diagnosis of
PE or normality was made.
Preeclampsia diagnosis. PE diagnosis was determined by qualified clinicians using criteria set by the Aus-
tralasian Society for the Study of Hypertension in Pregnancy29,30 and the Society of Obstetric Medicine of Aus-
Scientific Reports | (2022) 12:1664 | https://doi.org/10.1038/s41598-022-05744-4 2
Vol:.(1234567890)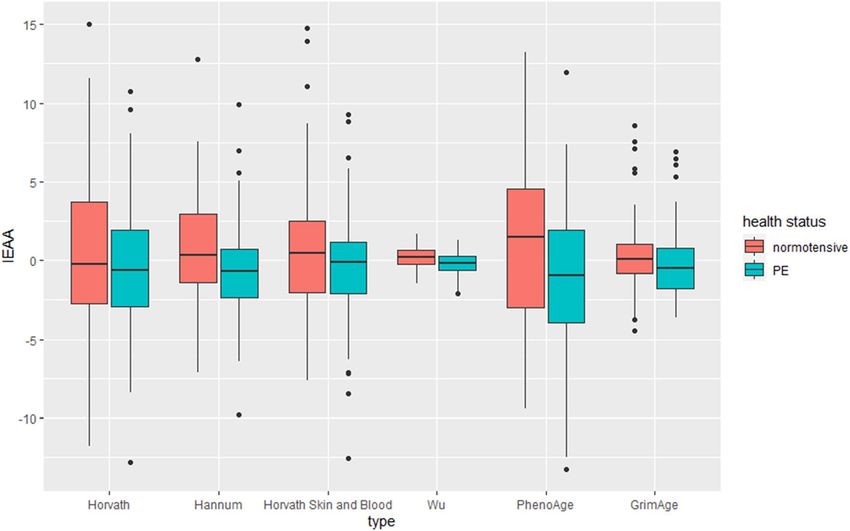
www.nature.com/scientificreports/
Figure 1. Schematic showing workflow for the study.
tralia and New Zealand for the management of hypertensive diseases of pregnancy31. Women were considered to
have PE if they were previously normotensive and if they, on at least two occasions six or more hours apart, had
after 20 weeks gestation (i) a rise in systolic blood pressure (SBP) of at least 25 mmHg and/or a rise from baseline
diastolic blood pressure (DBP) of at least 15 mmHg, or (ii) SBP ≥ 140 mmHg and/or DBP ≥ 90 mmHg. Addition-
ally, significant new onset proteinuric levels were either ≥ 0.3 g/l in a 24-h specimen, at least a ‘2 + ’ proteinuria
dipstick reading from a random urine collection or a spot protein∶creatine ratio ≥ 0.03 g/mmol. Women with PE
who also experienced convulsions or unconsciousness in their perinatal period were classified as having eclamp-
sia. Women with pre-existing hypertension or other medical conditions known to predispose for PE (e.g. renal
disease, diabetes, twin pregnancies or fetal chromosomal abnormalities) were excluded. Of the 1,774 unrelated
Australian women initially recruited for this study, 1,018 women were of confirmed Caucasian ancestry, meet-
ing our inclusion criteria. Of these, 471 were confirmed, by medical records, as having PE (cases) and 547 were
confirmed as having a normal pregnancy (controls). Of the 166 women participants for this study, 77 women
were confirmed, as having PE and 89 women were confirmed as having a normotensive pregnancy.
DNA extraction and epigenome‑wide DNA methylation profiling. This study utilized existing
genomic DNA (gDNA) samples that had been extracted from whole blood using Qiagen’s Blood and Cell Culture
DNA Midi Kit (Qiagen Pty Ltd, Doncaster, VIC, Australia). The 176 participant gDNA samples were bisulfite
converted and DNA methylation profiled using the Illumina EPIC Infinium (Illumina, San Diego, CA, United
States) array, by Pathwest Laboratory Medicine (Perth, Western Australia). The R package RnBeads32 was used
to perform quality control of the epigenome-wide DNA methylation profiles and to perform sex checks. After
removing SNP-enriched sites and probes with a high likelihood of cross-hybridization one gDNA sample and
CpGs with the highest fraction of unreliable measurement were removed. A total of 175 samples and 841,200
DNA methylation probes were then normalized using the Beta-Mixture Quantile dilation (BMIQ) model33.
Maternal age data was not available for 9 samples, leaving 166 samples for epigenetic age calculation (PE = 77,
normotensive = 89).
Cell‑type heterogeneity and DNAmAge calculation. To account for cell type heterogeneity, we used
the Houseman-based reference method34 and included the estimated proportion of neutrophils, monocytes,
basophils, natural killer cells, CD4 + T and CD8 + T cells for each participant sample. In addition, we calculated
the cell type heterogeneity values CD8pCD28nCD45Ran, CD8 Naïve, and PlasmaBlast used by Horvath to esti-
mate intrinsic epigenetic age acceleration (IEAA).
Six DNAmAge estimates (Horvath, Hannum, Horvath Skin and Blood, Wu, PhenoAge, and TL) were cal-
culated using BMIQ normalized DNA methylation β-values in the R package, methylclock35. In addition, we
calculated GrimAge as previously d escribed21. GrimAge is calculated as the composite of 8 DNA methylation-
based biomarkers for plasma proteins and self-reported smoking based on packs per year. The plasma protein
surrogates include cystatin C, leptin, tissue inhibitor metalloproteinases 1 (TIMP1), adrenomedullin (ADM),
beta-2-microglobulin (B2M), growth differentiation factor 15 (GDF15), and plasminogen activation inhibitor
1 (PAI-1). The selection and calculation of these surrogates from DNA methylation array data, along with their
function and disease association have been previously described18. Each of the surrogates is denoted by the pres-
ence of its surrogate with the prefix “DNAm”, i.e., DNAmGDF15 for the surrogate growth differentiation factor 15.
The number of CpGs markers utilised for each DNAmAge estimator utilised are shown in Fig. 1. As not all CpGs
are available across different Illumina epigenome DNA methylation arrays, missing CpG values were imputed.
Scientific Reports | (2022) 12:1664 | https://doi.org/10.1038/s41598-022-05744-4 3
Vol.:(0123456789)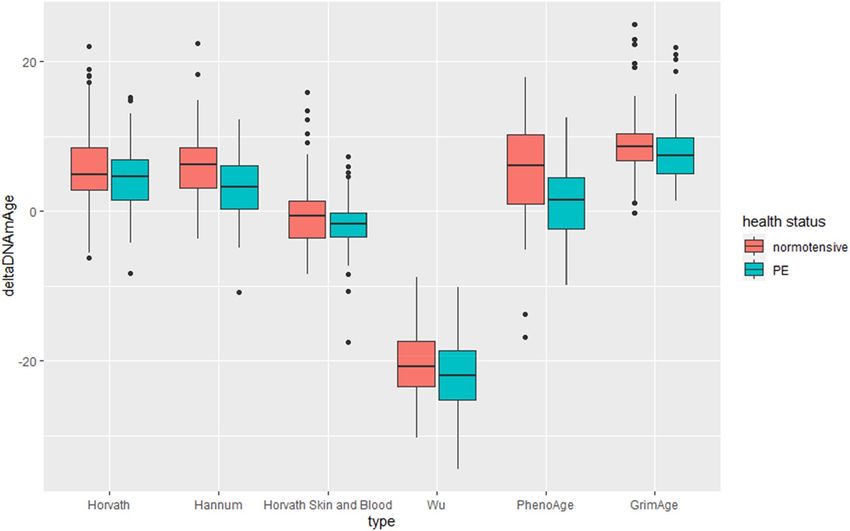
www.nature.com/scientificreports/
Normotensive (N = 89) Preeclamptic (N = 77)
DNAMAGE estimators Mean Std.Dev r p Mean Std.Dev r p t p Cohen’s D
chronological age 31.764 4.755 - – 30.533 5.679 – – − 1.521 0.130 0.050
Chronological age predictors
Horvath 36.110 5.544 0.648 < 0.001 36.273 6.775 0.597 < 0.001 0.170 0.865 2.630
Hannum 34.792 4.641 0.652 < 0.001 36.573 5.249 0.705 < 0.001 2.320 0.022 0.360
Horvath skin and blood 29.762 5.456 0.765 < 0.001 30.092 6.656 0.721 < 0.001 0.351 0.726 < 0.01
Wu 9.920 0.808 0.265 0.012 10.328 0.806 0.627 < 0.001 3.242 0.001 < 0.01
Mortality predictors
PhenoAge 33.111 6.374 0.609 < 0.001 35.866 7.715 0.529 < 0.001 2.519 0.013 1.450
GrimAge 39.510 5.371 0.660 < 0.001 39.594 5.231 0.632 < 0.001 − 0.101 0.919 6.720
Telomere length
TL 7.495 0.160 − 0.484 < 0.001 7.446 0.163 − 0.503 < 0.001 -1.951 0.053 < 0.01
Table 2. Pearson’s correlations and independent t-tests between average DNAm_age estimators among
investigated women.
For six (excluding TL) of these seven DNAmAge measures we calculated three biomarkers of epigenetic
age acceleration. These included: the difference between chronological age and DNAmAge (ΔDNAmAge), which
represents the difference between DNA methylation and chronological ages; epigenetic age acceleration (EAA),
which represents the residuals from using linear regression to regress chronological age on each epigenetic age
measure, and intrinsic epigenetic age acceleration (IEAA), which represents the residuals from a multivariable
linear regression where chronological age was regressed on each DNAmAge measure adjusted for estimated
cell type heterogeneity. The difference between EAA and IEAA are that IEAA captures cellular age acceleration
independently of blood cell proportions known to vary across the lifespan.
Statistical analysis. All statistical analyses were performed in R version 3.6.136. Standard descriptive sta-
tistics were computed, and data were examined graphically and statistically for missingness, outliers, and nor-
mality. Each of the 7 DNAmAge estimates was compared with chronological age using Pearson’s correlation and
examined visually using scatterplots. All group differences in age-adjusted age metrics were investigated using
an independent sample unpaired two tail T-test for equal variance between participants diagnosed with PE and
those with a normotensive pregnancy. To account for multiple testing, we used a Bonferroni correction (0.05/7)
of p < 0.007 as our threshold for statistical significance.
Ethics approval. This study was conducted according to the guidelines of the Declaration of Helsinki,
and all procedures involving research study participants were approved by the University of Western Australia
Human Research Ethics Committee, the Royal Women’s Hospital Research and Ethics Committees, Melbourne,
Australia, and the Institutional Review Board of the University of Texas Health Science Center at San Antonio,
San Antonio, Texas, USA. All study participants gave their written informed consent when enrolled in the study.
Results
The average chronological age of women with normotensive pregnancies was 31.76 ± 4.96 and for those with
PE was 30.53 ± 5.68 (Table 2). Seven DNAmAge measures were evaluated. For four of these (Horvath, Hannum,
PhenoAge, and GrimAge), DNAmAge estimates were higher than chronological age for both groups of women.
For two, DNAmAge measures (Horvath skin and blood and Wu), estimates were lower than chronological age
for both groups. For TL, where the average TL in the general population is 822, values were lower in both groups.
Pearson correlation of chronological and DNAmAge measures. Pearson correlations were calcu-
lated between seven DNAmAge measures (Horvath, Hannum age, PhenoAge, Horvath skin and blood, Wu,
GrimAge, and TL) and chronological age in women with normotensive pregnancies and PE. Six DNAmAge
measures were significantly (p < 0.007) positively correlated with chronological age (Table 2). The strongest cor-
relation was for Horvath skin and blood (r = 0.721; p < 0.001 for PE and r = 0.765; p < 0.001 for normotensive
women) and the weakest for PhenoAge (r = 0.529; p < 0.001 for PE and r = 0.609; p < 0.001 for normotensive
women). Only TL was significantly negatively correlated with chronological age (r = − 0.503; p < 0.001 for PE and
r = − 0.484; p < 0.001 for normotensive women).
Independent t‑tests between normotensive and PE. Independent unpaired two-tail t-tests with
unequal variance were used to test for differences between DNAmAge and chronological age for women with
normotensive pregnancies and those with PE (detailed in Table 2 and Fig. 2a, b). After accounting for multiple
testing, the only DNAmAge measure that was statistically significantly different (p < 0.001) between normoten-
sive women and those with severe PE was Wu. Both PhenoAge (p < 0.013) and Hannum (p < 0.02) were nomi-
nally associated with differences between PE and normotensive women.
Scientific Reports | (2022) 12:1664 | https://doi.org/10.1038/s41598-022-05744-4 4
Vol:.(1234567890)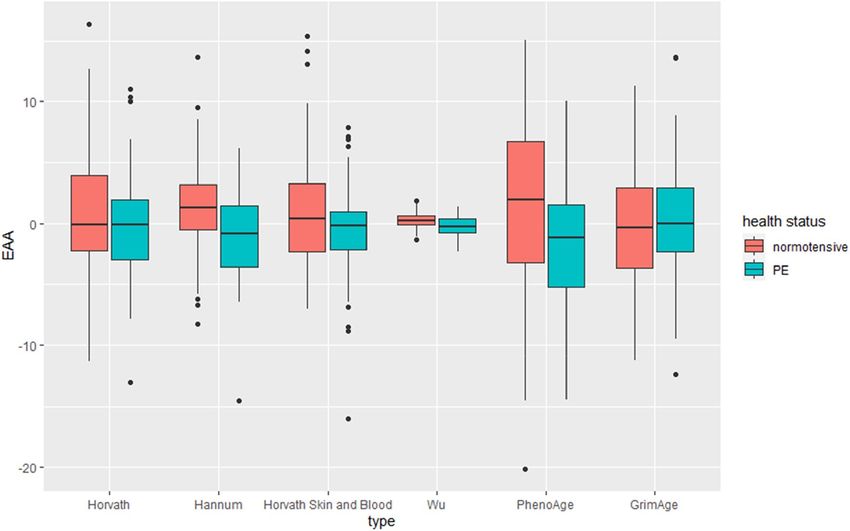
www.nature.com/scientificreports/
Figure 2. (a) Chronological age compared with six different DNAmAge models between women with
normotensive and preeclamptic (PE) pregnancies. (b). Measure of TL DNAmAge between women with
normotensive and preeclamptic (PE) pregnancies.
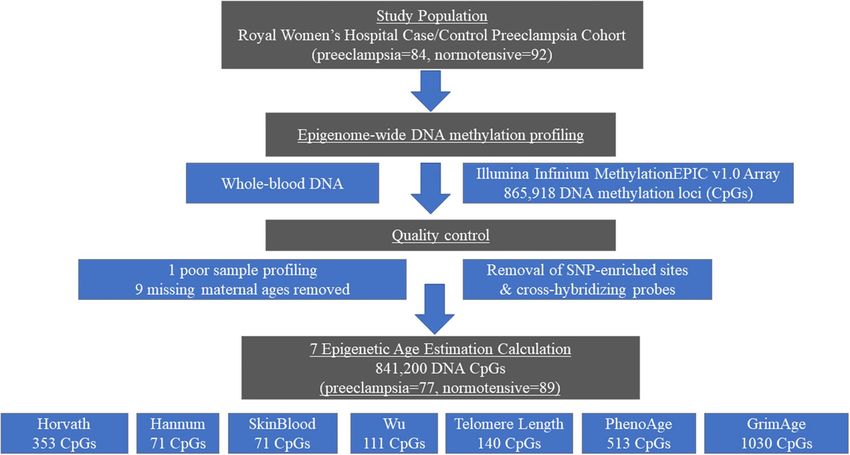
Comparisons of epigenetic age acceleration between normotensive and PE. Differences
between measures of epigenetic age acceleration among women with normotensive pregnancies and those with
PE are shown in Table 3 and Figs. 3, 4, 5. After accounting for multiple testing ΔDNAmAge was shown to be
significantly accelerated (p < 0.001) for women with PE than those women with normotensive pregnancies for
Hannum and PhenoAge. EAA was significantly (p < 0.001) accelerated in PE women compared to normotensive
women in the Hannum, Levine and Wu models. For IEAA the DNAmAges Hannum, Levine and Wu were sig-
nificantly accelerated (< 0.001) in women with PE when compared to those who had normotensive pregnancies.
Scientific Reports | (2022) 12:1664 | https://doi.org/10.1038/s41598-022-05744-4 5
Vol.:(0123456789)www.nature.com/scientificreports/
Normotensive Preeclamptic
(N = 89) (N = 77)
DNAm_age estimators Mean Std.Dev Mean Std.Dev t p Cohen’s D
ΔDNAmAge
Chronological age predictors
Horvath 4.346 4.377 5.740 5.678 1.784 0.076 0.280
Hannum 3.028 3.919 6.040 4.218 4.767 < 0.001 0.740
Horvath Skin and Blood − 2.003 3.560 − 0.441 4.696 2.433 0.016 < 0.01
Wu − 21.844 4.607 − 20.205 5.212 2.151 0.033 < 0.01
Mortality predictors
PhenoAge 1.347 5.132 5.334 6.739 4.319 < 0.001 0.010
GrimAge 8.978 4.751 7.830 4.143 1.663 0.098 0.40
Epigenetic age acceration (EAA)
Chronological age predictors
Horvath − 0.487 4.224 0.562 5.438 1.397 0.164 0.220
Hannum − 1.178 3.518 1.361 3.730 4.509 < 0.001 0.010
Horvath Skin and Blood − 0.635 3.516 0.735 4.613 2.167 0.032 < 0.01
Wu − 0.226 0.784 0.261 0.645 4.323 < 0.001 < 0.01
Mortality predictors
PhenoAge − 1.690 5.078 1.954 6.547 4.033 < 0.001 0.010
GrimAge − 0.362 4.996 0.313 4.542 − 0.911 0.364 0.070
Intrinsic epigenetic age acceration (IEAA)
Chronological age predictors
Horvath − 0.398 3.994 0.460 5.196 1.202 0.231 1.850
Hannum − 0.770 3.051 0.891 3.338 3.348 0.001 < 0.01
Horvath Skin and Blood − 0.485 3.300 0.560 4.517 1.717 0.088 < 0.01
Wu − 0.186 0.728 0.215 0.666 3.687 < 0.001 < 0.01
Mortality predictors
PhenoAge − 1.169 4.808 1.352 5.252 3.227 0.002 0.010
GrimAge 0.317 2.446 -0.274 2.132 1.663 0.098 0.140
Table 3. Independent t-tests between average accelerated mDNA age estimators among investigated women:
ΔDNAmAge – the difference between DNA methylation and chronological age, EAA- Epigenetic Age
Acceration IEAA—the intrinsic epigenetic age acceleration.
Comparisons of epigenetic age surrogate markers (cell count and GrimAge) between normo‑
tensive and PE. To further understand potential underlying differences in DNAmAge between women
diagnosed with PE and those with normotensive pregnancies we also conducted independent t-tests for average
estimated immune cell count measures and GrimAge DNAm-based plasma protein estimates. These results are
presented in Table 4. After accounting for multiple testing (p < 0.007), two of the six (eosinophils were estimated
at 0 for both groups, so not considered) estimated immune blood cell counts were significantly different between
groups. B cells were found to be significantly lower (p < 0.002) in women with PE than those with normotensive
pregnancies. Natural killer (NK) cell estimates were also found to be significantly lower (p < 0.001) in women
with PE when compared to women with normotensive pregnancies. Of the eight GrimAge DNAm-based plasma
protein estimates, two were significantly lower, DNAmadm (p < 0.005) and DNAmpai_1 (p < 0.001) in women
with PE when compared to women with normotensive pregnancies.
Discussion
This study sought to determine if maternal DNAmAge and associated epigenetic age acceleration measures were
significantly different in women with PE and those with who had normotensive pregnancies. Seven commonly
utilised methods for calculating DNAmAge were considered: Horvath, Hannum, PhenoAge, Horvath Skin and
Blood, Wu, GrimAge, and TL. We also estimated three epigenetic age acceleration measures: ΔDNAmAge, EAA,
and IEAA as well as surrogate DNAmAge measures of immune cell count and plasma protein function. We con-
firmed that each of the seven investigated DNAmAge measures were significantly correlated with chronological
age. Independent of covariates we observed a significant increase in DNAmAge in the Wu model19 between
women with a normotensive pregnancy and those with PE. In addition, we also detected increased ΔDNAmAge,
EAA, and IEAA for three DNAm measures (Wu, Hannum, and PhenoAge). Finally, we also found significant
differences between four surrogate DNAm measures (Bcell, NK, DNAmadm, and DNAmpai_1) between PE and
normotensive pregnancy. These findings suggest some estimates of DNAmAge are associated with differences
between PE and normotensive pregnancies and highlight the possible role of differential DNA methylation in
increased maternal susceptibility for PE complicated pregnancies.
Scientific Reports | (2022) 12:1664 | https://doi.org/10.1038/s41598-022-05744-4 6
Vol:.(1234567890)www.nature.com/scientificreports/
Figure 3. Six different ΔDNAmAge which represents the absolute difference between DNAmAge and
chronological age in women with normotensive and preeclamptic (PE) pregnancies.
Figure 4. Epigenetic age acceleration (EAA), which represents the residuals from a linear regression model of
chronological age with six different DNAmAge measurse.
Only three (Hannum, Wu, and PhenoAge) of the investigated measures of DNAmAge and EAA, demonstrated
a significant difference between women with normotensive pregnancies and PE. This may be indicative of dif-
ferent underlying DNA methylation components being associated with DNAmAge. Two (Hannum, Wu) of these
three measures identified as significant measure a subset of DNA methylation markers and were developed to
correlate with chronological age rather than with disease. Also, these measures do not account for cell-type in
their age estimations. The one previous study that investigated DNAmAge and P
E27, did not identify an association
Scientific Reports | (2022) 12:1664 | https://doi.org/10.1038/s41598-022-05744-4 7
Vol.:(0123456789)www.nature.com/scientificreports/
Figure 5. Intrinsic epigenetic age acceleration (IEAA), which represents the residuals from regressing
chronological age on each DNAmAge measure adjusted for estimated cell type.
Normotensive (N = 89) Preeclamptic (N = 77)
Mean Std.Dev Mean Std.Dev t p Cohen’s D
Cell count
Bcell 0.021 0.010 0.016 0.01 3.01 0.002 0.471
CD4T 0.0816 0.022 0.076 0.050 0.89 0.374 0.148
CD8T 0.028 0.022 0.0240 0.02 1.24 0.217 0.194
Eos – – – –
Mono 0.083 0.017 0.077 0.021 2.01 0.046 0.317
Neu 0.748 0.049 0.777 0.090 − 2.54 0.012 0.412
NK 0.041 0.022 0.027 0.022 3.789 0.00002 0.589
Plasma based estimators
DNAmGDF_15 614.906 154.225 621.059 93.668 − 0.315 0.753 0.050
DNAmB2M 1,357,350.202 99,289.073 1,337,098.909 90,476.932 1.375 0.171 < 0.01
DNAmCystatin_C 520,079.352 23,319.247 525,917.460 23,215.985 − 1.612 0.109 0.030
DNAmTIMP_1 30,839.098 896.438 30,810.191 820.949 0.217 0.829 < 0.01
DNAmadm 329.143 15.197 322.506 14.753 2.850 0.005 0.440
DNAmpai_1 16,398.178 1867.509 15,138.470 1963.188 4.217 < 0.001 0.690
DNAmleptin 13,168.183 1639.029 12,641.786 2107.368 1.776 0.078 0.030
DNAmPACKYRS 2.721 11.064 4.189 12.071 − 0.813 0.418 0.127
Table 4. Independent t-tests between average DNAm-based cell count and estimators of plasma proteins
among normotensive and preeclamptic women. Growth differentiation factor 15 (GDF15), cbeta-2-
microglobulin (B2M), cystatin C, ltissue inhibitor metalloproteinases 1 (TIMP1), adrenomedullin (ADM),
plasminogen activation inhibitor 1 (PAI-1).
between DNAmAge and PE among 56 pregnant women. However, the DNAmAge method they utilised incor-
porate cell counts into the model, potentially indicating that accounting for immune function in the statistical
estimate may confound differences between normotensive pregnancies and PE.
There is a current trend for DNAmAge estimates to move toward composite epigenetic DNA methylation
scores that are validated or enriched for disease morbidity and additional biological risk f actors37. PhenoAge
represents one of these measures and captures DNA methylation markers known to be optimized for mortality
risk among individuals with the same chronological age20 whereas GrimAge incorporates chronological age as
Scientific Reports | (2022) 12:1664 | https://doi.org/10.1038/s41598-022-05744-4 8
Vol:.(1234567890)www.nature.com/scientificreports/
an adjustment variable in the model along with the additional plasma protein and estimated smoking variables
to predict time to death. This may indicate why PhenoAge demonstrated the lowest correlation when compared
the other DNAmAge measures due to the diluted contribution of chronological age in the prediction model.
However, the PhenoAge estimates were considerably closer to the actual chronological age of the two groups of
women (33.1 years for normotensive and 35.86 years for PE) than GrimAge, which provided the highest esti-
mate for DNAmAge (39.51 years for normotensive 39.59 years for PE). This difference is further shown when
investigating all three measures of epigenetic age acceleration, where PhenoAge was significant, but GrimAge
was not. This may be representative of the different targeted CpGs in each of the models as there is often very
little overlap of DNA methylation markers between the two models.
Advanced maternal age is known to lead to variety of pregnancy complications38,39 and birth defects40. How-
ever, we did not observe a statistically significant difference between chronological age and PE. This result is in
contrast with two recent studies that have shown that women with advanced maternal age have increased risk
of PE25,26. Both these studies found women with high advanced maternal age, > 35 year for Lamminpää et al.
and > 45 years for Sheen et al., were at the highest risk for developing PE. In our case the average chronologi-
cal ages for women with normotensive pregnancies (age = 31.76) and PE (age = 30.53) were similar. Among all
DNAmAge estimates we measured the highest correlation with chronological age was observed with Horvath
Skin and Blood DNAmAge (r > 0.7). Of the six estimated DNAmAge measures, Wu DNAmAge estimated the
average age of normotensive pregnancies to be 9.92 years versus 10.33 years for women with PE, which is a severe
underestimate of their chronological age. However, the Wu DNAmAge estimate weakly predicted chronological
age (r = 0.265 among normotensive and r = 0.627 among PE pregnancies). Moreover, Wu et al.19 developed their
DNAmAge estimate for investigating the prevalence of age-related diseases among younger individuals and
several of the CpGs are associated with pregnancy or early life growth. This may have influenced the estimates
within our study as the DNA samples from this cohort were collected at the end of pregnancy.
Due to discrepancies among investigated DNAmAge estimators, we also hypothesised that the differences in
the results might be the effect of the number of included CpGs or the loci in which these CpGs are located that
may be involved in the pathogenesis of PE. There is possible compromise in the prediction in the Wu estima-
tor due to less CpGs in the model than in most of other estimators. The lower number of CpGs in the model
might be due to the predicted age among younger individuals using a more restrictive model. Additionally, Wu’s
model was validated for 67 pairs of monozygotic twins, whose genetic background and declared environmental
exposure were very similar19.
The role of epigenetic age acceleration is known to be related to the age-related functional decline of the
immune system and our results suggest this across three of DNAmAge models (Hannum, PhenoAge, and Wu).
Accelerated epigenetic aging in the placenta as measured by Horvath DNAmAge or placental specific DNAmAge
age has been associated with reduced birth weight and early-onset P E24,41. The placenta also can experience
telomere length shortening that may induce cellular senescence that promotes parturition through increased
inflammation37,42,43. In women with advanced maternal biological age these processes may be accelerated lead-
ing to pregnancy complications and poor birth outcomes. As we did not investigate placental tissue, additional
research is required to determine the association between DNAmAge and different tissue types during pregnancy.
Although not significant, our DNA methylation measures/analyses suggest that TL was lower among women
with PE when compared to normotensive women.
Associations between the estimated cell counts B cells and NK cells as well as the GrimAge surrogates
DNAmadm and DNAmpai_1 were consistent with previous literature in relation to pregnancy and PE. Auto-
antibodies are produced during PE and have been previously shown to be higher in women with PE than in
those who had normotensive p regnancies44. Natural killer cells play an important role in human pregnancy and
regulation of these cells contribute to reproductive success and it has been previously shown that women with
PE have a decreased percentage of NK cells when compared to those with a normotensive p regnancy45. Both
DNAmadm and DNAmpai_1 were validated from biomarkers involved in hemodynamics . Biological variation
46
in hemodynamics risk are important during pregnancy to ensure proper circulation to the placenta and meet the
increased metabolic demands of the developing foetus. Plasminogen activator inhibitor type 1 (PAI-1) represents
a major down-regulator of fibrinolytic activity that results in the reduction of blood flow to the placenta which
initiates the release of factors that activate maternal vascular endothelium resulting in PE47. This is supported
across several studies that have demonstrated higher plasma levels of PAI-1 in women with PE compared with
normotensive women48–51. Adrenomedullin (ADM) is a pro-angiogenic peptide hormone that regulates blood
pressure and vascular integrity, is highly expressed in both the placenta and maternal vascular endothelial cells
and has been shown to be associated with PE52. This demonstrates that the use of DNA methylation estimate
as a potential biomarker for PE can be done successfully and be representative of the immune function and
hemodynamic process in pregnancy. However, this should be interpreted with caution as these are estimates
drawn from whole peripheral blood samples and these DNA methylation measures were not correlated with
measured blood derived markers.
There is evidence that global DNA methylation may influence PE risk during the placentation p rocess53 and is
54
related to maternal blood p ressure . DNA methylation data applied in epigenetic age calculations are also linked
with the gestational age of the placenta which is positively correlated with pregnancy complications such as P E24.
This current study is limited by its observational nature, whereby direct causation cannot be ascribed, but
only inferred. The study was also not adjusted for additional confounders such as socioeconomic status, dietary
habits, medication, or stress level during pregnancy, preventing any investigation how these variables may impact
the association between DNAmAge and PE. A further limitation is that DNA methylation was measured from
whole-blood samples. This introduces complexity in interpretation of the contribution of cellular heterogeneity,
which we controlled for through well-established methods for estimation. We have not incorporated epigenetic
estimates for mononuclear leukocytes, which include macrophages and dendritic cells, that migrated out of the
Scientific Reports | (2022) 12:1664 | https://doi.org/10.1038/s41598-022-05744-4 9
Vol.:(0123456789)www.nature.com/scientificreports/
blood stream into tissues. The estimation of these mononuclear leukocytes from CpGs may be possible from
specific tissue types, such as the placenta, but not from whole blood as used in this research. An additional
limitation of the study is that biological samples for the participants were collected at the end of their respective
pregnancies and did not incorporate information about time of PE onset (early or late onset PE). However, we
hope that our current manuscript prompts other researchers in the fields of obstetrics and epigenetic ageing to
further investigate this topic.
Finally, the wider relevance of these observed DNAmAge estimates require replication in other pregnancy
cohorts.
Conclusions
This study represents the first study to systematically evaluate the association between maternal DNAmAge and
PE across both chronological age and mortality predictors of epigenetic age. We find that accelerated maternal
DNAmAge is associated with PE in three different models of DNAmAge (Hannum, PhenoAge, and Wu). These
findings underline the importance of the potential DNA methylation modifications that differentiate PE and
normotensive pregnancies. The application of composite genomic risk scores, such as genetic risk scores or
DNAmAge have been recently developed in the research setting for their potential use in the clinical setting
for primary and secondary p revention55,56. To date, their potential application has been proposed for several
complex diseases including cardiovascular disease and cancer, but the role of epigenetic aging during pregnancy
is less clear.
Further investigation would be beneficial to better understand how epigenetic age acceleration interacts
with environmental factors and fixed effects in PE to determine how modifiable these DNAmAge estimates are
during pregnancy.
Received: 11 September 2021; Accepted: 11 January 2022
References
1. GBD 2015. Maternal mortality collaborators, global, regional, and national levels of maternal mortality, 1990–2015: a systematic
analysis for the Global Burden of Disease Study 2015. Lancet 388, 1775–1812. https://doi.org/10.1016/S0140-6736(16)31470-2
(2016).
2. Boggess, K. A. et al. Maternal periodontal disease is associated with an increased risk for preeclampsia. Obstet. Gynecol. 101,
227–231. https://doi.org/10.1016/s0029-7844(02)02314-1 (2003).
3. Lain, K. Y. & Roberts, J. M. Contemporary concepts of the pathogenesis and management of preeclampsia. JAMA 287, 3183–3186.
https://doi.org/10.1001/jama.287.24.3183 (2002).
4. Cnattingius, S., Reilly, M., Pawitan, Y. & Lichtenstein, P. Maternal and fetal genetic factors account for most of familial aggregation
of preeclampsia: a population-based Swedish cohort study. Am. J. Med. Genet. A 130A, 365–371. https://doi.org/10.1002/ajmg.a.
30257 (2004).
5. Esplin, M. S. et al. Paternal and maternal components of the predisposition to preeclampsia. N. Engl. J. Med. 344, 867–872. https://
doi.org/10.1056/NEJM200103223441201 (2001).
6. Nilsson, E., Ros, H. S., Cnattingius, S. & Lichtenstein, P. The importance of genetic and environmental effects for pre-eclampsia
and gestational hypertension: a family study. BJOG 111, 200–206. https://doi.org/10.1111/j.1471-0528.2004.00042x.x (2004).
7. Roten, L. T. et al. The Norwegian preeclampsia family cohort study: a new resource for investigating genetic aspects and heritability
of preeclampsia and related phenotypes. BMC Pregnancy Childbirth 15, 319. https://doi.org/10.1186/s12884-015-0754-2 (2015).
8. Thomsen, L. C. et al. Refined phenotyping identifies links between preeclampsia and related diseases in a Norwegian preeclampsia
family cohort. J. Hypertens 33, 2294–2302. https://doi.org/10.1097/HJH.0000000000000696 (2015).
9. Ding, L. et al. PHLDA2 gene polymorphisms and risk of HELLP syndrome and severe preeclampsia. Pregnancy Hypertens. 19,
190–194. https://doi.org/10.1016/j.preghy.2020.01.013 (2020).
10. Melton, P. E. et al. Whole-exome sequencing in multiplex preeclampsia families identifies novel candidate susceptibility genes. J.
Hypertens. 37, 997–1011. https://doi.org/10.1097/HJH.0000000000002023 (2019).
11. Mishra, J. et al. Differential global and MTHFR gene specific methylation patterns in preeclampsia and recurrent miscarriages: A
case-control study from North India. Gene 704, 68–73. https://doi.org/10.1016/j.gene.2019.04.036 (2019).
12. Salameh, Y., Bejaoui, Y. & El Hajj, N. DNA methylation biomarkers in aging and age-related diseases. Front. Genet 11, 171. https://
doi.org/10.3389/fgene.2020.00171 (2020).
13. Zhu, T. et al. CancerClock: A DNA methylation age predictor to identify and characterize aging clock in pan-cancer. Front. Bioeng.
Biotechnol. 7, 388. https://doi.org/10.3389/fbioe.2019.00388 (2019).
14. Mendelson, M. M. Epigenetic age acceleration: a biological doomsday clock for cardiovascular disease?. Circ. Genom. Precis. Med.
11, e002089. https://doi.org/10.1161/CIRCGEN.118.002089 (2018).
15. Dugue, P. A. et al. Association of DNA methylation-based biological age with health risk factors and overall and cause-specific
mortality. Am. J. Epidemiol. 187, 529–538. https://doi.org/10.1093/aje/kwx291 (2018).
16. Horvath, S. DNA methylation age of human tissues and cell types. Genome Biol. 14, R115. https://doi.org/10.1186/gb-2013-14-
10-r115 (2013).
17. Hannum, G. et al. Genome-wide methylation profiles reveal quantitative views of human aging rates. Mol. Cell 49, 359–367. https://
doi.org/10.1016/j.molcel.2012.10.016 (2013).
18. Horvath, S. et al. Epigenetic clock for skin and blood cells applied to Hutchinson Gilford Progeria Syndrome and ex vivo studies.
Aging (Albany NY) 10, 1758–1775. https://doi.org/10.18632/aging.101508 (2018).
19. Wu, X. et al. DNA methylation profile is a quantitative measure of biological aging in children. Aging (Albany NY) 11, 10031–10051.
https://doi.org/10.18632/aging.102399 (2019).
20. Levine, M. E. et al. An epigenetic biomarker of aging for lifespan and healthspan. Aging (Albany NY) 10, 573–591. https://doi.org/
10.18632/aging.101414 (2018).
21. Lu, A. T. et al. DNA methylation GrimAge strongly predicts lifespan and healthspan. Aging (Albany NY) 11, 303–327. https://doi.
org/10.18632/aging.101684 (2019).
22. Lu, A. T. et al. DNA methylation-based estimator of telomere length. Aging (Albany NY) 11, 5895–5923. https://doi.org/10.18632/
aging.102173 (2019).
23. Kamrani, A. et al. The role of epigenetic changes in preeclampsia. BioFactors 45, 712–724. https://d oi.o
rg/1 0.1 002/b
iof.1 542 (2019).
Scientific Reports | (2022) 12:1664 | https://doi.org/10.1038/s41598-022-05744-4 10
Vol:.(1234567890)www.nature.com/scientificreports/
24. Mayne, B. T. et al. Accelerated placental aging in early onset preeclampsia pregnancies identified by DNA methylation. Epigenomics
9, 279–289. https://doi.org/10.2217/epi-2016-0103 (2017).
25. Lamminpaa, R., Vehvilainen-Julkunen, K., Gissler, M. & Heinonen, S. Preeclampsia complicated by advanced maternal age: a
registry-based study on primiparous women in Finland 1997–2008. BMC Pregnancy Childbirth 12, 47. https://doi.org/10.1186/
1471-2393-12-47 (2012).
26. Sheen, J. J. et al. Maternal age and preeclampsia outcomes during delivery hospitalizations. Am. J. Perinatol. 37, 44–52. https://doi.
org/10.1055/s-0039-1694794 (2020).
27. Heinsberg, L. W. et al. An exploratory study of epigenetic age in preeclamptic and normotensive pregnancy reveals differences by
self-reported race but not pregnancy outcome. Reprod. Sci. 28, 3519–3528. https://doi.org/10.1007/s43032-021-00575-6 (2021).
28. Johnson, M. P. et al. Genome-wide association scan identifies a risk locus for preeclampsia on 2q14, near the inhibin, beta B gene.
PLoS ONE 7, e33666. https://doi.org/10.1371/journal.pone.0033666 (2012).
29. Brown, M. A., Gallary, E. D. M., Gatt, S. P., Leslie, G. & Robinson, J. Management of hypertension in pregnancy: executive sum-
mary. Australasian society for the study of hypertension in pregnancy. Med. J. Aust. 158, 700–702 (1993).
30. Brown, M. A. et al. The detection, investigation and management of hypertension in pregnancy: executive summary. Aust. N. Z.
J. Obstet. Gynaecol. 40, 133–138. https://doi.org/10.1111/j.1479-828x.2000.tb01136.x (2000).
31. Lowe, S. A. et al. Guidelines for the management of hypertensive disorders of pregnancy 2008. Aust. N. Z. J. Obstet. Gynaecol. 49,
242–246. https://doi.org/10.1111/j.1479-828X.2009.01003.x (2009).
32. Muller, F. et al. RnBeads 2.0: comprehensive analysis of DNA methylation data. Genome Biol. 20, 55. https://doi.org/10.1186/
s13059-019-1664-9 (2019).
33. Teschendorff, A. E. et al. A beta-mixture quantile normalization method for correcting probe design bias in Illumina Infinium
450 k DNA methylation data. Bioinformatics 29, 189–196. https://doi.org/10.1093/bioinformatics/bts680 (2013).
34. Decamps, C. et al. Guidelines for cell-type heterogeneity quantification based on a comparative analysis of reference-free DNA
methylation deconvolution software. BMC Bioinf. 21, 16. https://doi.org/10.1186/s12859-019-3307-2 (2020).
35. Pelegi-Siso, D., de Prado, P., Ronkainen, J., Bustamante, M. & Gonzalez, J. R. methylclock: a bioconductor package to estimate
DNA methylation age. Bioinformatics 37, 1759–1760. https://doi.org/10.1093/bioinformatics/btaa825 (2021).
36. Team, R. R: A language and environment for statistical computing. (2018).
37. Ross, K. M. et al. Epigenetic age and pregnancy outcomes: GrimAge acceleration is associated with shorter gestational length and
lower birthweight. Clin. Epigenetics 12, 120. https://doi.org/10.1186/s13148-020-00909-2 (2020).
38. Yogev, Y. et al. Pregnancy outcome at extremely advanced maternal age. Am. J. Obstet. Gynecol. 203(558), e551-557. https://doi.
org/10.1016/j.ajog.2010.07.039 (2010).
39. Ziadeh, S. M. Maternal and perinatal outcome in nulliparous women aged 35 and older. Gynecol. Obstet. Invest. 54, 6–10. https://
doi.org/10.1159/000064689 (2002).
40. Herbert, M., Kalleas, D., Cooney, D., Lamb, M. & Lister, L. Meiosis and maternal aging: insights from aneuploid oocytes and
trisomy births. Cold Spring Harb. Perspect. Biol. 7, a017970. https://doi.org/10.1101/cshperspect.a017970 (2015).
41. Tekola-Ayele, F. et al. Sex differences in the associations of placental epigenetic aging with fetal growth. Aging (Albany NY) 11,
5412–5432. https://doi.org/10.18632/aging.102124 (2019).
42. Cheng, S. B., Davis, S. & Sharma, S. Maternal-fetal cross talk through cell-free fetal DNA, telomere shortening, microchimerism,
and inflammation. Am. J. Reprod. Immunol. 79, e12851. https://doi.org/10.1111/aji.12851 (2018).
43. Phillippe, M. Cell-free fetal DNA, telomeres, and the spontaneous onset of parturition. Reprod. Sci. 22, 1186–1201. https://doi.
org/10.1177/1933719115592714 (2015).
44. Liao, A. H., Liu, L. P., Ding, W. P. & Zhang, L. Functional changes of human peripheral B-lymphocytes in pre-eclampsia. Am. J.
Reprod. Immunol. 61, 313–321. https://doi.org/10.1111/j.1600-0897.2009.00697.x (2009).
45. Fukui, A. et al. Changes of NK cells in preeclampsia. Am. J. Reprod. Immunol. 67, 278–286. https://doi.org/10.1111/j.1600-0897.
2012.01120.x (2012).
46. Ye, Y. et al. Role of plasminogen activator inhibitor type 1 in pathologies of female reproductive diseases. Int. J. Mol. Sci. https://
doi.org/10.3390/ijms18081651 (2017).
47. Morgan, J. A., Bombell, S. & McGuire, W. Association of plasminogen activator inhibitor-type 1 (-675 4G/5G) polymorphism with
pre-eclampsia: systematic review. PLoS ONE 8, e56907. https://doi.org/10.1371/journal.pone.0056907 (2013).
48. Clausen, T. et al. Altered plasma concentrations of leptin, transforming growth factor-beta(1) and plasminogen activator inhibi-
tor type 2 at 18 weeks of gestation in women destined to develop pre-eclampsia. Circulating markers of disturbed placentation?.
Placenta 23, 380–385. https://doi.org/10.1053/plac.2002.0828 (2002).
49. Estelles, A., Gilabert, J., Aznar, J., Loskutoff, D. J. & Schleef, R. R. Changes in the plasma levels of type 1 and type 2 plasminogen
activator inhibitors in normal pregnancy and in patients with severe preeclampsia. Blood 74, 1332–1338 (1989).
50. Koh, S. C., Anandakumar, C., Montan, S. & Ratnam, S. S. Plasminogen activators, plasminogen activator inhibitors and markers
of intravascular coagulation in pre-eclampsia. Gynecol. Obstet. Invest. 35, 214–221. https://doi.org/10.1159/000292703 (1993).
51. Roes, E. M. et al. Levels of plasminogen activators and their inhibitors in maternal and umbilical cord plasma in severe preeclamp-
sia. Am. J. Obstet. Gynecol. 187, 1019–1025. https://doi.org/10.1067/mob.2002.126280 (2002).
52. Whigham, C. A. et al. Circulating adrenomedullin mRNA is decreased in women destined to develop term preeclampsia. Pregnancy
Hypertens. 16, 16–25. https://doi.org/10.1016/j.preghy.2019.02.003 (2019).
53. Gao, W. L. et al. Detection of global DNA methylation and paternally imprinted H19 gene methylation in preeclamptic placentas.
Hypertens. Res. 34, 655–661. https://doi.org/10.1038/hr.2011.9 (2011).
54. Kulkarni, A., Chavan-Gautam, P., Mehendale, S., Yadav, H. & Joshi, S. Global DNA methylation patterns in placenta and its asso-
ciation with maternal hypertension in pre-eclampsia. DNA Cell Biol. 30, 79–84. https://doi.org/10.1089/dna.2010.1084 (2011).
55. Field, A. E. et al. DNA methylation clocks in aging: categories, causes, and consequences. Mol. Cell. 71, 882–895. https://doi.org/
10.1016/j.molcel.2018.08.008 (2018).
56. Gibson, J. et al. A meta-analysis of genome-wide association studies of epigenetic age acceleration. PLoS Genet. 15, e1008104.
https://doi.org/10.1371/journal.pgen.1008104 (2019).
Acknowledgements
We would like to thank all of the individuals in this study whose participation made this work possible. This work
was supported by resources provided by The Pawsey Supercomputing Centre with funding from the Australian
Government and the Government of Western Australia.
Author contributions
P.P.P. conducted statistical analyses and wrote the manuscript, P.E.M. conducted bioinformatic and statistical
analyses and provided critical comments, P.E.M., E.M. and S.B. designed the study. All authors read and revised
the submitted versions of the manuscript.
Scientific Reports | (2022) 12:1664 | https://doi.org/10.1038/s41598-022-05744-4 11
Vol.:(0123456789)www.nature.com/scientificreports/
Competing interests
The authors declare no competing interests.
Additional information
Correspondence and requests for materials should be addressed to P.P.-P.
Reprints and permissions information is available at www.nature.com/reprints.
Publisher’s note Springer Nature remains neutral with regard to jurisdictional claims in published maps and
institutional affiliations.
Open Access This article is licensed under a Creative Commons Attribution 4.0 International
License, which permits use, sharing, adaptation, distribution and reproduction in any medium or
format, as long as you give appropriate credit to the original author(s) and the source, provide a link to the
Creative Commons licence, and indicate if changes were made. The images or other third party material in this
article are included in the article’s Creative Commons licence, unless indicated otherwise in a credit line to the
material. If material is not included in the article’s Creative Commons licence and your intended use is not
permitted by statutory regulation or exceeds the permitted use, you will need to obtain permission directly from
the copyright holder. To view a copy of this licence, visit http://creativecommons.org/licenses/by/4.0/.
© The Author(s) 2022
Scientific Reports | (2022) 12:1664 | https://doi.org/10.1038/s41598-022-05744-4 12
Vol:.(1234567890)You can also read