Journal of Food Engineering - WUR E-depot
←
→
Page content transcription
If your browser does not render page correctly, please read the page content below
Journal of Food Engineering 303 (2021) 110592
Contents lists available at ScienceDirect
Journal of Food Engineering
journal homepage: http://www.elsevier.com/locate/jfoodeng
Modelling ice growth and inclusion behaviour of sucrose and proteins
during progressive freeze concentration
Jan Eise Vuist, Rikke Linssen, Remko M. Boom, Maarten A.I. Schutyser *
Laboratory of Food Process Engineering, Wageningen University and Research, 4 P.O. Box 17, 6700, AA, Wageningen, the Netherlands
A R T I C L E I N F O A B S T R A C T
Keywords: This study focused on modelling ice growth and solute inclusion behaviour during progressive freeze concen
Progressive freeze concentration tration of sucrose, soy protein, and whey protein. Experiments were conducted in a small stirred tank set-up and
Solute inclusion ice growth was modelled using mass and heat balances. Solute inclusion was estimated using an intrinsic dis
Sucrose
tribution coefficient. For sucrose solutions, the intrinsic distribution coefficient is proposed dependent on the
Whey protein
Dewatering
initial and critical concentrations, where the last is related to the fast increase in viscosity and decrease in
diffusivity when the solution approaches glass transition. Predictions were found in agreement with experimental
data, except when dendritic ice growth was observed. Solutions of whey and soy proteins behaved differently due
to their large difference in solubility. These proteins also showed different inclusion behaviour compared to
sucrose, due to lower freezing point depression and lower concentrations far away from glass transition.
1. Introduction Progressive freeze concentration involves partial freezing of the fluid
on the surface of a heat exchanger (Halde, 1980; Liu et al., 1997). Forced
Freeze concentration is the process to concentrate aqueous streams convection reduces concentration polarisation close to the ice surface
by the removal of water as ice crystals after cooling the stream to its and thus lowers the amount of solute inclusions into the ice (Vuist et al.,
freezing point. The main advantage of freeze concentration over con 2020). Progressive freeze concentration is operated as a batch process.
centration by evaporation is that heat sensitive components are not When the ice layer has a specified maximum thickness and thus the
affected at the low temperatures in the process (Berk, 2009; Sánchez solution has reached the desired concentration, the operation is ended
et al., 2011; Auleda et al., 2011). There are three different approaches to by draining the system. Subsequently the ice is melted to collect the
carry out freeze concentration, i.e. suspension freeze concentration, water from the concentrate. If a higher concentration factor is desired, a
block freeze concentration and progressive freeze concentration. In second progressive freeze concentration step may be applied to the
suspension freeze concentration the ice crystals are grown in suspension concentrate.
and are removed through a continuous wash filter This process is The process of progressive freeze concentration has been studied for
already available on an industrial scale (Sánchez et al., 2011; Kadi and various equipment designs. Generally, for minimum solute inclusion in
Janajreh, 2017). In block freeze concentration the solution is completely the ice layer, high agitation and low freezing rates are required. Flesland
frozen and then selectivily thawed to remove the concentrate (Moreno (1995) used an open system with the liquid flowing over a cooling plate
et al., 2014; Petzold et al., 2015). In progressive freeze concentration the and observed that concentration of sucrose solutions could be realised
ice is grown as a layer on a heat exchanger surface. This process is till albeit the desired recovery was only achieved at low ice growth rates
now mostly investigated at lab scale and some at pilot scale, although and by applying a multi-step freeze concentration process (Flesland,
some small scale industrial units with a maximum capacity of around 50 1995; Ratkje and Flesland, 1995). Liu et al. (1997) used a cylinder
l exist and a larger scale unit (100 l) is under development. (Rane and submerged in a cooled ethanol bath to concentrate glucose solutions.
Jabade, 2005; Miyawaki et al., 2005; Meiwa Co. Ltd, 2018). To scale this Later, this system was scaled up to a closed tubular device (Miyawaki
technology ultimately to an industrially relevant scale and apply it to et al., 2005). In this device, coffee, tomato juice, and sucrose were
relevant product streams, more insight is required in the dynamics of the concentrated, which demonstrated the potential of progressive freeze
process, which requires both experimental and modelling work. concentration to relevant streams in food industry. Raventós et al.
* Corresponding author.
E-mail address: maarten.schutyser@wur.nl (M.A.I. Schutyser).
https://doi.org/10.1016/j.jfoodeng.2021.110592
Received 12 November 2020; Received in revised form 26 February 2021; Accepted 15 March 2021
Available online 20 March 2021
0260-8774/© 2021 The Author(s). Published by Elsevier Ltd. This is an open access article under the CC BY license (http://creativecommons.org/licenses/by/4.0/).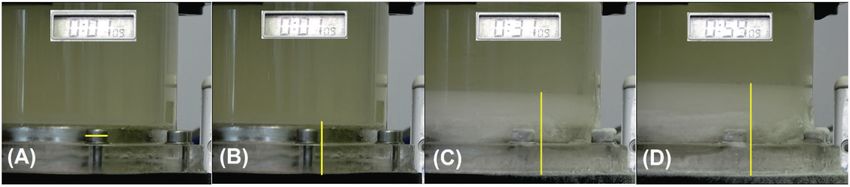
J.E. Vuist et al. Journal of Food Engineering 303 (2021) 110592
(2007) used a setup based on a falling film and Ojeda et al. (2017) used a ( )
qfp = hov,i Tfp − Tcoolant (4)
setup consisting of a stirred tank with cooled walls. They applied freeze
concentration to sucrose solutions and concluded that the eutectic point We assume that the ice growth is proportional to the excess of heat
was the limiting factor for freeze concentration. However, sucrose so removed via the ice layer (eq. (4)) minus the heat transported towards
lutions are known for their supersaturation and show no eutectic con the ice boundary from the fluid bulk (eq. (3)). If we assume that the ice is
centration behaviour (van der Sman, 2016, 2017). growing uniformly, the ice growth rate can be derived via the ice density
To allow scaling of film freeze concentration towards industrial (eq. (5)). The heat of fusion, ΔHfus , was assumed to be equal to that of
scale, modelling can be used to design larger-scale freeze concentration water (333.5 kJ/kg).
processes and to estimate the efficiency and economics at this scale. In
dLice qice − qfp
several previous studies models were developed for the film freeze vice = = (5)
dt ΔHfus ρice
concentration process. Ratkje and Flesland (1995) assumed the growth
rate of ice to be constant and derived that inclusions may be prevented
when the ice growth rate is below a maximum threshold determined by 2.2. Solute inclusion
the temperature difference between the ice front and the cooling surface
and the diffusion rate of the solute (Scholz, 1993; Scholz et al., 1993; The concentration effect in film freeze concentration is caused by
Flesland, 1995; Ratkje and Flesland, 1995). Auleda et al. (2011) pro exclusion of the solute from the ice. However the exclusion of the solute
posed a modelling approach for a falling film freeze concentrator based is not perfect and this leads to solute inclusion. This can be expressed as
on the work of Chen and Chen (2000), who employed a semi-empirical an average distribution coefficient, K (eq. (6)). The average distribution
correlation based on freezing point depression, ice growth rate and the coefficient can be measured after a freeze concentration experiment by
liquid velocity. Miyawaki et al. (1998) proposed an intrinsic distribution analysing the composition of the fluid (Cl ) and the ice phase (Cs ),
coefficient (K0 ) to predict solute inclusion during progressive freeze respectively (Fig. 1). Due to concentration polarisation the average
concentration. This intrinsic distribution coefficient is the ratio between distribution coefficient is not equal to the intrinsic distribution coeffi
the solute concentration in the ice and the solute concentration in the cient (eq. (1)) (Burton et al., 1953b).
solution at the boundary, when the boundary moves infinitesimally Cs (t)
slowly (eq. (1)). K= (6)
Cl
Cs
K0 = (1) Cs
Ci K0 = (7)
Ci
The intrinsic distribution coefficient K0 is in fact an empirical
The concentration polarisation above the ice surface can be
parameter that can be obtained from freeze concentration experiments
described with a mass balance over the hydrodynamic boundary layer
with a specific solute. Gunathilake et al. (2013) observed that K0 is
(eq. (8)).
concentration dependent. Gu et al. (2006) related the intrinsic distri
bution coefficient to the osmotic pressure, which in it self is directly dC
− D + vice C = vice Cs (8)
related to the water activity of the solution. This worked well for dx
calculating the coefficient for single component system containing salt,
The frame of reference for this mass balance is the ice surface which
however for glucose and dextran mixtures they found that the viscosity
is defined to be at x = 0. Ice growth leads to a flux of water with speed
had a large influence on the intrinsic distribution coefficient. Chen and
vice into the ice. Cs is the concentration of solute in the ice, C is the
Chen (2000) related the distribution coefficient to the freezing point
depression via a semi-empirical relationship and found the correlation to
fit well for falling film freeze concentration and suspension freeze con
centration. They expanded upon this work to determine the maximum
allowable freezing rate and to account for different geometries of the
cooling systems (Chen et al., 2015).
The aim of this work is to develop a coupled heat and mass transfer
model to describe the freeze concentration process including solute in
clusion. Specifically, we investigate the relation of the intrinsic distri
bution coefficient (K0 ) to the phase behaviour of the solute and the
solvent to predict solute inclusion. We hypothesise that K0 is related to
the ratio of the concentration of the solution and a critical concentration
related to the glass transition. We compare freeze concentration exper
iments and model predictions for protein and sugar solutions. Mea
surements were done on lab scale in which the ice growth rate and solute
inclusion were both analysed.
2. Theory
2.1. Ice growth
The average ice growth rate on the cooling plate follows from the
energy balance over the ice boundary (eq. (2)) Rane and Jabade (2005).
( )
dMice qice − qfp Afp
= (2)
dt ΔHfus
( )
qice = h Tl − Tfp (3)
Fig. 1. Schematic drawing of the temperature and concentration profiles near
the cold wall. For visualization the system is rotated with 90◦ .
2
J.E. Vuist et al. Journal of Food Engineering 303 (2021) 110592
concentration in the boundary layer, and D is the diffusion coefficient of
the solute in the solvent. The boundary conditions for this equation are
C = Ci at x = 0 (the concentration in the liquid phase) and C = Cl at x =
− δ where δ is the boundary layer thickness. When these boundary
conditions are used eq. (8) can be integrated to obtain eq. (9).
Ci − Cs (v δ)
(9)
ice
= exp
Cl − Cs D
When combining eq. (9) with the definition for the intrinsic distri
bution coefficient and replacing D/δ by the mass transfer coefficient k, a
practical expression is obtained for the concentration of the solute at the
ice boundary (eq. (10)).
( )
exp vice
k
Cl
Cs = ( ) (10)
vice
exp k + K10 − 1
2.3. Intrinsic distribution coefficient
The intrinsic distribution coefficient, K0 , is proposed by Burton et al.
(1953b) as the ratio of the concentration of solute in the ice, Cs and that
in the liquid at the interface, Ci . This ratio converges to a constant value
when the temperature of the ice approaches the freezing temperature
(Burton et al., 1953a, b). Gunathilake et al. (2013) showed that for su
crose systems the intrinsic distribution coefficient depends on the so
lution concentration (Cl ). Gu et al. (2006) observed this dependence also Fig. 2. State diagram of sucrose after Roos (2010); van der Sman (2017). The
for different salts and glucose and related the intrinsic distribution co purple arrow indicates the trajectory of the solution during progressive freeze
concentration. (For interpretation of the references to colour in this figure
efficient to the osmotic pressure, although they could not explain the
legend, the reader is referred to the Web version of this article.)
behaviour of glucose at 20%.
K0 =
Cl
(11) 3. Material and methods
Ccritical
( ) 3.1. Description of the progressive freeze concentrator
Ccritical = f Tm , T ′ g (12)
As small carbohydrates like sucrose tend to be supersaturated at low A schematic drawing of the lab scale film freeze concentrator, used in
temperatures, rather than allow crystallization of the carbohydrate, we this paper, is shown in Fig. 3. A similar set-up has been used in previous
cannot use a eutectic point, which normally should lead to the maximum work (Vuist et al., 2020), compared to this system the volume has been
degree of freeze concentration. We therefore propose that the value of reduced by reducing the height of the cylinder to 90 mm. The system
K0 (eq. (11)) is, for small carbohydrates, dependent on the ratio between consists of a vessel that contains the solution that needs to be concen
the solute concentration in the liquid and the concentration determined trated, separated with a metal plate from a chamber that contains
by a margin above where the apparent glass temperature (T′ g ) meet the circulating fluid, temperature-controlled by an external cryostat. The
solidus line (Tm ), this is deemed the critical concentration (eq. (12)) (van experiments are started by first freezing a droplet (0.1 ml) of distilled
der Sman and Mauer, 2019; Roos and Karel, 1991a, b). For sucrose this water to prevent supercooling of the liquid and to avoid spontaneous
value was determined to be 0.62 kg/kg. bulk crystallization of a supercooled liquid. As soon as the droplet is
The ultimate end point for freeze concentration would be the point frozen, the precooled liquid feed is added through a funnel. After the
where the freezing line would cross the line of the glass temperature vessel has been filled completely, stirring is started. After the experiment
Fig. 2. At this point a maximally freeze concentrated system would be the concentrated liquid is drained from the tank and the ice layer is
obtained (Roos and Karel, 1991a, b). In the glassy state a domain of pure wiped dry with a paper tissue. Subsequently the ice layer is melted.
ice and small glassy domains of the maximally freeze concentrated sugar Samples were taken from the liquid at t = 0 and at t = end, plus a
solution would co-exist. Since the diffusion coefficient at the glass sample was taken from the molten ice. The samples were stored frozen
temperature is effectively zero, this would imply that the ice would have until analysis. For the concentration experiments four different cooling
the exact same composition as the solution, as the solutes cannot diffuse programmes were used: two constant temperature programmes at 5 ◦ C
away from the freezing frontier anymore. However, before reaching the or 10 ◦ C below the freezing point of the solution for 1 h, only applied to
glass transition temperature, we have to consider the rapidly increasing the soy protein concentrate, and two decreasing temperature pro
viscosity when approaching this solidification point (Williams et al., grammes starting 2.5 ◦ C below the freezing point and then decreasing by
1955). This increase in viscosity for sucrose solutions becomes relevant 0.1 ◦ C/min or 0.5 ◦ C/min for 1 h applied to all solutions. The freezing
when the solution is super-saturated, especially when working at low points of the solutions have been calculated using the
temperatures during freeze concentration (Kauzmann, 1948). It leads to Clausius-Clapeyron equation (eq. (13)).
significant reduction of the mass transfer rate in the boundary layer and ΔHfus
(
1 1
)
as a result the solute concentration gradient in the boundary layer will ln(1 − xs ) = − (13)
R Tfp,0 Tfp
increase. Due to the higher concentrations, the inclusion rate increases
and a less effective separation is achieved. In this case the intrinsic
partition coefficient (eq. (11)) can be considered to give an indication of 3.2. Materials
the remaining capacity for a carbohydrate system to be concentrated.
Solutions of sucrose, soy protein concentrate (SPC) and whey protein
isolate (WPI) solutions were used as feed solutions. Sucrose was
3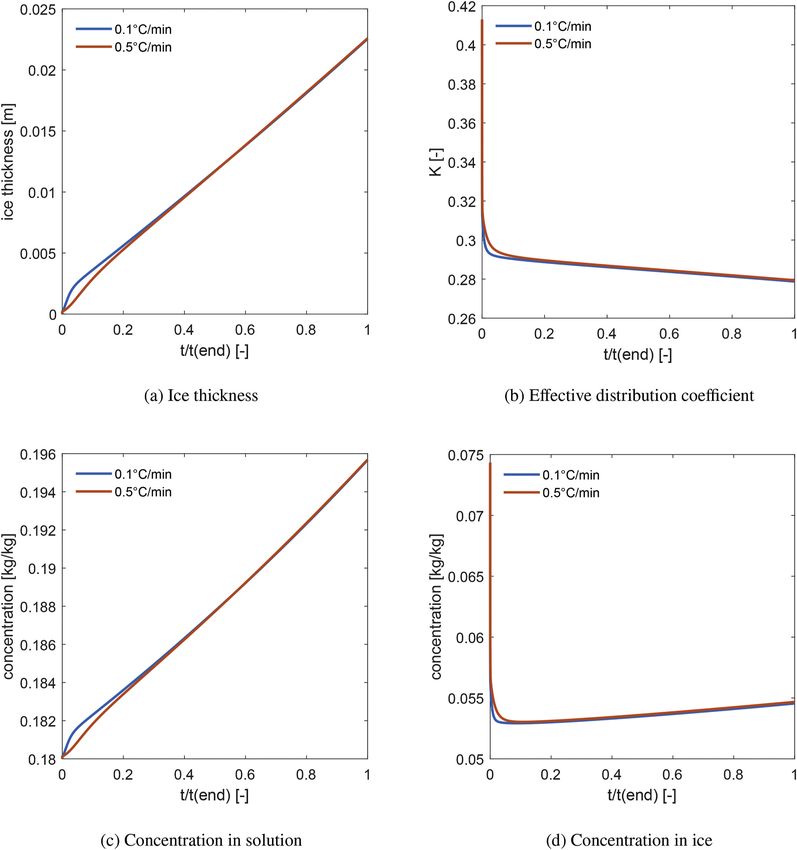
J.E. Vuist et al. Journal of Food Engineering 303 (2021) 110592
Fig. 3. Picture (left) and schematic representation (right) of the small-scale setup.
obtained from Sigma-Aldrich (USA, BioXtra, purity >99.5%), SPC was 3.3.4. Protein content analysis
obtained from Vitablend (The Netherlands, Unico HS IP, minimum 70% For both the SPC and WPI samples the dry weight was determined.
protein), and WPI was obtained from Davisco (Switzerland, BiPro®, For this, the samples were placed in pre-weighed cups and dried over
purity >97.0%). Sodium phosphate dibasic and sodium phosphate night at 105 ◦ C. The SPC samples were further analysed using the Dumas
monobasic were obtained from Sigma-Aldrich (USA, at least analytical method. Approximately 10 mg of dry sample was weighed in an
grade). All solutions were prepared with ultrapure water from a Milli-Q aluminium cup and then closed. The nitrogen content was measured
system (Millipore Corporation, United States). (ThermoFisher, FlashEA 1112 series N Analyser, USA) and multiplied
with a conversion factor 6.25 to convert the nitrogen content to protein
3.3. Methods mass. The WPI samples were analysed using HPSEC (Thermo Ultimate
3000 HPLC, ThermoFisher Scientific, USA) on two columns in series
3.3.1. Solution preparation (TSKGel G3000SWXL and G2000SWXL, both 5 μm 300 × 7.8 mm) at
Sucrose and WPI solutions were prepared by dissolving sucrose and 30 ◦ C, using UV–Vis detection at 214 nm. The sample size was 10 μl. The
WPI in ultrapure water. The solutions were stirred at room temperature feed samples were diluted 10 times with water, the ice fraction samples
until everything was dissolved. The SPC solution was prepared by dis were used undiluted. The eluent was 30% Acetonitrile in Milli-Q water
solving the SPC overnight at 4 ◦ C while stirring was applied. The next with 0.1% Trifluoracetic acid. The flow rate of the eluent was 1.5 ml per
day the solution was centrifuged for 30 min at 16,000 xG and 4 ◦ C to minute.
remove any residual insoluble particles. The supernatant was then
collected to be used as the solution in concentration experiments. The 3.3.5. Equation solving
solutions were stored at 0 ◦ C in an ice bath until usage the next day. The differential equations were solved using a variable order Runge-
Kutta method (ode45, Mathworks MATLAB R2019b, USA) (Dormand
3.3.2. Ice growth measurement and Prince, 1980; Shampine and Reichelt, 1997).
The ice growth during the freeze concentration of the proteins was
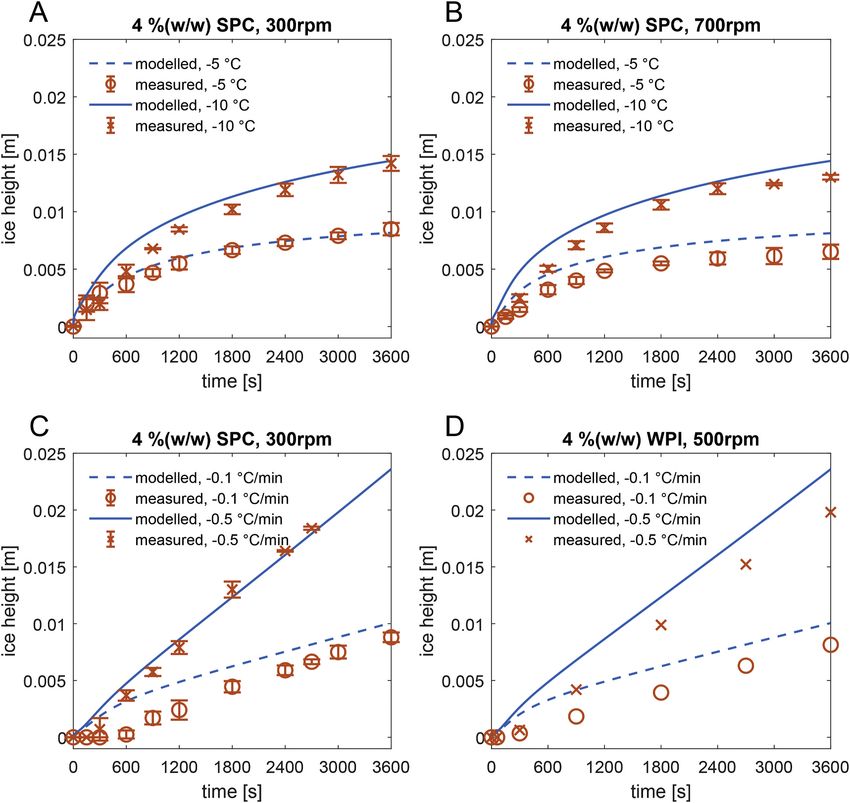
monitored by time-lapse pictures taken during the experiment. These 3.3.6. Determination of intrinsic partition coefficient
pictures were analysed using image analysis software (ImageJ, USA) to To determine the intrinsic partition coefficient K0 , we express the
determine the ice growth rate (Fig. 4). The width of the front bolt (8.38 partition coefficient as function of the intrinsic partition coefficient, the
mm) in the picture is used as a reference for sizing. With this reference, ice growth rate and mass transfer coefficient by rearranging eq. (10) and
the ratio of pixels per mm was calculated and thus the ice thickness using the definition of K (eq. (6)) to obtain eq. (18). This equation can
could be quantified. again be rewritten into eq. (19) giving a linear relation between
ln(1 /K − 1) and vice /k (Pradistsuwana et al., 2003). The mass transfer
3.3.3. Sucrose content coefficient, k was determined from the Sherwood relation for stirred
The sucrose content of the sucrose solution was determined using a tanks (eq. (14) to (17)).
refractometer (Anton Paar, Abbemat 500, Germany).
Fig. 4. Method to measure ice growth; (A) width of the bolt, (B) thickness after 1 min, (C) thickness after 31 min, (D) thickness after 59 min.
4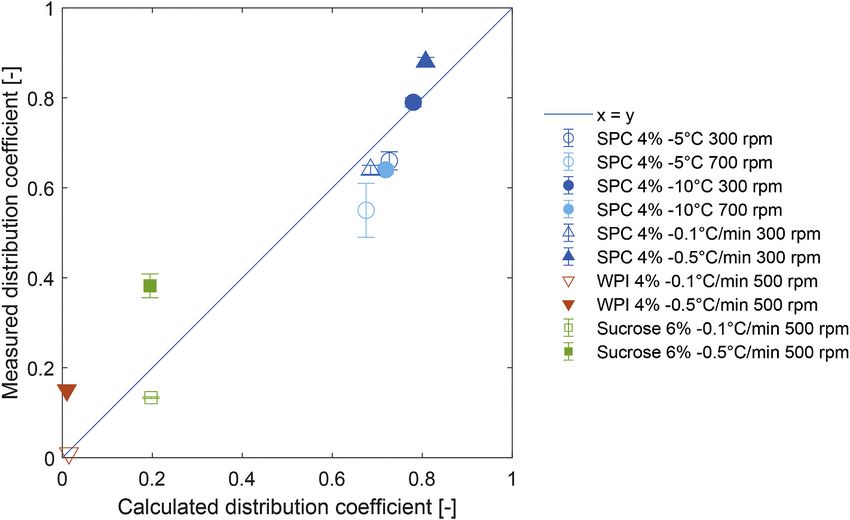
J.E. Vuist et al. Journal of Food Engineering 303 (2021) 110592
k We expect this is due to the increased heat loss via the side walls of the
NSh = (14)
D/L tank leading to a slowdown of the ice growth in practice. This effect is
more pronounced for the − 5 ◦ C cooling temperature, because at this
temperature relatively more cooling capacity is used for compensating
2 1
NSh = 0.36NRe
3
NSc
3
(15)
the heat influx from the environment than for ice growth.
ρNd2 In Fig. 6C the ice growth ice is shown using a linear decreasing
NRe = (16) temperature of the freezing plate with a 4% (w/w) SPC solution. The ice
μ
thickness increases approximately in linearly, except for an initial lag,
NSc =
μ
(17) which can be observed for the − 0.1 ◦ C/min cooling profile. This lag may
Dρ be caused by two effects that are not taken into account into the model.
First, the gradual cooling of the walls of the cylinder and the heat influx
K0 from the environment have not been taken into account, and these effect
K= ( ) (18)
K0 + (1 − K0 )exp − vice
k are relatively large for a small temperature difference between the liquid
and the coolant, relative to the heat removed for ice growth. A second
( ) ( ) aspect is the crystallization kinetics (Myerson et al., 2019). At
1 1 vice
ln − 1 = ln − 1 − (19) − 0.5 ◦ C/min the lag is not noticeable, as the faster decrease in tem
K K0 k
perature dominates.
By fitting this linear equation to experimental data obtained at In Fig. 6D, freeze concentration with the same temperature ramps is
different ice growth rates and/or stirrer rates we can obtain the intrinsic shown for a 4% (w/w) WPI solution. One may compare with Fig. 6C for a
partition coefficient by extrapolating vice /k→0 (Fig. 5). 4% SPC solution. The calculated values for ice height are almost similar.
This is expected as both solutions have similar density, viscosity and
4. Results and discussion heat conductivity. However a systematic overestimation is observed for
the Whey Protein Isolate solution. This overestimation is probably
4.1. Modelling ice growth rate as function of time caused by the ice being purer, as we will show below, and thus the ice
has a lower volume than the ice during freeze concentration with SPC
We first measured ice thicknesses as a function of time for different since there are less inclusions. For all solutions concentrated the ice
conditions and compared those to the predictions by the energy balance growth rate was around 1 μm/s for 0.1 ◦ C/min cooling and 5 μm/s for
(eq. (5)) (Fig. 6). Fig. 6A shows the ice thickness increase for a 4% (w/w) 0.5 ◦ C/min. These values are inline with the values reported in literature
soy protein concentrate solution with a constant plate temperature of (Miyawaki et al., 2005; Gunathilake et al., 2013; Moreno et al., 2014).
− 10 ◦ C and a stirring rate of 300 rpm. There is a slight overestimation of The calculated and measured ice masses after 1 h of freeze concen
the ice growth in the initial phase, but at larger times the agreement is tration are compared in Fig. 7. For the constant cold wall temperature
quite good. This slight overestimation of the initial ice growth may be conditions the calculated values are relatively close to the parity line.
explained by our use of a fixed density in the model, which is critical for The calculated values for the 0.1 ◦ C/min decreasing ramp show a similar
calculating the ice thickness (eq. (5)). In the initial phase the growth rate trend for both SPC and WPI, slightly overestimating the ice mass formed.
is very high, leading to more inclusions leading to a significantly larger The calculated values for 0.5 ◦ C/min WPI show a slightly larger over
ice volume compared to the ice volume in the model. Fig. 6B shows the estimation than for the 0.1 ◦ C/min decrease and SPC shows an even
ice growth for the same solution stirred at 700 rpm. At this high stirring larger overestimation. This is probably caused by more solute inclusions.
rate the ice growth is consistently overestimated for the entire process. The inclusions of pockets of highly concentrated solution reduce the
conductivity (Kestin et al., 1984; Bonales et al., 2017). while the larger
volume and thus thickness of the ice layer also reduces the conductance.
Both effects slow the ice growth more than predicted by our model that
does not include these effects.
4.2. Solute inclusion
Solute inclusion has been modelled according to eq. (10) and is
presented in Fig. 8 as the average solute distribution, together with the
measured solute inclusion. The solute inclusion with a cooling ramp of
0.5 ◦ C per minute is underestimated for all the solutes. The increased
concentration polarisation at a higher ice growth rate causes more in
clusion than would be expected from the concentration in the bulk. This
increased concentration polarisation may again lead to a more super
cooling and thus formation of dendritic ice crystals, which leads to
increased solute inclusion (Myerson et al., 2019). The formation of
dendritic ice crystals is obviously not taken into account in the current
model. The obtained measured inclusions for sucrose are found similar
to those reported by Miyawaki et al. (2005). Since the whey protein used
in our experiments contains almost no lactose and salts we have found
hardly any inclusion of protein in our experiments at low ice growth
rates. Sánchez et al. (2011) reported distribution coefficients range from
0.25 to 0.45 depending on the solids concentration.
For the sucrose solutions concentrated with a cooling ramp of 0.1 ◦ C
per minute, the solute inclusion for the 6% (w/w) sucrose solution is
overestimated while for the other solutions the solute inclusion is
Fig. 5. Result of linear regression on inclusion data obtained for Soy Protein underestimated (Fig. 8). This is caused by a larger supercooling at these
Concentrate. concentrations. Even though the cooling profile was adjusted for each
5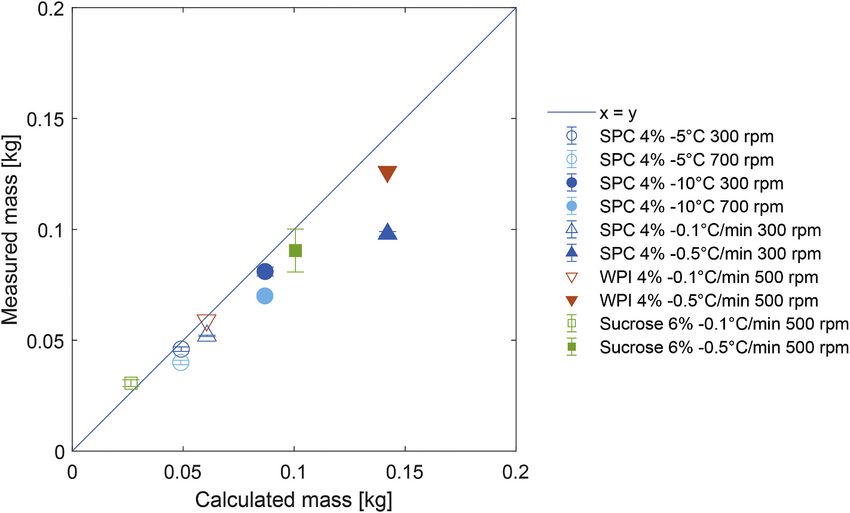
J.E. Vuist et al.                                                                                                         Journal of Food Engineering 303 (2021) 110592

                    Fig. 6. Modelled and measured ice growth for SPC and WPI at different cooling profiles and different stirring rates for 1 h.

                           Fig. 7. Parity plot between the calculated ice mass and measured ice mass after 1 h of freeze concentration.

                                                                                 6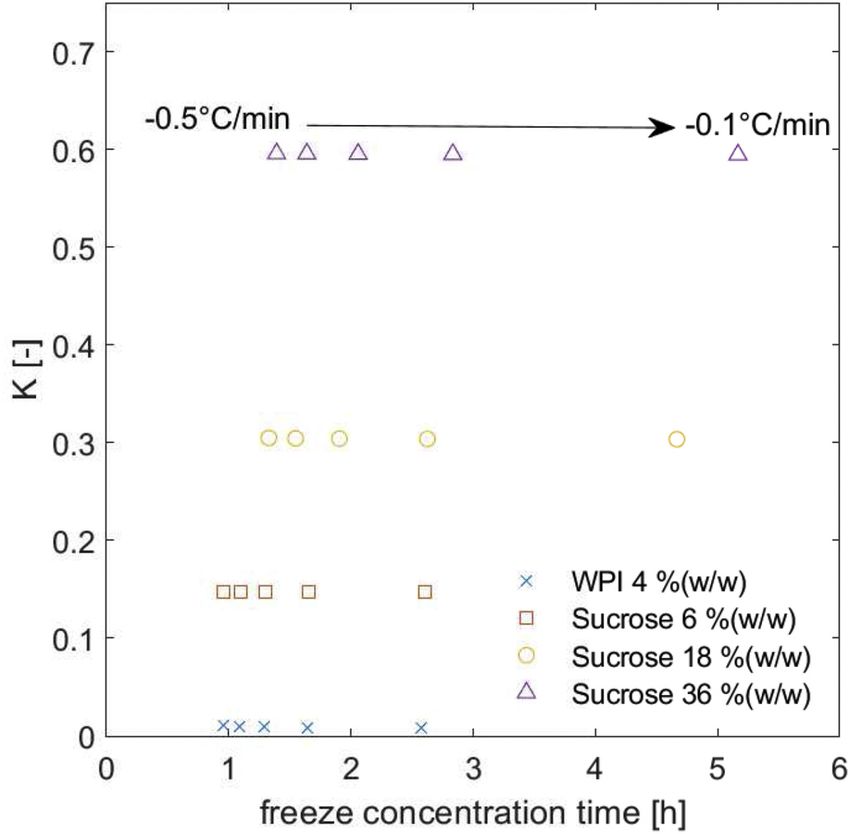
J.E. Vuist et al. Journal of Food Engineering 303 (2021) 110592
Fig. 8. Parity plot between calculated distribution coefficients and measured distribution coefficients after 1 h of freeze concentration.
solution to yield the same ΔT considering the freezing point depression,
the initial temperature could not be adjusted. This causes an initial delay
in ice growth and therefore the cooling profile already had progressed to
a lower temperature (Fig. 6). This leads to more supercooling near the
cold wall resulting in the formation of ice dendrites.
A large difference in inclusion can be noticed between soy protein
and whey protein solutions (Fig. 8). Soy protein leads to much inclusion
while whey protein gives very low to almost no inclusion. The main
difference between the two solutions is the solubility of the proteins
(Shen, 1976; Elgedaily et al., 1982). Whey protein isolate contains
highly soluble globular proteins (Sánchez et al., 2011). In contrast, SPC
consists for a large part of insoluble particles. Compared to soluble
proteins, the diffusion rate of particles is negligible, and therefore these
particles will be included in the ice. For SPC, this is almost 80% of all
proteins. WPI is so well soluble, and can diffuse from the ice freezing
front into the bulk solution.
4.3. Outlook to future application of the model and optimization of the
process
Even though there are some deviations from the experiments, the
model is sufficiently accurate for exploring untested conditions and for
optimizing the process. One case of interest would be to optimise the
process to reach a certain ice layer thickness, instead of comparing
cooling strategies with a fixed end time. This would involve the com
parison of the inclusion behaviour between the different cooling rates, Fig. 9. Simulation results of freeze concentration for varying cooling rates
towards the same amount of ice generated. Fig. 9 shows the results for a ending at a fixed ice layer thickness (2.25 cm). The effective distribution co
efficient as function of time to freeze concentrate till the set ice thickness.
WPI solution at an initial solid content of 4% (w/w) and for sucrose
solutions at 6, 18, and 36% (w/w) solid content. Most remarkable is that
the level of inclusions is almost constant between the lowest cooling rate there is a steep initial ice growth followed by a constant freezing rate
(− 0.1 ◦ C per minute) and the highest cooling rate (− 0.5 ◦ C per minute). Fig. 10a. This initial growth is reflected in the effective partition coef
This indicates that while there is a higher inclusion rate at higher cooling ficient (Fig. 10b), which starts at a high value; then levels off and then
rates, the averaged level of inclusions per kg of formed ice is nearly continues to decrease slowly due to the increasing concentration in the
constant, While the ice growth rates are ≈ 1 μm/s and 5 μm/s respec bulk fluid (Fig. 10c), which increases faster than the increase in con
tively. This means that only the mass transfer near the ice boundary is of centration in the ice (Fig. 10d).
influence on the efficiency of progressive freeze concentration (Liu et al., An optimum in solute inclusion is shown in Fig. 10d after around
1997; Vuist et al., 2020). Within the range of the ice growth rate, the 10% of the end time. This could be chosen as an end point for the process
distribution coefficient is only weekly dependent on the ice growth rate. when optimizing for the lowest possible level of solute inclusion. The
The value of K varies from 0.2903 to 0.2935 for a range of ice growth minimum effective distribution coefficient is lower at lower ice growth
rates between 0 and 10 μm/s. rates and could be lowered even further, for example by improving the
The model can be used to evaluate the evolution of ice yield and mass transfer rate. However, in practice, the end point can be chosen to
solute inclusion in time for different process conditions. In Fig. 10 the be later to allow for a thicker ice layer since the increase of concentra
simulation results for 18% (w/w) sucrose are presented. As expected tion in the ice, and therefore the solute loss, is not steep after this point.
7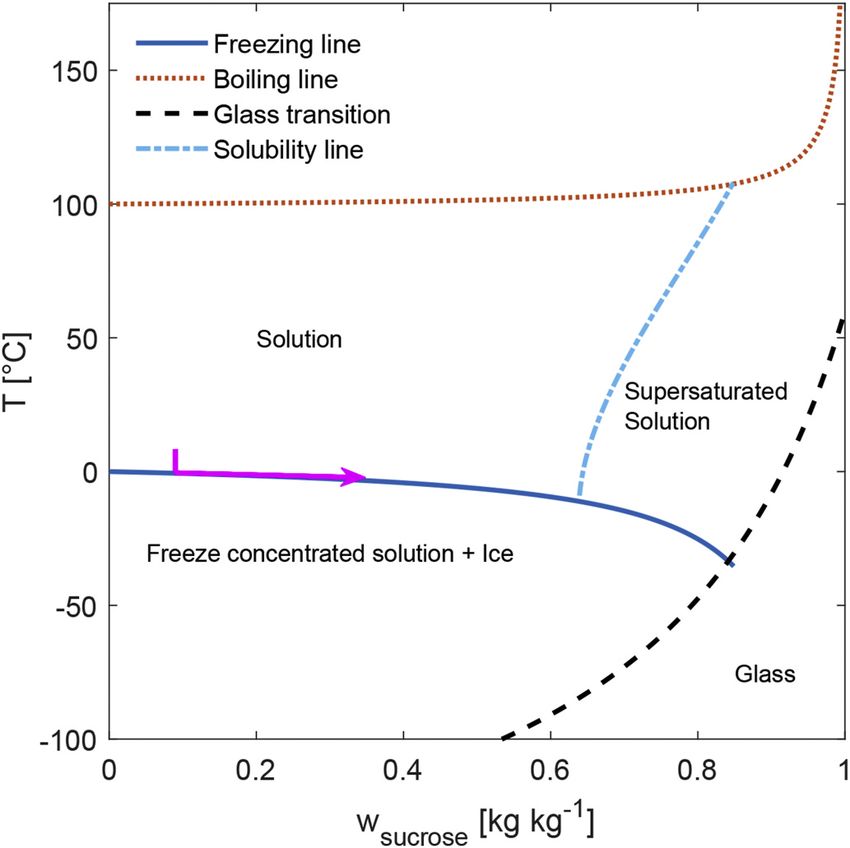
J.E. Vuist et al. Journal of Food Engineering 303 (2021) 110592
Fig. 10. Concentration of 18% (w/w) sucrose at two cooling rates, calculated.
This thicker ice layer would allow for a more productive unit. These evaluated at similar amounts of ice produced. The model did indicate a
results also show that the cooling surface to volume ratio should be as minimum in the level of inclusions, which may be used in the design of
high as possible to achieve a high concentration factor in a single step. the process towards optimal concentration.
5. Conclusion Credit author contribution statement
Progressive freeze concentration was studied using a lab-scale pro Jan Eise Vuist: Conceptualization of this study, Methodology, Formal
gressive freeze concentrator. A model based on an energy and mass analysis, Writing - Original draft preparation. Rikke Linssen: Method
balance was created, using an effective distribution coefficient for solute ology, Investigation. Remko M. Boom: Writing - Original draft prepa
inclusion. The intrinsic distribution coefficient for sucrose solutions ration, Supervision. Maarten A.I. Schutyser: Conceptualization, Writing
depends on the initial sucrose concentration and on the critical (satu - Original draft preparation, Funding acquisition.
ration) concentration, which is probably related to the fast increase in
viscosity and reduction in diffusivity when a sucrose solution gets closer Acknowledgements
to the glass transition. Solutions of proteins behave differently, since
their freezing line is flatter, and their solutions in the concentration This work is an Institute for Sustainable Process Technology (ISPT)
polarisation layer do not come near their glass transition line. Whey project. Partners in this project are TNO, Royal Cosun, Nouryon,
protein isolate, which is well soluble, gives very low inclusions; but soy Wageningen University and ISPT. This project is co-funded with subsidy
protein isolate, which mostly consists of small insoluble protein particles from the Topsector Energy by the Ministry of Economic Affairs and
gives very large levels of inclusions, up to 80%. The freezing rate has Climate Policy.
little influence on the achieved effective distribution coefficient, when
8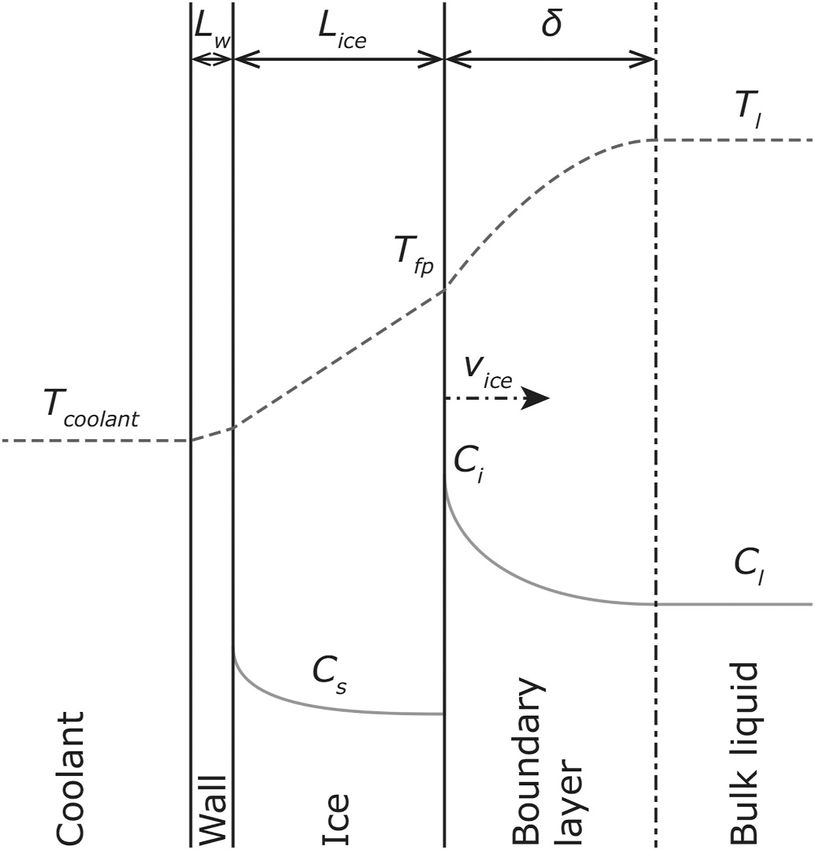
J.E. Vuist et al.                                                                                                                             Journal of Food Engineering 303 (2021) 110592

Nomenclature

ΔHfus         Heat of fusion [kJ kg− 1]
δ             Thickness of the boundary layer [m]
μ             Dynamic viscosity [Pa s]
ρice          Density of ice [kg m− 3]
R             Universal gas constant [J K− 1 mol− 1]
Afp           Area cooling plate [m2]
Cl            Concentration of solute in solution [kg kg− 1]
Cs            Concentration of solute in ice [kg kg− 1]
Ccritical     Critical concentration for freeze concentration [kg kg− 1]
Ci            Concentration of solute at the ice boundary [kg kg− 1]
D             Diffusion coefficient [m2 s− 1]
d             Diameter freeze cell [m]
h             Heat transfer coefficient (liquid boundary layer) [W m− 1 K− 1]
                                                                                              1
hov,i         Heat transfer coefficient (overall, ice + heat exchanger) [W m−                     K− 1]
K             Average distribution coefficient [− ]
k             Mass transfer coefficient [m s− 1]
K0            Intrinsic distribution coefficient [− ]
L             Specific length [m]
Lice          Thickness of ice [m]
Lw            Thickness of the wall [m]
Mice          Mass of ice [kg]
N             Stirring rate [s− 1]
NRe           Reynold’s number [− ]
NSc           Schmidt’s number [− ]
NSh           Sherwood’s number [− ]
q             Specific heat flow [W m− 2]
qfp           Heat transfer from the bulk fluid [W m− 2]
qice          Heat transfer through ice layer [W m− 2]
t             Time [s]
Tg            Glass transition temperature [◦ C]
Tl            Temperature of the liquid [◦ C]
Tm            Melting temperature [◦ C]
Tcoolant      Temperature of the coolant [◦ C]
Tfp,0         Temperature of the freezing point of pure water [◦ C]
Tfp           Temperature of the freezing point [◦ C]
vice          Velocity of the boundary [m s− 1]
x             Distance from boundary layer [m]
xs            Mole fraction of solute [− ]

References                                                                                        Dormand, J., Prince, P., 1980. A family of embedded Runge-Kutta formulae. J. Comput.
                                                                                                       Appl. Math. 6, 19–26. https://www.sciencedirect.com/science/article/pii/0771050
                                                                                                       X80900133. doi:10.1016/0771-050X(80)90013-3.
Auleda, J., Raventós, M., Hernández, E., 2011. Calculation method for designing a multi-
                                                                                                  Elgedaily, A., Campbell, A.M., Penfield, M.P., 1982. Solubility and water absorption of
    plate freeze-concentrator for concentration of fruit juices. J. Food Eng. 107, 27–35
                                                                                                       systems containing soy protein isolates, salt and sugar. J. Food Sci. 47, 806–809.
    doi:10.1016/J.JFOODENG.2011.06.006. https://www.sciencedirect.com/science/
                                                                                                       https://doi.org/10.1111/j.1365-2621.1982.tb12719.x doi:10.1111/j.1365-
    article/pii/S0260877411003074.
                                                                                                       2621.1982.tb12719.x.
Berk, Z., 2009. Freeze drying (lyophilization) and freeze concentration. Food Process
                                                                                                  Flesland, O., 1995. Freeze concentration by layer crystallization. Dry. Technol. 13,
    Engineering and Technology. Elsevier, pp. 929–945. https://doi.org/10.1016/B978-
                                                                                                       1713–1739. http://www.scopus.com/inward/record.url?eid=2-s2.0-0001420
    0-12-415923-5.00023-X. http://linkinghub.elsevier.com/retrieve/pii/B9780081005
                                                                                                       333&partnerID=tZOtx3y1. doi:10.1080/07373939508917048.
    224000237.
                                                                                                  Gu, X., Suzuki, T., Miyawaki, O., 2006. Limiting partition coefficient in progressive
Bonales, L.J., Rodriguez, A.C., Sanz, P.D., 2017. Thermal conductivity of ice prepared
                                                                                                       freeze-concentration. J. Food Sci. 70, E546–E551. https://doi.org/10.1111/j.1365-
    under different conditions. Int. J. Food Prop. 20, 610–619. https://doi.org/10.1080/
                                                                                                       2621.2005.tb08317.x doi:10.1111/j.1365-2621.2005.tb08317.x.
    10942912.2017.1306551 doi:10.1080/10942912.2017.1306551.
                                                                                                  Gunathilake, M., Shimmura, K., Miyawaki, O., 2013. Analysis of solute distribution in ice
Burton, J.A., Kolb, E.D., Slichter, W.P., Struthers, J.D., 1953a. Distribution of solute in
                                                                                                       formed in progressive freeze-concentration. Food Sci. Technol. Res. 19, 369–374.
    crystals grown from the melt. Part II. Experimental. J. Chem. Phys. 21, 1991–1996.
                                                                                                       https://doi.org/10.3136/fstr.19.369 doi:10.3136/fstr.19.369.
    http://aip.scitation.org/doi/10.1063/1.1698729. doi:10.1063/1.1698729.
                                                                                                  Halde, R., 1980. Concentration of impurities by progressive freezing. Water Res. 14,
Burton, J.A., Prim, R.C., Slichter, W.P., 1953b. The distribution of solute in crystals
                                                                                                       575–580. https://www.sciencedirect.com/science/article/pii/0043135480901153
    grown from the melt. Part I. Theoretical. J. Chem. Phys. 21, 1987–1991. http://aip.
                                                                                                       https://linkinghub.elsevier.com/retrieve/pii/0043135480901153. doi:10.1016/
    scitation.org/doi/10.1063/1.1698728. doi:10.1063/1.1698728.
                                                                                                       0043-1354(80)90115-3.
Chen, P., Chen, X.D., 2000. A generalized correlation of solute inclusion in ice formed
                                                                                                  Kadi, K.E., Janajreh, I., 2017. Desalination by freeze crystallization: an overview. Int. J.
    from aqueous solutions and food liquids on sub-cooled surface. Can. J. Chem. Eng.
                                                                                                       of Thermal & Environmental Engineering 15, 103–110. http://iasks.org/w
    78, 312–319. https://doi.org/10.1002/cjce.5450780205 http://doi.wiley.com/
                                                                                                       p-content/uploads/pdf/IJTEE-1502004.pdf. doi:10.5383/ijtee.15.02.004.
    10.1002/cjce.5450780205.
                                                                                                  Kauzmann, W., 1948. The nature of the glassy state and the behavior of liquids at low
Chen, X.D., Wu, W.D., Chen, P., 2015. An analytical relationship of concentration-
                                                                                                       temperatures. Chem. Rev. 43, 219–256. https://pubs.acs.org/doi/abs/10.1021/cr
    dependent interfacial solute distribution coefficient for aqueous layer freeze
                                                                                                       60135a002. doi:10.1021/cr60135a002.
    concentration. AIChE J. 61, 1334–1344. https://doi.org/10.1002/aic.14722 http://
    doi.wiley.com/10.1002/aic.14722, doi:10.1002/aic.14722.

                                                                                              9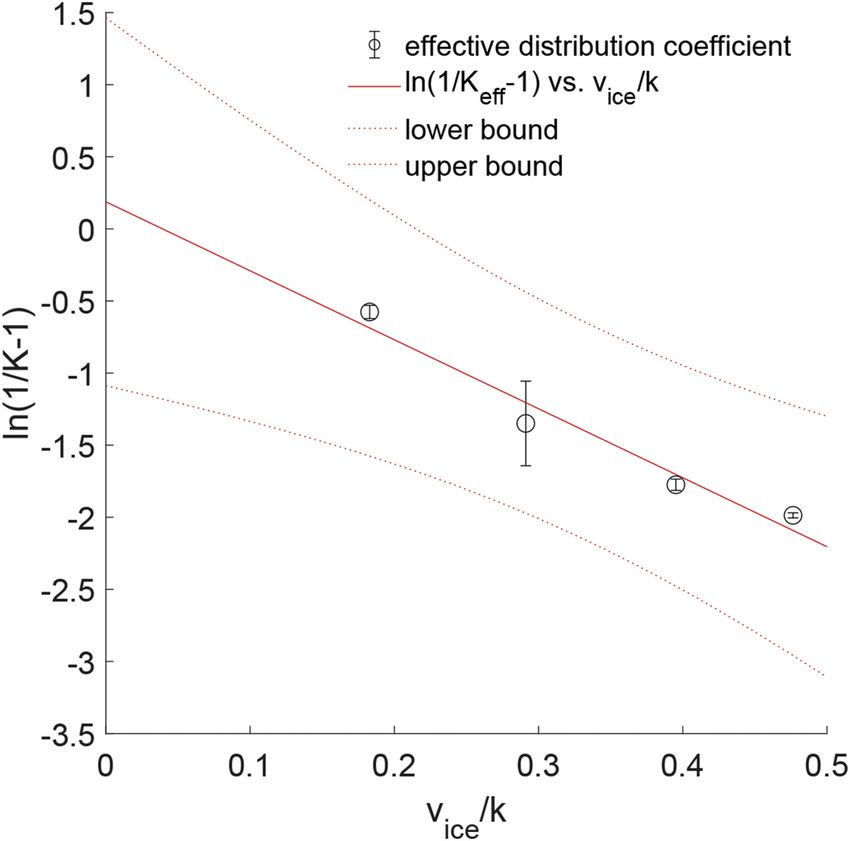
J.E. Vuist et al.                                                                                                                                Journal of Food Engineering 303 (2021) 110592

Kestin, J., Sengers, J.V., Kamgar-Parsi, B., Sengers, J.M.H.L., 1984. Thermophysical                     nghub.elsevier.com/retrieve/pii/S0260877406001932. doi:10.1016/j.
     properties of fluid H2O. J. Phys. Chem. Ref. Data 13, 175–183. https://doi.org/                     jfoodeng.2006.02.017.
     10.1063/1.555707 doi:10.1063/1.555707.                                                         Roos, Y., Karel, M., 1991a. Amorphous state and delayed ice formation in sucrose
Liu, L., Miyawaki, O., Nakamura, K., 1997. Progressive freeze-concentration of model                     solutions. Int. J. Food Sci. Technol. 26, 553–566. https://doi.org/10.1111/j.1365-
     liquid food. Food Science and Technology International, Tokyo 3, 348–352. http://                   2621.1991.tb02001.x http://doi.wiley.com/10.1111/j.1365-2621.1991.tb02001.x.
     joi.jlc.jst.go.jp/JST.JSTAGE/fsti9596t9798/3.348?from=CrossRef. https://www.                   Roos, Y., Karel, M., 1991b. Phase transitions of amorphous sucrose and frozen sucrose
     jstage.jst.go.jp/article/fsti9596t9798/3/4/3{_}4{_}348/{_}pdf, doi:10.3136/                         solutions. J. Food Sci. 56, 266–267. https://doi.org/10.1111/j.1365-2621.1991.
     fsti9596t9798.3.348.                                                                                tb08029.x http://doi.wiley.com/10.1111/j.1365-2621.1991.tb08029.x.
Meiwa Co. Ltd, 2018. Meiwa co., Ltd. https://www.meiwa-ind.co.jp/en/products/pr                     Roos, Y.H., 2010. Glass transition temperature and its relevance in food processing.
     oduct-06/.                                                                                          Annual Review of Food Science and Technology 1, 469–496. https://doi.org/
Miyawaki, O., Liu, L., Nakamura, K., 1998. Effective partition constant of solute between                10.1146/annurev.food.102308.124139 http://www.annualreviews.org/doi/
     ice and liquid phases in progressive freeze-concentration. J. Food Sci. 63, 756–758.                10.1146/annurev.food.102308.124139, doi:10.1146/annurev.food.102308.124139.
     https://doi.org/10.1111/j.1365-2621.1998.tb17893.x http://doi.wiley.com/                       Sánchez, J., Hernández, E., Auleda, J., Raventós, M., 2011. Freeze concentration of whey
     10.1111/j.1365-2621.1998.tb17893.x.                                                                 in a falling-film based pilot plant: process and characterization. J. Food Eng. 103,
Miyawaki, O., Liu, L., Shirai, Y., Sakashita, S., Kagitani, K., 2005. Tubular ice system for             147–155. https://www.sciencedirect.com/science/article/pii/S026087741000497
     scale-up of progressive freeze-concentration. J. Food Eng. 69, 107–113. http://linki                8. doi:10.1016/J.JFOODENG.2010.10.009.
     nghub.elsevier.com/retrieve/pii/S0260877404003528. doi:10.1016/j.                              Scholz, R., 1993. Die Schichtkristallisation Als Thermisches Trennverfahren. Ph.D. thesis.
     jfoodeng.2004.07.016.                                                                               Universitat Bremen, Dusseldorf.
Moreno, F., Raventós, M., Hernández, E., Ruiz, Y., 2014. Block freeze-concentration of            Scholz, R., Wangnick, K., Ulrich, J., 1993. On the distribution and movement of
     coffee extract: effect of freezing and thawing stages on solute recovery and bioactive              impurities in crystalline layers in melt crystallization processes. J. Phys. Appl. Phys.
     compounds. J. Food Eng. 120, 158–166. https://www.sciencedirect.com/science/                        26, B156–B161. http://stacks.iop.org/0022-3727/26/i=8B/a=025?key=crossref.
     article/pii/S0260877413004007. doi:10.1016/J.JFOODENG.2013.07.034.                                  a6f8fe8e0a886fd757698c1f69f83ab4. doi:10.1088/0022-3727/26/8B/025.
Myerson, A.S., Erdemir, D., Lee, A., 2019. Handbook of Industrial Crystallization, third            Shampine, L.F., Reichelt, M.W., 1997. The MATLAB ODE suite. SIAM J. Sci. Comput. 18,
     ed. ed. Cambridge University Press, Cambridge https://www.cambridge.org/cor                         1–22. https://doi.org/10.1137/S1064827594276424 doi:10.1137/
     e/product/identifier/9781139026949/type/book. https://doi.org/10.1017/                              S1064827594276424.
     9781139026949 http://public.ebookcentral.proquest.com/choice/publicfullrecord.                 Shen, J.L., 1976. Solubility profile, intrinsic viscosity, and optical rotation studies of acid
     aspx?p=5928442, doi:10.1017/9781139026949.                                                          precipitated soy protein and of commercial soy isolate. J. Agric. Food Chem. 24,
Ojeda, A., Moreno, F.L., Ruiz, R.Y., Blanco, M., Raventós, M., Hernández, E., 2017. Effect             784–788. https://doi.org/10.1021/jf60206a044 doi:10.1021/jf60206a044.
     of process parameters on the progressive freeze concentration of sucrose solutions.            van der Sman, R., 2016. Phase field simulations of ice crystal growth in sugar solutions.
     Chem. Eng. Commun. 204, 951–956. https://doi.org/10.1080/                                           Int. J. Heat Mass Tran. 95, 153–161 doi:10.1016/J.
     00986445.2017.1328413 doi:10.1080/00986445.2017.1328413.                                            IJHEATMASSTRANSFER.2015.11.089 https://www.sciencedirect.com/science/
Petzold, G., Moreno, J., Lastra, P., Rojas, K., Orellana, P., 2015. Block freeze                         article/pii/S0017931015300442?via{%}3Dihub{#}b0105.
     concentration assisted by centrifugation applied to blueberry and pineapple juices,            van der Sman, R.G.M., 2017. Predicting the solubility of mixtures of sugars and their
     30. Innovative Food Science & Emerging Technologies, pp. 192–197. https://www.                      replacers using the Flory-Huggins theory. Food & Function 8, 360–371. https://doi.
     sciencedirect.com/science/article/pii/S1466856415000569. doi:10.1016/J.                             org/10.1039/C6FO01497F doi:10.1039/C6FO01497F.
     IFSET.2015.03.007.                                                                             van der Sman, R.G.M., Mauer, L.J., 2019. Starch gelatinization temperature in sugar and
Pradistsuwana, C., Theprugsa, P., Miyawaki, O., 2003. Measurement of limiting partition                  polyol solutions explained by hydrogen bond density. Food Hydrocolloids 94,
     coefficient in progressive freeze-concentration. Food Sci. Technol. Res. 9, 190–192.                371–380. http://www.sciencedirect.com/science/article/pii/S0268005X19303194.
     http://joi.jlc.jst.go.jp/JST.JSTAGE/fstr/9.190?from=CrossRef. doi:10.3136/                          doi:https://doi.org/10.1016/j.foodhyd.2019.03.034.
     fstr.9.190.                                                                                    Vuist, J.E., Boom, R.M., Schutyser, M.A.I., 2020. Solute inclusion and freezing rate
Rane, M.V., Jabade, S.K., 2005. Freeze concentration of sugarcane juice in a jaggery                     during progressive freeze concentration of sucrose and maltodextrin solutions. Dry.
     making process. Appl. Therm. Eng. 25, 2122–2137. https://www.sciencedirect.com/                     Technol. 1–9. https://www.tandfonline.com/doi/full/10.1080/07373937.2020.17
     science/article/pii/S1359431105000608. doi:10.1016/J.                                               42151. doi:10.1080/07373937.2020.1742151.
     APPLTHERMALENG.2005.01.014.                                                                    Williams, M.L., Landel, R.F., Ferry, J.D., 1955. The temperature dependence of
Ratkje, S.K., Flesland, O., 1995. Modelling the freeze concentration process by                          relaxation mechanisms in amorphous polymers and other glass-forming liquids.
     irreversible thermodynamics. J. Food Eng. 25, 553–568 doi:10.1016/0260-8774(94)                     J. Am. Chem. Soc. 77, 3701–3707. https://doi.org/10.1021/ja01619a008 doi:
     00034-7.                                                                                            10.1021/ja01619a008.
Raventós, M., Hernández, E., Auleda, J., Ibarz, A., 2007. Concentration of aqueous sugar
     solutions in a multi-plate cryoconcentrator. J. Food Eng. 79, 577–585. http://linki

                                                                                               10
You can also read