Inuence of Natural Climate Variability on Extreme Wave Power over Indo-Pacic Ocean Assessed using ERA5
←
→
Page content transcription
If your browser does not render page correctly, please read the page content below
In uence of Natural Climate Variability on Extreme Wave Power over Indo-Paci c Ocean Assessed using ERA5 Prashant Kumar ( prashantkumar@nitdelhi.ac.in ) National Institute of Technology, Delhi https://orcid.org/0000-0001-8480-7490 Sukhwinder Kaur National Institute of Technology Delhi Evan Weller University of Auckland Ian R. Young University of Melbourne Research Article Keywords: Wave power energy, Climate Variability, Generalized extreme value(GEV)distribution, Indo- Paci c Ocean Posted Date: April 7th, 2021 DOI: https://doi.org/10.21203/rs.3.rs-372607/v1 License: This work is licensed under a Creative Commons Attribution 4.0 International License. Read Full License
1 Influence of Natural Climate Variability on Extreme Wave Power over Indo-Pacific Ocean
2 Assessed using ERA5

3 Sukhwinder Kaur1, Prashant Kumar1, Evan Weller 2, Ian R. Young3
 1
4 Department of Applied Sciences, National Institute of Technology Delhi, Delhi, India
 2
5 School of Environment, University of Auckland, Auckland, New Zealand
 3
6 Department of Infrastructure Engineering, University of Melbourne, Australia.

7

8

9

10 Version: 09-03-2021

11

12

13

14

15

16

17

18

19

20

21

22 *Corresponding Author

23 Email: prashantkumar@nitdelhi.ac.in

24

25

 1
26 Abstract

27 In recent decades, wave power (WP) energy from the ocean is one of the cleanest renewable

28 energy sources associated with oceanic warming. In Indo-Pacific Ocean, the WP is significantly

29 influenced by natural climate variabilities, such as El Niño Southern Oscillation (ENSO), Indian

30 Ocean Dipole (IOD) and Pacific Decadal Oscillation (PDO). In this study, the impact of major

31 climate variability modes on seasonal extreme WP is examined over the period 1979–2019 using

32 ERA5 reanalysis data and the non-stationary generalized extreme value analysis is applied to

33 estimate the climatic extremes. Independent ENSO influence after removing the IOD trends

34 (ENSO|IOD) on WP are evident over the eastern and central Pacific during December–February

35 (DJF) and March–May (MAM), respectively, which subsequently shifts towards the western

36 Pacific in June–August (JJA) and September–November (SON). The ENSO|PDO impact on WP

37 exhibits similar yet weaker intensity year round compared to ENSO. Extreme WP responses due

38 to the IOD|ENSO include widespread decreases over the tropical and eastern Indian Ocean (IO),

39 with localized increases only over the South China and Philippine (SCP) seas and Bay of Bengal

40 (BOB) during JJA, and the Arabian Sea during SON. Lastly, for the PDO|ENSO, the significant

41 increases in WP are mostly confined to the Pacific, and most prominent in the North Pacific.

42 Composite analysis of different phase combinations of PDO (IOD) with El Niño (La Niña)

43 reveals stronger (weaker) influences year-round. The response patterns in significant wave height

44 (SWH), peak wave period (PWP), sea surface temperatures (SST), and sea level pressure (SLP)

45 helps to explain the seasonal variations in WP.

46

47 Keywords: Wave power energy, Climate Variability, Generalized extreme

48 value(GEV)distribution, Indo-Pacific Ocean,

49
 2
50 1. Introduction

51 The depletion of conventional energy resources and increasing global warming due to the

52 consumption of fossil fuels have prompted interest in renewable energy resources in many

53 countries (Cornett 2008). Among the various renewable energy resources such as wind, solar,

54 hydro-power, etc., wave power is one of the most important and least studied renewable energy

55 resources. Recent studies suggest that the spatial and temporal variations in wave power are

56 induced by natural climate variabilities like El Niño–Southern Oscillation (ENSO), Pacific

57 Decadal Oscillation (PDO), and Atlantic Multidecadal Oscillation (AMO) (Bromirski and Cayan

58 2015; Bromirski et al. 2013; Reguero et al. 2019; Yang and Oh 2020). Therefore, a better

59 comprehension of the wave power and its relation with natural climate variability is essential for

60 social and economic development.

61 WP, which measures the transport of energy that is transmitted by air-to-sea exchanges and used

62 for wave motion (Donelan et al. 1997; Reguero et al. 2019), depends not only on wave height but

63 also on wave period. Moreover, WP represents the accumulated wave energy over periods of

64 time such as months, seasons, and years, unlike other wave climate parameters (e.g., SWH) that

65 must be averaged (Reguero et al. 2019). Therefore, WP can represent the variations in the wave

66 climate better than other wave parameters (e.g., wave height). Yet, to date, continuous efforts

67 have been made to analyze the mean and extreme historical trends in wind and wave climate at

68 the global (Aarnes et al. 2015; Caires et al. 2006; Fan et al. 2012; Gulev and Grigorieva 2004;

69 Meucci et al. 2020; Reguero et al. 2012; Stopa et al. 2013; Young et al. 2011, 2012; Young and

70 Ribal 2019) and regional scale (Allan and Komar 2006; Carter and Draper 1988; Gulev and

71 Grigorieva 2006; Hemer et al. 2008, 2010; Menendez et al. 2008; Wang and Swail 2001, 2006;

72 Wang et al. 2009, 20012; Young 1999; Young and Ribal 2019). In addition, other wave climate

 3
73 indicators, such as wave period and/or direction, have also been investigated extensively to

74 identify underlying properties in the changes to mean and extreme SWH (Chen et al. 2002;

75 Semedo et al. 2011; Sterl and Caires 2005; Young 1999; Zhang et al. 2011; Zheng et al. 2016).

76 In context of WP, several studies have been carried out previously to analyze the monthly and

77 annual variations in mean wave power at the global scale (Arinaga and Cheung 2012; Barstow et

78 al. 2008; Cornett 2008; Gunn and Stock-Williams 2012; Hulls 1977; Mollison 1986; Mork et al.

79 2010). Further, the seasonal variations in mean wave power were examined by Mackay (2012).

80 However, these analyses were conducted based on either satellite data or wave models such as

81 Wave Watch-III (WW3) and ECMWF WAM for relatively short periods of 6 or 10 or 12 years.

82 Long term seasonal and interannual variations in global mean wave power were investigated by

83 Reguero et al (2015) using WW3 data for a 61–year period (1948–2008). In this regard,

84 numerous regional studies have also been conducted. For example, the North Pacific (NP)

85 (Bromirski et al. 2005, 2013; Yang and Oh 2020), North Atlantic (NA) (Bromirski and Kossin

86 2008; Bromirski and Cayan 2015; Santo et al. 2015), Black Sea (Aydogan et al. 2013), along the

87 Australian coasts (Hemer et al. 2016, 2018), and shelf seas of India (Kumar and Anoop 2015;

88 Sannasiraj and Sundar, 2016; Amrutha et al. 2019; Amrutha and Kumar 2020). However,

89 seasonal/annual variations in extreme WP have not been assessed yet at the global and regional

90 scale.

91 Although many studies have focused on seasonal/annual variations in mean WP as described

92 above, the natural climate variabilities such as the El Niño–Southern Oscillation (ENSO), Indian

93 Ocean Dipole (IOD), and Pacific Decadal Oscillation (PDO), etc. can exert a significant impact

94 on wave climate through large-scale atmospheric circulation patterns with different seasonal and

95 regional features (Hemer et al. 2010; Izaguirre et al. 2010, 2011; Kumar et al 2016, 2019;

 4
96 Marshall et al. 2018; Menéndez et al. 2008; Patra et al. 2020; Wandres et al. 2018; Yang and Oh

97 2018). However, influences due to such large-scale natural climate variability modes on WP

98 remains unclear, except for limited regional and global scale studies. For example, using the

99 WW3 wave model for the period 1948-2008, the PDO influence on WP across the NP region

100 was investigated by Bromirski et al. (2013) and NAO influence on WP across the NA region by

101 Bromirski and Cayan (2015) during winter (November–March) and summer (May–September).

102 Recently, Yang and Oh (2020) examined the effect of ENSO and PDO on WP during boreal

103 summer (June-August, JJA) in the western NP. At the global scale, Reguero et al. (2015)

104 analyzed the interrelation between the annual mean WP and fifteen climate variability modes

105 which include ENSO, IOD, and PDO. Recently, the ENSO and Atlantic Multidecadal Oscillation

106 (AMO) influence on annual mean WP have been reported by Reguero et al. (2019). Such studies

107 were predominantly concerned with the seasonal/annual impact of natural climate variability on

108 mean WP.

109 “Extreme” events are significant departures from the normal climate state and often have

110 widespread societal and ecological impacts. The changes in extreme and mean wave

111 characteristics have been reported to be of different nature (Feng et al. 2012; Mori et al. 2010),

112 and are observed to be linked with more frequent extreme events. So, it’s crucial to analyze the

113 influence of natural climate variability on extreme parameters, which exert stronger impacts than

114 mean. Further, the simple linear regression analysis is used for mean variables and cannot be

115 applied to extreme variables because of their non-normality nature (Coles 2001), and recent

116 studies have widely used the extreme value theory to investigate the impact of climate variability

117 on extreme parameters such as SWH, wind, wave period, etc. (Izaguirre et al. 2010, 2011;

118 Kharin and Zwiers 2005; Kumar et al 2016, 2019; Menéndez et al. 2008; Min et al. 2013; Patra

 5

119 et al. 2020; Zhang et al. 2010). But still, none of the previous studies assessed the impact of

120 natural climate variability on extreme WP.

121 This study investigates the seasonal influence of dominant modes of natural climate variability,

122 such as ENSO, IOD, and PDO on extreme WP in the Indo–Pacific Ocean using ERA5 reanalysis

123 data for the 41 year period from 1979–2019. For this purpose, firstly, the four boreal seasons

124 (i.e., December–February (DJF, winter), March–May (MAM, spring), June–August (JJA,

125 summer), and September–November (SON, autumn)) are considered to understand the seasonal

126 influence of natural climate variability on extreme WP and a non–stationary generalized extreme

127 value GEV analysis (Kharin and Zwiers 2005; Zhang et al. 2010; Min et al. 2013) is applied to

128 determine/capture the seasonal extremes. Regions with statistically significant responses at the

129 5% level are marked by hatching. In addition, the seasonal influence of natural climate

130 variability on extreme SWH and Peak Wave Period (PWP) is also investigated to explore the

131 associated underlying mechanisms in enhancing or reducing the WP in the Indo-Pacific Ocean as

132 WP comprises information about SWH and PWP. The seasonal teleconnection patterns of WP

133 and SWH are explained through/by SLP and SST.

134 As different modes of natural climate variability tend to interact with each other in specific

135 seasons (Cai et al. 2011; Kumar et al. 2016, 2019). Therefore, independent analysis of seasonal

136 mean and extreme WP, SWH, and PWP is carried out to assess the role of one variability mode

137 in strengthening and weakening the other variability mode influence in different seasons.

138 Additionally, the composite analysis of mean and extreme WP for the different phase

139 combinations of natural climate variabilities (i.e. ENSO, IOD, and PDO) is also conducted to get

140 further insight into the inter-relation between different variability modes. The novelty of the

141 current study in comparison to previous relevant studies is detailed in Table 1.

 6
142 The remainder of the paper is structured as follows. Data and methodology are detailed in section

143 2 and teleconnection patterns in section 3. Section 4 provides the detailed investigation of the

144 influence of natural climate modes (in particular the ENSO, IOD, and PDO) and their impendent

145 impact on seasonal mean and extreme WP, SWH, and PWP. Composite analysis for different

146 phase combinations of ENSO with IOD and ENSO with PDO is presented in section 5. Section 6

147 provides a summary and conclusions.

148 2. Data and Methodology

149 2.1. Data

150 The latest reanalysis product from the European Centre for Medium-Range Weather Forecasting

151 (ECMWF), referred to as the ERA5 reanalysis (Hersbach and Dee 2016), is used in the present

152 study to analyze the mean and extreme WP for the 41-year period from 1979 to 2019 over the

153 Indo–Pacific region for the four boreal seasons (i.e., December–February (DJF, winter), March–

154 May (MAM, spring), June–August (JJA, summer), and September–November (SON, autumn).

155 The ERA5 reanalysis data have several advancements compared to its predecessor, ERA-Interim

156 (Dee et al. 2011). In contrast to ERA-Interim, ERA5 has higher spatial and temporal resolution

157 along with an improved representation of the tropospheric processes, including better

158 representation of tropical cyclones, global balance of precipitation and evaporation cycle etc. In

159 order to measure the WP, the seasonal mean and maxima of SWH (of combined wind waves and

160 swell) and PWP are obtained from the six-hourly SWH and PWP data taken from ERA5.

161 Similarly, the seasonal mean SLP and SST were also derived from 6-hourly SLP and SST data of

162 ERA-5, respectively. In this study, the ERA5 reanalysis data for all the variables were

163 downloaded from the ECMWF website (https://www.ecmwf.int/en/forecasts/datasets/reanalysis-

 7

164 datasets/era5/) at a horizontal resolution of 0.5°×0.5° (i.e. SWH and PWP) or 0.25°×0.25° (i.e.,

165 SST and SLP).

166 2.2. Climate Indices

167 Indices used to represent climate variability associated with ENSO, IOD, and PDO over 1979–

168 2019 were obtained from several online sources. Overall, ENSO is the dominant coupled ocean–

169 atmosphere interaction occurring over the equatorial Pacific and significantly affects the

170 interannual climate variability globally (Collins et al. 2010; Stevenson 2012). In order to

171 examine the seasonal ENSO influence, the Niño-3.4 index (referred to as N34 herein) which

172 represents the average SST anomalies over the equatorial eastern Pacific (5°N–5°S, 170°W –

173 120°W) was obtained from the National Oceanic and Atmospheric Administration/Climate

174 Prediction Center http://www.cpc.ncep.noaa.gov/data/indices/). To quantify the IOD impact, the

175 dipole mode index (DMI) was used (Saji et al., 1999; Webster et al., 1999), which is a measure

176 of the difference between the area–averaged SST anomalies in the western tropical Indian Ocean

177 (TIO) (50°–70°E,10°S–10°N) and southeastern TIO (90°–110°E, 10°S–Equator). Monthly SST

178 anomalies acquired from the extended Reconstructed Sea Surface Temperature (ERSST) dataset

179 to calculate the seasonal DMI index. The PDO index, prescribed as the principal mode of NP

180 monthly SST anomalies poleward of 20°N (Zhang et al., 1997), was obtained from the Joint

181 Institute for the Study of the Atmosphere and Ocean (JISAO) at the University of Washington

182 (http://research.jisao.washington.edu/pdo/).

183 Natural climate variability modes can interact with each other during different seasons (Cai et al.,

184 2011). Consequently, the independent influence of each should be considered when assessing the

185 impact of each mode. The seasonal correlation coefficients between the detrended N34 and DMI,

 8
186 and N34 and PDO indices are shown in Table 2 for the period 1979–2019. A significant positive

187 correlation (at the 1% level) between the N34 and PDO index is found during all seasons, with a

188 range 0.397-0.545. For N34 and DMI indices, positive correlations only occur during JJA (i.e.

189 0.312, p-value
206 mn f n S ( f )df . (2) 0 207 The SWH ( ) and energy period ( ) are computed from the integral of the spectral density and 208 expressed in term of moment as follows: m1 209 H s 4 m0 and Te . (3) m0 210 For each harmonic component of the wave spectrum, its energy travels at the group velocity 211 defined by: 1 g 2kd cg ( f , d ) tanh(kd ) 1 212 2 k sinh(2kd ) , (4) 213 where d is the water depth, and k is the wave number which is related to the frequency f through 214 the dispersion relation (2 )2 = tanh( ). The total WP (also referred to as “wave energy 215 flux”), in watts per meter (W/m) of wave crest width at any water depth d is given as WP g cg ( f , d )S ( f )df 216 0 (5) 217 On substituting equation (4) into equation (5) and using the dispersion relation: g 2 S ( f ) 2k f d WP 1 4 0 f sinh(2k f d ) tanh(k f d ) df 218 . (6) 219 For large values of , the limits of sinh and tanh approaches to ∞ and 1, respectively. Thus, 220 equation (6) reduces to: 10
g2 S( f ) 4 0 f 221 WP df . (7) 222 Substituting equations (2) and (3) into equation (7), WP is expressed as: g 2 Te H s2 WP 223 4 16 . (8) 224 The energy period is estimated from the spectral shape and other parameters. When PWP (Tp) is 225 known, the energy period is estimated by using the following relation (Cornett, 2008): 226 Te Tp , (9) 227 where depends on the shape of the wave spectrum and increases towards unity with 228 decreasing spectral width. Hagerman (2001) assumed Te=Tp in the assessment of the wave 229 energy resources over southern New England. In this study, the same assumption is adopted. On 230 substituting Te=Tp into equation (8), WP is expressed as: g 2 Tp H s 2 231 WP . (10) 4 16 232 233 2.3.2. Generalized Extreme Value (GEV) Distribution 234 Climate extremes are significant departures from the normal climate state and often have 235 widespread societal and ecological impacts. Thus, the correct representation of extreme events is 236 essential to understand their impacts. Extreme value theory provides the statistical description of 237 extremes in stationary and non-stationary processes. However, in the context of environmental 11
238 variables (e.g., SWH, temperature, precipitation), a non-stationaryvariable is used (Coles and 239 Casson 1999; Gellens 2002; Nogaj et al. 2007; Kharin and Zwiers 2000, 2005), whereby extreme 240 events are defined by three extreme value distributions, i.e., Gumbel distribution, Fréchet 241 distribution, or Weibull distribution, arising from the limiting theorem of Fisher and Tippett 242 (1928). The three distributions can be combined into a single form, the non-stationary GEV 243 distribution, and its cumulative distribution function is given as: x t exp[ exp( )], t 0 F ( x, t , t , t ) t 244 , (11) exp[(1 x 1 x t ) ], t 0,1 t t t 0 t t t 245 where −∞ < < ∞, > 0, − ∞ < < ∞ represent the location, scale, and shape 246 parameters, respectively. For the non–stationary GEV distribution, the climate variability 247 (here, IOD, ENSO, and PDO indices, which are detrended and normalized) that varies with time 248 (t) is used as a covariate of the GEV parameters. The location parameter ( ) as a function of 249 climate variability is written as: 250 t 0 1 (vt v0 ) , (12) 251 where µ0 represents the location parameter at time 0 , and µ1 denotes the regression coefficient 252 representing the relationship between the climate variable and location parameter. Additionally, 253 the scale and shape parameters can also be expressed as a function of climate variability as 254 follows: 255 ln t ln 0 1 (vt v0 ) and t 0 1 (vt v0 ) , (13) 12
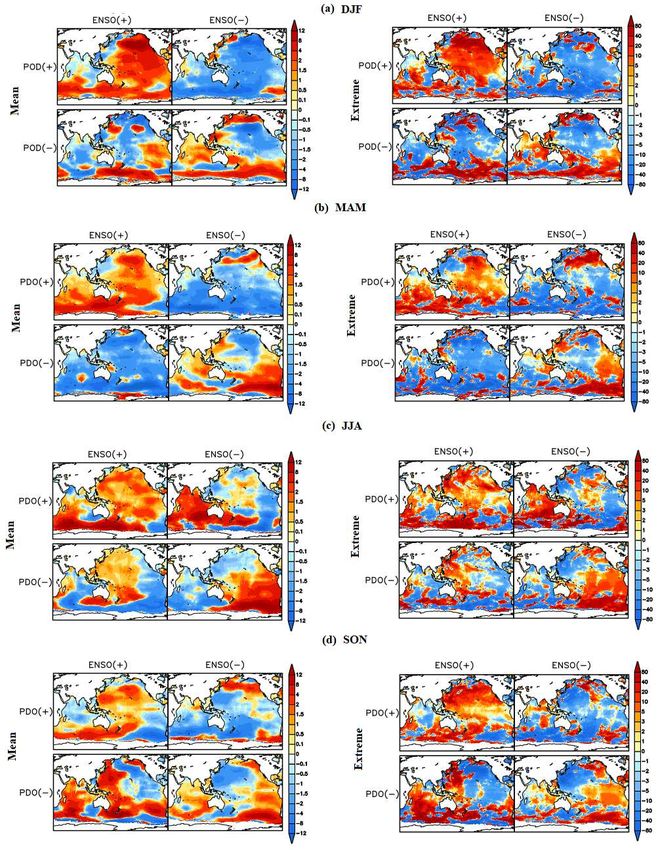
256 where σ0 and ξ0 are the scale and shape parameter values at time 0 , respectively, and σ1 and 1

257 are the corresponding regression coefficients. In order to examine the statistical significance of

258 climate variability on extremes, the log–likelihood ratio test is used. The log–likelihood test

259 compares the non–stationary GEV model with the stationary GEV model and assesses the GEV

260 parameters (Kharin and Zwiers 2005; Zhang et al. 2010).

261

262 3. SST and SLP mean Teleconnection

263 The patterns of seasonal mean SST and SLP regressed onto ENSO|IOD, IOD|ENSO, ENSO|PDO, and

264 PDO|ENSO over the period 1979–2019 are shown in Fig.1 and regions with statistically significant

265 responses at the 5% level are indicated by hatching. Significant canonical responses in SST to

266 ENSO|IOD are evident over the eastern PO (warmer conditions during El Niño) and western PO

267 (colder conditions) throughout the year. In the IO, the strongest signals in SST are found over the

268 majority of the NIO and TIO in DJF and MAM, NIO in JJA, and NIO and western TIO in SON

269 (Fig. 1a). Further, the ENSO|IOD influence on SLP shows high and low pressure anomalies in

270 eastern and western regions of the southern Indo–Pacific Ocean, respectively, during DJF. This

271 anomalous pressure pattern generates strong winds over the southern Indo-Pacific Ocean, leading

272 to an enhancement in both SWH and PWP in DJF (Fig. 1b). Similarly, the Southern Oscillation

273 pattern of the coupled high and low pressure anomalies is also seen in DJF over the western and

274 eastern PO, respectively. This too presumably leads to both strong winds and enhances the wave

275 parameters (i.e., SWH and PWP) over the eastern PO (Fig. 1b). With the progression of the

276 seasons from DJF through to SON, the high and low pressure anomalies shift from the western

277 PO and eastern PO to central-western PO and eastern PO, respectively, during JJA and SON.

 13
278 Additionally, high pressure anomalies are observed over the eastern parts of the SO, NIO, and

279 TIO, with low pressure anomalies over the central parts of the SO during MAM, JJA, and SON.

280 Such strong responses associated with SLP changes will also lead to strong responses in the

281 winds and wave parameters (Fig. 1b).

282 Significant impacts of IOD|ENSO on SST is predominantly confined to the western IO and AS in

283 DJF, which extend into parts of the tropical Pacific in MAM. During JJA and SON, the IOD|ENSO

284 is associated with positive SST anomalies over the western-to-central IO in JJA and SON (Fig.

285 1a). The corresponding responses in SLP during DJF show high pressure anomalies over most of

286 the tropical and mid-latitude region of the Indo–Pacific Ocean, and low pressure anomalies over

287 the AS and high-latitude region of the Indo–Pacific Ocean. In MAM, the IOD|ENSO influence is

288 most significant over the mid-to-high latitudes in both hemispheres. In JJA, high SLP anomalies

289 expand over the mid-latitudes of Indo-Pacific Ocean, from the eastern IO to central PO, and low

290 pressure anomalies strengthen and expand over the western IO. In SON, high SLP anomalies are

291 evident over the eastern IO and tropical PO, and develop over the eastern southern PO, whereas

292 the low pressure anomalies over the western IO are similar to JJA. Such high and low SLP

293 anomalies, with progressing seasonal patterns, will consequently produce strong winds and

294 consequently enhance the wave parameters in the respective regions (Fig. 1b).

295 The ENSO|PDO impact closely resembles that of ENSO|IOD whereby warmer SSTs are evident

296 over the eastern PO and colder SST over the western PO year around (c.f. first and third rows in

297 Fig 1a). In the IO, significant positive signals in SST due to ENSO|PDO are again evident over

298 large parts of the NIO and TIO in most seasons, being weakest in JJA (Fig. 1a). Further, the

299 ENSO|PDO influence on SLP is also consistent with that of ENSO|IOD whereby the significant

300 signals being associated with the widespread high and low pressure anomalies over the western

 14
301 and eastern Indo-Pacific Ocean, respectively (c.f. first and third rows in Fig. 1b). However, high

302 pressure anomalies are subdued in the western IO during SON for ENSO| PDO compared to that

303 associated with ENSO|IOD. Thus, the above changes of both ENSO|IOD and ENSO|PDO are likely

304 to generate the similar variations in the generated winds and wave fields in the respective

305 regions, except for the western IO.

306 The independent PDO influence (i.e., PDO|ENSO) on SST is observed to induce consistent year-

307 round pattern with long-term SST increases (warm SST) over the eastern PO (extending towards

308 the west along the equator) and decreases (cold SST) over the western NP and southwest tropical

309 PO (Fig. 1a). This represents the typical pattern associated with a positive PDO. In the IO, the

310 strong PDO|ENSO influences on SST occur over the AS in MAM, NIO and SCP seas in JJA, and

311 BOB and SCP seas in SON (Fig. 1a). The corresponding responses in SLP exhibit an anomalous

312 low pressure over the north and tropical Pacific and an anomalous high pressure over the eastern

313 TIO in DJF (Fig. 1b). In addition, anomalous high and low pressure centers are evident over the

314 south Pacific in DJF. In MAM, positive responses in SLP to the PDO|ENSO are observed over the

315 large section of the tropical and mid-latitude region of the Indo–Pacific Ocean, with counter

316 responses (low‐pressure anomalies) over high latitudes of the Indo-Pacific Ocean. In JJA, the

317 PDO|ENSO influence on SLP is most significant over the western Pacific Ocean (PO)

318 (high‐pressure anomalies) and eastern NP and Southern Ocean (SO) (low‐pressure anomalies).

319 These anomalies propagate into the western NP (high‐pressure anomalies) and central NP

320 (low‐pressure anomalies) in SON. In SON, high and low pressure anomalies are evident over the

321 SO.

322

323

 15
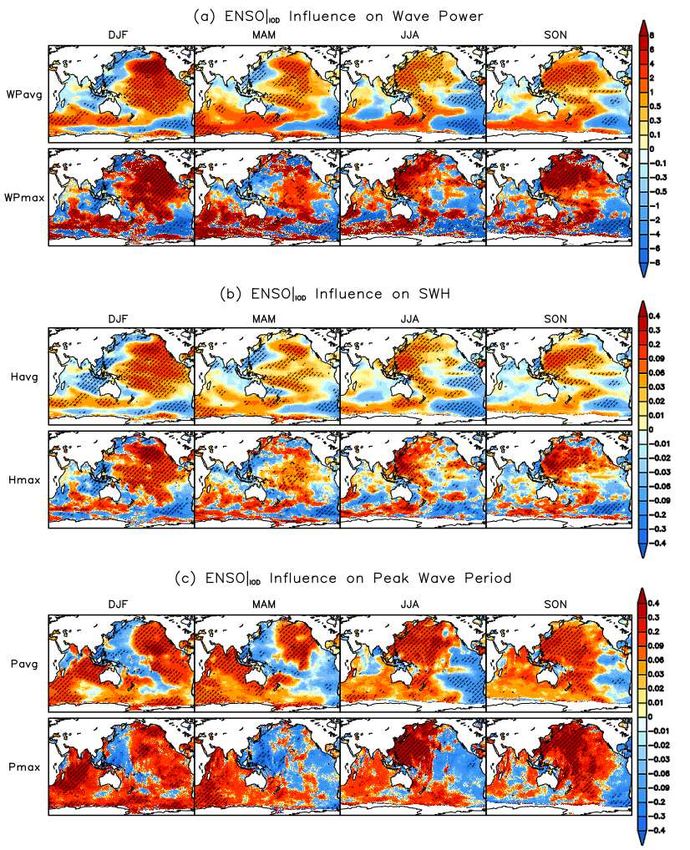
324 4. Influence of Indo-Pacific Climate Variability

325 4.1. ENSO Influence

326 Spatial patterns of the seasonal mean and extreme WP (WPavg and WPmax), SWH (Havg and

327 Hmax), and PWP (Pavg and Pmax) responses to independent ENSO|IOD influence (i.e. the

328 independent ENSO influence obtained after the removal of IOD signals) over the period 1979–

329 2019 in the Indo–Pacific Ocean are shown in Fig. 2. In addition, the original seasonal ENSO

330 influence (i.e., no removal of covarying IOD signals) on the mean and extreme WP, SWH, and

331 PWP is also provided in Supplementary Fig. 1 to assess the role of IOD in strengthening and

332 weakening the ENSO impact. Overall, mean responses in WPavg, Havg, and Pavg were acquired

333 by using linear regression whereas extreme responses in WPmax, Hmax, and Pmax were based

334 on the non-stationary GEV analysis. Regions with statistically significant responses at the 5%

335 level are indicated by hatching.

336 Widespread positive responses in WPmax to ENSO|IOD are evident over the eastern Pacific and

337 southern part of the IO (an extension from south of Australia) in DJF (Fig. 2a). As the seasons

338 progress from DJF through to SON, large seasonal variations in WP are observed in both the IO

339 and PO. In the PO, positive amplitudes of the WPmax occur more over the central Pacific in

340 MAM, which shift further towards the western Pacific in JJA and SON (Fig. 2a). The strong

341 increases in extreme WP in the western NP and BOB during JJA, and in the western NP during

342 SON, presumably arises from the enhanced tropical cyclone activities during that time of year

343 (Shanas and Kumar 2014; Yang and Oh 2020, 2018; Zhan et al. 2011). However, WPmax

344 exhibit larger seasonality in the IO compared to the PO. For example, the WP increases over the

345 western TIO in MAM, over the western TIO, BOB, SCP seas in JJA, and over the eastern TIO

 16
346 during SON in response to ENSO|IOD (Fig. 2a). The regression patterns of ENSO|IOD on mean

347 WP are similar to the extreme. Consistently, the ENSO|IOD influence on Havg and Hmax over the

348 Indo-Pacific Ocean (Fig. 2b) shows similar seasonal and regional variations as WPavg and

349 WPmax, due to SWH being a dominating factor in determining the WP (Bromirski et al. 2005,

350 2013; Reguero et al. 2019; Yang and Oh 2020). Lastly, the impact of ENSO|IOD on Pavg and

351 Pmax is found to be largest over the eastern PO in DJF and over the western PO in JJA and SON

352 (Fig 2c). Such regions exhibit a significant relationship, whereby changes to tropical SST

353 anomalies due to the warm ENSO phase resulted in variations in anomalous long PWP. In the IO

354 however, significant increases in Pavg and Pmax are observed over large parts of the IO year-

355 round due to ENSO|IOD, but more so in DJF and MAM (Fig. 2c).

356 Comparing independent ENSO influences (ENSO|IOD) to the original ENSO signals (c.f. Fig. 2

357 and Supplementary Fig. 1), it is found that WPavg is enhanced more over the eastern TIO in JJA

358 and SON, and over the central NP in SON for the independent ENSO influence. This indicates

359 that the IOD acts to reduce the ENSO impact in these regions during JJA and SON. In addition,

360 enhancement in the independent ENSO influence is also exhibited in the mean and extreme

361 SWH responses when the covarying IOD signal is removed during JJA and SON (c.f. Fig. 2b and

362 Supplementary Fig. 1b). However, positive responses in mean and extreme PWP associated with

363 ENSO in the IO are significantly reduced during SON when the covarying IOD signal is

364 removed (c.f. Fig 2c and Supplementary Fig. 1c). In DJF and MAM, the ENSO|IOD impact on

365 mean and extreme WP, SWH, and PWP exhibits similar regional variations as observed for the

366 complete ENSO signals as the IOD is not active during these seasons.

367 4.2. IOD Influence

 17
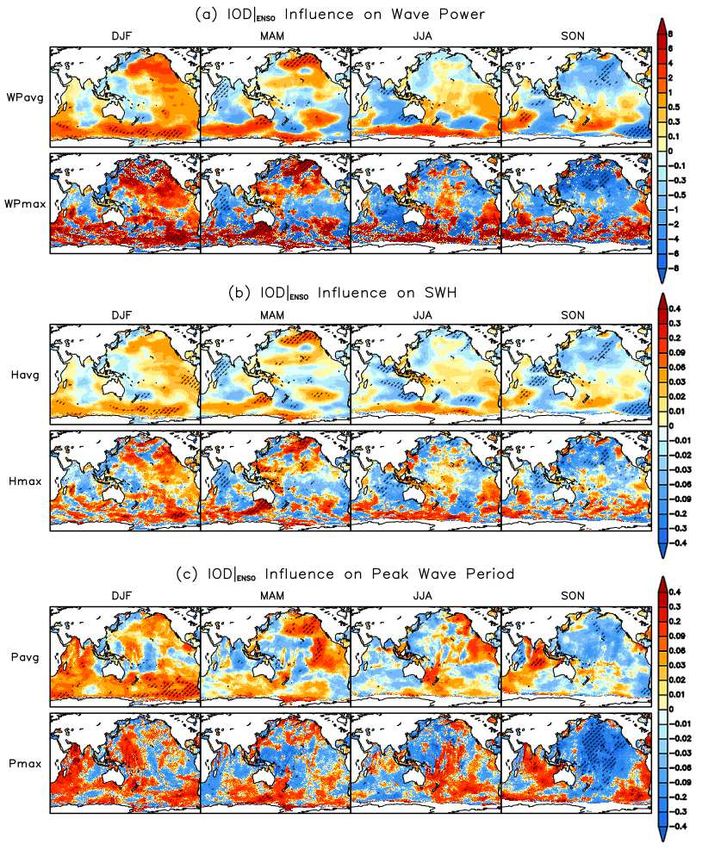
368 Seasonal spatial regression patterns of mean and extreme WP, SWH, and PWP against the

369 independent IOD influence (denoted as IOD|ENSO) after removing the ENSO signal over 1979–

370 2019 in the Indo-Pacific Ocean are presented in Fig. 3. Further, the original seasonal IOD

371 influence (here using the DMI) on the mean and extreme WP, SWH, and PWP that include

372 variability due to ENSO is also provided in Supplementary Fig. 2.

373 Statistically significant IOD|ENSO influences on WPavg and Havg are limited in the Indo–Pacific

374 Ocean and are generally less intense than ENSO influences (c.f. Fig. 2 and Fig.3). During DJF

375 and MAM, the positive responses of extreme WP and SWH to IOD|ENSO are evident over the SO,

376 and the responses extend into the IO for PWP (Fig 3). Significantly decreased signals are also

377 found over the AS and central-to-western IO during MAM. However, the IOD is not active

378 during this half of the year; therefore, such signals may be related to other variability intrinsic to

379 the IO, such as the Indian Ocean Basin Mode (IOBM), which are shown to prolong ENSO

380 effects (Yuan et al. 2008). During JJA and SON, decreases in WP and SWH are evident over the

381 majority of the eastern IO, with increases only in extremes in the BOB in JJA (related to

382 increased cyclonic activity), and over the AS and southwestern IO in SON (Fig. 3a-b). The

383 opposite occurs for mean and extreme PWP, where weak decreases are found over the entire IO

384 in JJA, but large increases are found over the eastern IO alongside decreases over the western IO

385 in SON. The IOD|ENSO influence on extreme WP and SWH is evident over the eastern PO in DJF,

386 over the central north Pacific in MAM, over the western PO in JJA and SON (Fig. 3a,-b). The

387 mean responses to IOD|ENSO are also observed to follow similar patterns as the extreme, except

388 for the western PO and BOB in JJA. The western PO and BOB are subject to high WP due to

389 intensified tropical cyclone activity during JJA (Shanas and Kumar 2014; Yang and Oh 2020,

 18
390 2018); however, negative amplitudes in these regions suggest that El Niño hampers such activity

391 and resulting in smaller WP.

392 Overall, an increase in SWH and decrease in PWP over regions such as the BOB and the north-

393 western Australian coast in DJF are associated with the seasonal increase in small fetch winds

394 (Remya et al. 2020). In addition, significant impact of the IOD|ENSO on SWH is constrained to

395 the eastern IO and BOB in JJA, with decreases in mean PWP. This indicates that whilst swells

396 dominate the IO, wind seas (directly generated and strongly coupled to local winds) are also of

397 importance in JJA during positive IOD events (Remya et al., 2020). In SON, the strongest

398 IOD|ENSO responses in PWP are evident over the entire IO, except the far western IO. However,

399 in the PO, positive responses of PWP to IOD|ENSO occur over the eastern PO except in SON,

400 where decreases in PWP occur over the majority of the PO (Fig.3c).

401 Lastly, comparing independent IOD influences (IOD|ENSO) to the original IOD signals (c.f. Fig. 3

402 and Supplementary Fig. 2), the independent IOD impacts on WP, SWH, and PWP are similar to

403 the complete IOD signal, yet slightly reduced over the entire Indo–Pacific Ocean in DJF and

404 MAM, and over the IO during SON. This emphasizes the significant influence of the IO climate

405 variability over the Indo–Pacific Ocean in DJF and MAM, and over the IO in SON even in the

406 absence of ENSO. In the PO, decreases in WPavg and Havg over the western NP in JJA and

407 SON occur, indicating that ENSO plays a vital role in enhancing the IOD influences in this

408 region (c.f. Fig. 3a-b and Supplementary Fig. 2a-b). Similarly, the negative responses of Pavg to

409 IOD|ENSO are evident over the western NP in JJA and SON, yet they are positive when the

410 covarying ENSO influence is included. This suggests that the PWP signals in the western NP are

411 significantly subdued when the IOD and ENSO are in phase (c.f. Fig. 3c and Supplementary Fig.

412 2c).

 19
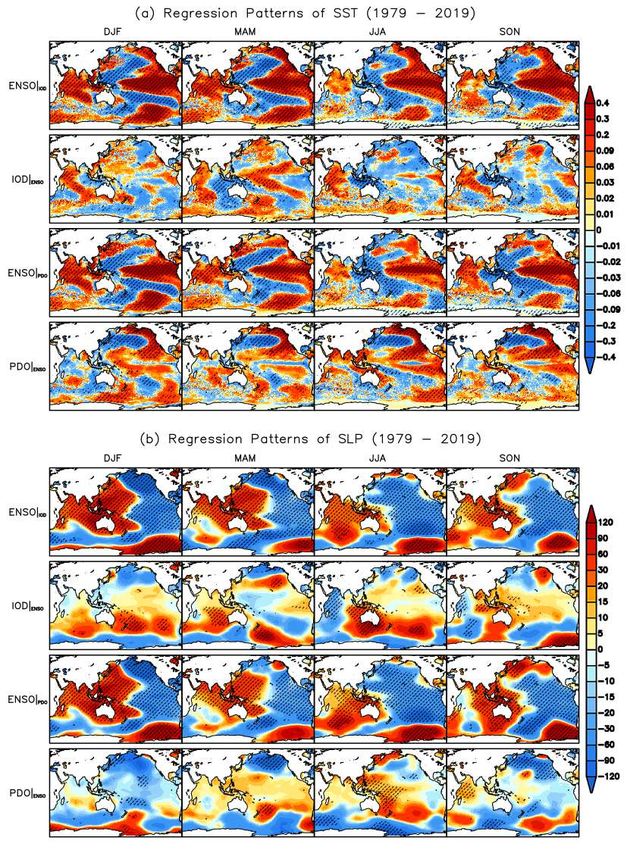
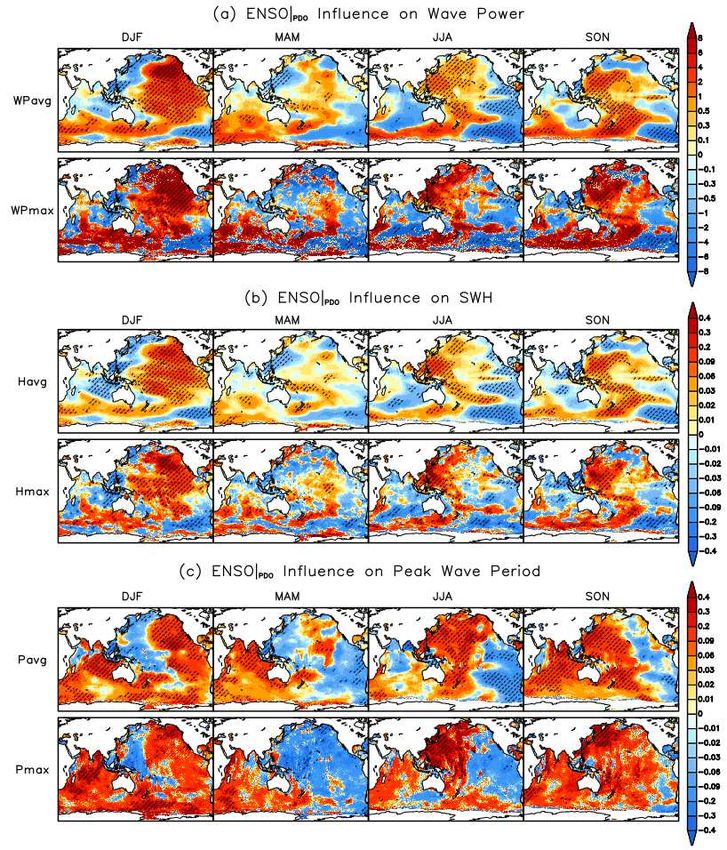
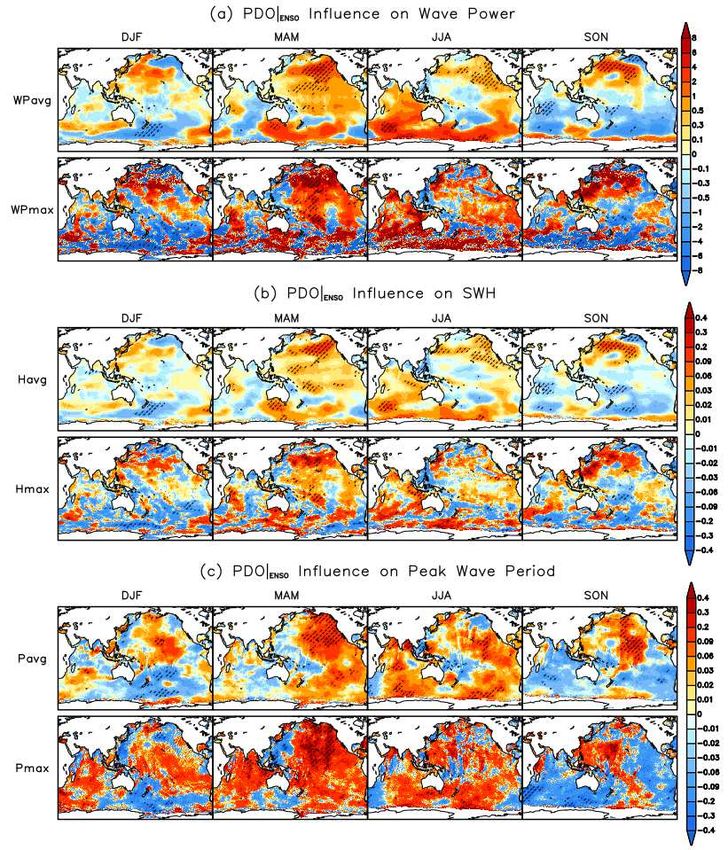
413 4.3. PDO Influence

414 Seasonal regression patterns of WPavg and WPmax, Havg and Hmax, and Pavg and Pmax

415 against the ENSO|PDO (i.e., ENSO independent of the PDO variability) and PDO|ENSO (i.e., PDO

416 independent of the covarying ENSO signals) over 1979–2019 in the Indo-Pacific Ocean are

417 displayed in Figs. 4 and 5, respectively. In addition, the original ENSO and PDO influence on

418 the mean and extreme WP, SWH, and PWP are also provided in supplementary Fig. 1 and Fig. 3,

419 respectively.

420 Overall, the ENSO|PDO influence on mean WP exhibits similar regional and seasonal variations

421 as in the original ENSO but with a slight reduction in the amplitude throughout the year, apart

422 from the PO in MAM, indicating the dominant impact of ENSO even in the absence of PDO (c.f.

423 Fig. 4a and Supplementary Fig. 1a). In MAM, a decrease in WPavg is evident over the central

424 Pacific. This reveals that PDO enhances the WP over the central Pacific in MAM (c.f. Fig. 4a

425 and Supplementary Fig. 1a). The impact of the ENSO|PDO on WPmax is similar to WPavg yet

426 with stronger amplitudes. The regression patterns of mean and extreme SWH associated with the

427 ENSO|PDO are also consistent with the regression patterns of mean and extreme WP throughout

428 the year (Fig. 4b). Further, the Pavg and Pmax response patterns to ENSO|PDO are similar to

429 those of the original ENSO year-round except in MAM. In MAM, a reduction in response

430 patterns of Pavg and Pmax to ENSO|PDO over the central NP (Fig. 4c) is associated with the SST

431 changes driven by the PDO (Fig. 1a).

432 For the independent PDO influence (i.e. PDO|ENSO), significant increases in mean and extreme

433 WP and SWH are mostly confined to the PO and most prominent in the NP (Fig. 5a-b). Over the

434 IO, positive PDO|ENSO responses in WP and SWH are most prevalent during JJA. However,

 20
435 strong counter responses (i.e. significant decreases in WPavg and Havg) are evident over the

436 same regions during SON (Fig. 5a-b). Overall, the extreme responses to PDO|ENSO for WP and

437 SWH are consistent with those of the mean responses. The strongest impact of independent PDO

438 (i.e. PDO|ENSO) on Pavg and Pmax is observed over the central NP in DJF and SON, and over the

439 eastern and southern PO in MAM and JJA (Fig. 5c).This suggests that enhanced PWP in these

440 regions are related to the SST changes associated with positive PDO phase (Fig. 1a). In DJF and

441 MAM, PWP decreases and SWH increases in the western NP are related to the seasonal increase

442 in wind seas. In the IO, positive responses to PDO|ENSO in Pavg and Pmax are evident over the

443 mid-latitudes of the SIO in DJF, and over the western IO in MAM. In JJA, an increase in Pavg

444 and Pmax values occurs over the entire IO apart from a small part of the western SIO.

445 Conversely, counter responses in Pavg and Pmax (i.e. decreases over the IO) are found in SON.

446 Lastly, comparing the seasonal PDO influence independent of ENSO (i.e., PDO|ENSO) to the

447 original PDO signals (c.f. Fig. 5 and Supplementary Fig. 3), it is evident that excluding the co-

448 occurring ENSO signals from PDO reduces the response amplitudes over the eastern PO and

449 mid-latitudes of the SIO in DJF, western TIO, and SIO in MAM, western PO in JJA, and western

450 PO and SIO in SON. This reveals that ENSO plays a significant role in enhancing PDO

451 influences in these regions during these seasons. However, enhanced WP also occurs over the

452 western PO in MAM and the eastern Pacific in JJA (c.f. Fig. 5 and Supplementary Fig. 3).

453 5. Composite Analysis

454 5.1. Composite Analysis of ENSO and IOD

455 As various natural climate variabilities modes interact with one another in a particular season.

456 So, the independent influence of ENSO, IOD, and PDO is analyzed above (in section 4). To get

 21
457 further insight into the interrelation between the various modes of natural climate variability, the

458 composite analysis of the mean and extreme WP for different ENSO and IOD, and ENSO and

459 PDO phase combinations is conducted for the 41 year period over the Indo – Pacific Ocean. In

460 this section composite analysis is conducted between ENSO and IOD. For this, El Niño

461 (ENSO+), La Niña (ENSO−), and positive and negative IOD (pIOD and nIOD, respectively)

462 years are chosen from the detrended and normalized time series of the original indices for those

463 values where ENSO and IOD indices exceeded a threshold value of ±0.5 (list of the years is

464 provided in Table. 3). This gives a total of 9, 3, 5, and 9 sample years in JJA and 11, 3, 4, and 12

465 sample years in SON for the combination of El Niño/pIOD, La Niña/pIOD, El Niño/nIOD, and

466 La Niña/nIOD, respectively. The composite patterns of (left panel) mean and (right panel)

467 extreme WP anomalies in (a) JJA and (b) SON for various ENSO and IOD combinations are

468 shown in Fig. 6.

469 The WPavg and WPmax increases during the El Niño/pIOD years and decreases during La

470 Niña/nIOD years over the western PO, BOB, western TIO, and western SIO in JJA and over the

471 western PO in SON (Fig. 6a and b). The combination of an El Niño event with a pIOD (or nIOD)

472 leads to increase in mean and extreme WP over the western NP and counter response is evident

473 for the combination of La Niña with pIOD (or nIOD) in JJA and SON, reveals the strengthening

474 of ENSO in enhancing/reducing WP in western NP (Fig. 6a and b). During out – phase

475 combinations (i.e. El Niño/nIOD and La Niña/pIOD), an increase in mean and extreme WP is

476 observed over the south-east Indo – Pacific Ocean during La Niña/pIOD and decrease during El

477 Niño/nIOD in JJA and SON.

478 5.2. Composite Analysis of ENSO and PDO

 22
479 The composite patterns of (left panel) mean and (right panel) extreme WP anomalies in (a) DJF,

480 (b) MAM, (c) JJA, and (d) SON for various ENSO and PDO combinations are displayed in Fig.

481 7. For composite analysis, El Niño (ENSO+), La Niña (ENSO−), and positive and negative PDO

482 (pPDO and nPDO, respectively) years are chosen from the detrended and normalized time series

483 of the original indices for those values where ENSO and PDO indices exceeded a threshold value

484 of ±0.5 (list of the years is provided in Table. 4). This yields a total of 8, 5, 2, and 8 sample years

485 in DJF, 13, 5, 3, and 11 sample years in MAM, 7, 3, 6, and 8 sample years in JJA, and 12, 5, 2,

486 and 12 sample years in SON for the combination of El Niño/pPDO, La Niña/pPDO, El

487 Niño/nPDO, and La Niña/nPDO, respectively.

488 For El Niño/pPDO events, WPavg increases over the eastern PO in DJF, the central NP in

489 MAM, NPO, SIO, BOB, and western TIO in JJA, and western PO in SON and decreases over

490 the NIO, TIO, SCP seas, and western NP in DJF, western NP and eastern SPO in MAM and JJA,

491 and in the eastern PO, NIO, and TIO and its counter responses are observed during La

492 Niña/nPOD (Fig. 7, left panel). In SIPO and PO apart from the coastal regions of the western

493 NP, an El Niño (La Niña) event with a pPDO leads to a significant increase (decrease) in WPavg

494 in DJF (Fig. 7a, left panel). The increase in WPavg is seen over the larger parts of the NIO and

495 TIO in MAM during in-phase combinations (i.e., El Niño/pPDO or La Niña/nPOD) (Fig. 7b, left

496 panel). In western NP, WPavg increases for the combination of El Niño with a pPDO (or nPDO)

497 and decreases for the combination of La Niña with a pPDO (or nPDO) in JJA and SON. This

498 reveals that ENSO is responsible for enhancing/subsiding the WP over the western NP in JJA

499 and SON. Further, a La Niña event associated with pPDO, enhances the WPavg over the IO

500 while, the counter responses are evident for the combination of a La Niña with nPDO in JJA.

501 The combination of an El Niño (or a La Niña) with pPDO, decreases the mean WP over the

 23
502 larger parts of the IO, while increases for the combination of an El Niño (or a La Niña) with

503 nPDO in SON. When ENSO and PDO are in out phase combinations (i.e. El Niño/nPOD and La

504 Niña/pPOD), the patterns are noisy and even change the sign in DJF, depicts a decrease in WP

505 over the larger parts of the Indo – Pacific Ocean in MAM, and an increase in WPavg over the

506 BOB and western TIO and decrease in WPavg over the eastern PO in JJA. In SON, an enhance

507 in WPavg is observed over the larger parts of the IO, western PO and mid-latitudes of the SPO

508 during El Niño/nPDO events and decreases during La Niña/pPOD (Fig. 7d). The impact of the

509 ENSO and PDO combinations on extreme WP extreme appears over the same region as in the

510 mean WP year around (Fig. 7, right panel).

511 6. Summary and Conclusions

512 This study investigates the impact of natural climate variability modes such as ENSO, IOD, and

513 PDO on seasonal extreme WP in the Indo-Pacific Ocean using ERA5 reanalysis data over the

514 period 1979–2019. A non-stationary GEV distribution is applied on the seasonal extremes to

515 determine the regions with significant impact, where the natural climate variability modes are

516 taken as the covariates. In addition, the response patterns of SWH, PWP, SST, and SLP to

517 climate variability modes are also evaluate to understand the underlying physical mechanism

518 involved in increasing (or decreasing) the WP. Overall, the strongest ENSO|IOD influence on

519 extreme WP is evident over the eastern Pacific and southern part of the IO (an extension from

520 south of Australia) in DJF, the central Pacific and western TIO in MAM, the western Pacific,

521 western TIO, BOB, SCP seas in JJA, and the western Pacific and eastern TIO in SON. The

522 positive responses of extreme WP to IOD|ENSO are observed over the eastern PO and SO in DJF,

523 the central north Pacific and SO in MAM, the western PO and BOB in JJA, and the southwestern

524 IO in SON whereas, significantly decreased signals are found over the AS and central-to-western

 24
525 IO during MAM and the western PO in SON. The ENSO|PDO influence on extreme WP exhibits

526 similar regional and seasonal variations as in the original ENSO but with a slight reduction in the

527 amplitude throughout the year apart from the PO in MAM. For the PDO| ENSO influence,

528 significant increases in extreme WP are mostly confined to the PO and most prominent in the

529 NP. Over the IO, positive PDO|ENSO responses in WP are most prevalent during JJA and over the

530 SIO and eastern IO.

531 The independent seasonal influence of each climate mode on mean and extreme WP, SWH, and

532 PWP was compared with the original to assess the role of one variability mode in strengthening

533 or weakening the influence of another variability mode. The ENSO influence on extreme WP,

534 independent of IOD, exhibits enhanced WPmax over the eastern TIO in JJA and over the eastern

535 TIO and central NP in SON compared to the original ENSO signals. This implies that the IOD

536 reduces the ENSO signals in these regions during that time of year. The independent IOD impact

537 on WP shows a decrease in WPmax over the western NP in JJA and more so in SON. This

538 suggests that ENSO plays an important role in enhancing the IOD influence in this region during

539 JJA and SON. The independent ENSO influence on WPmax, obtained after the removal of PDO,

540 reveals that the PDO has little to no influence over ENSO signals in the Indo–Pacific Ocean

541 except in MAM. In MAM, the PDO has a strong impact over the influence of ENSO in the PO.

542 Lastly, the independent PDO impact, after removing the ENSO signals, is related to a decrease in

543 WPmax over the eastern PO in DJF, and western NP in JJA and SON. This demonstrates that

544 ENSO is responsible for increasing the WP in these regions during that time of the year. In

545 MAM, ENSO reduces the PDO signals over the PO. In addition, seasonal SLP teleconnection

546 patterns regressed against ENSO|IOD, IOD|ENSO, ENSO|IOD, and PDO|ENSO, exhibit a high and low

547 pressure anomaly that in turn generates strong winds (Kumar et al 2016, 2019; Patra et al. 2020;

 25
548 Remya et al., 2020; Yang and Oh 2018) and consequently enhances the wave parameters (i.e. Hs

549 and Tp) in the respective localized regions. Overall, the mean WP patterns were highly

550 correlated with the extreme WP patterns year-round. Maximum WP increases were often found

551 during seasons when there are increases in tropical cyclone activity and strong winds, such as

552 NIO during JJA.

553 Composite analysis of mean and extreme WP for the different phase combinations of natural

554 climate variabilities (i.e. ENSO with IOD and ENSO with PDO) strengthen the conclusions

555 drawn from the independent influence patterns (i.e. ENSO, IOD, and PDO separately), which

556 shows that the IOD (or PDO) plays an important role in enhancing or reducing the intensity of

557 ENSO-related responses, or vice versa, depending on the season. During JJA, the IOD enhances

558 (reduces) the ENSO impact on WP when both are in-phase (out-phase) combinations. In SON,

559 (i.e., when ENSOs generally develop and IODs reaches in its mature phase), ENSO is able to

560 enhance the IOD influence on WPavg and WPmax significantly. While, PDO (i.e. pPDO or

561 nPDO events) enhances (reduces) the ENSO influence on WP during El Niño (La Niña) year-

562 round.

563 Acknowledgements

564 All the data (SWH, PWP, SST, and SLP) used in this manuscript is obtained from ERA5

565 reanalysis from the ECMWF website (https://www.ecmwf.int/en/forecasts/datasets/reanalysis-

566 datasets/era5). We would like to acknowledge the working groups for the development of the

567 ERA5 reanalysis datasets. In addition, the current research is supported by Ministry of Earth

568 Sciences (MoES), Government of India and Department of Applied Sciences, National Institute

569 of Technology Delhi.

 26
570

571

572 References

573 Aarnes, O. J., Abdalla, S., Bidlot,J.-R.,&Breivik, Ø. (2015). Marinewind and wave height trends

574 at different ERA-Interim forecastranges. J. Climate, 28 (2), 819–

575 837.https://doi.org/10.1175/JCLI-D-14-00470.1

576 Allan, J.C.,&Komar, P.D. (2006). Climate controls on US West Coast erosion processes. Journal

577 of coastal research, 22 (3), 511-529.https://doi.org/10.2112/03-0108.1

578 Amrutha, M.M., Kumar, V.S., Bhaskaran, H.,&Naseef, M. (2019).Consistency of wave power at

579 a location in the coastal waters of central eastern Arabian Sea. Ocean Dynamics, 69(5), 543-

580 560.https://doi.org/10.1007/s10236-019-01267-1

581 Amrutha, M.M.,& Kumar, V.S. (2020). Changes in Wave Energy in the Shelf Seas of India

582 during the Last 40 Years Based on ERA5 Reanalysis Data. Energies, 13(1),

583 115.https://doi.org/10.3390/en13010115

584 Arinaga, R.A.,& Cheung, K.F. (2012). Atlas of global wave energy from 10 years of reanalysis

585 and hindcast data. Renewable Energy, 39(1), 49-64.https://doi.org/10.1016/j.renene.2011.06.039

586 Aydoğan, B., Ayat, B.,&Yüksel, Y. (2013). Black Sea wave energy atlas from 13 years

587 hindcasted wave data. Renewable energy,57, 436-

588 447.https://doi.org/10.1016/j.renene.2013.01.047

589 Barstow, S., Mørk, G., Mollison, D.,& Cruz, J. (2008).The wave energy resource. In J. Cruz

590 (Eds.), Ocean wave energy (pp. 93-132). Springer.

 27
591 Bromirski, P.D., Cayan, D.R.,& Flick, R.E. (2005). Wave spectral energy variability in the

592 northeast Pacific. Journal of Geophysical Research:

593 Oceans, 110(C3).https://doi.org/10.1029/2004JC002398

594 Bromirski, P.D.,&Kossin, J.P. (2008). Increasing hurricane wave power along the US Atlantic

595 and Gulf coasts. Journal of Geophysical Research:

596 Oceans, 113(C7).https://doi.org/10.1029/2007JC004706

597 Bromirski, P.D., & Cayan, D.R. (2015). Wave power variability and trends across the

598 NorthAtlantic influenced by decadal climate patterns. Journal of Geophysical Research:

599 Oceans, 120(5), 3419-3443.https://doi.org/10.1002/2014JC010440

600 Bromirski, P.D., Cayan, D.R., Helly, J.,&Wittmann, P. (2013). Wave power variability and

601 trends across the North Pacific. Journal of Geophysical Research: Oceans, 118(12), 6329-

602 6348.https://doi.org/10.1002/2013JC009189

603 Caires, S., Swail, V. R.,& Wang, X. L. (2006). Projection and analysis of extreme wave

604 climate.J. Climate, 19 (21), 5581-5605. https://doi.org/10.1175/JCLI3918.1

605 Cai, W., Sullivan, A.,& Cowan, T.(2011). Interactions of ENSO, the IOD, and the SAM in

606 CMIP3 models. J. Climate, 24 (6), 1688-1704.https://doi.org/10.1175/2010JCLI3744.1

607 Carter, D.J.T.,& Draper, L. (1988). Has the north-east Atlantic become

608 rougher? Nature, 332(6164), 494-494.https://doi.org/10.1038/332494a0

609 Chen, G., Chapron, B., Ezraty, R.,&Vandemark, D. (2002). A global view of swell and wind sea

610 climate in the ocean by satellite altimeter and scatterometer. Journal of Atmospheric and

611 Oceanic Technology, 19(11), 1849-1859.https://doi.org/10.1175/1520-

612 0426(2002)019%3C1849:AGVOSA%3E2.0.CO;2

 28
613 Coles SG (2001) An introduction to statistical modeling of extreme values. Springer, London, p

614 225. https://doi. org/10.1007/978-1-4471-3675-0

615 Coles, S.,&Casson, E. (1999). Extreme value modelling of hurricane wind speeds. Structural

616 Safety, 20(3), 283-296.https://doi.org/10.1016/S0167-4730(98)00015-0

617 Collins, M., An, S. I., Cai, W., Ganachaud, A., Guilyardi, E., Jin, F. F., et al. (2010). The impact

618 of global warming on the tropical Pacific Ocean and El Niño. Nature Geoscience, 3(6), 391–397.

619 https://doi.org/10.1038/ngeo868.

620 Dee, D. P., Uppala, S.M., Simmons, A.J., Berrisford, P., Poli, P., Kobayashi, S., et al.(2011). The

621 ERA-Interim reanalysis: Configuration and performance of the data assimilation system.

622 Quarterly Journal of the royal meteorological society, 137(656), 553–597. doi:10.1002/qj.828

623 .

624 Donelan, M.A., Drennan, W.M.,&Katsaros, K.B. (1997). The air–sea momentum flux in

625 conditions of wind sea and swell. Journal of physical oceanography, 27(10), 2087-

626 2099.https://doi.org/10.1175/1520-0485(1997)027%3C2087:TASMFI%3E2.0.CO;2

627 Fan, Y., Lin, S.J., Held, I.M., Yu, Z.,&Tolman, H.L. (2012).Global ocean surface wave

628 simulation using a coupled atmosphere–wave model. Journal of Climate, 25(18), 6233-

629 6252.https://doi.org/10.1175/JCLI-D-11-00621.1

630 Feng, X., Tsimplis, M., & Yelland, M. (2012). Extreme waves at the polar front of North

631 Atlantic from 2000 to 2009 (p. 5719). EGU General Assembly 2012, Vienna, Austria

632 Fisher, R. A., &Tippett, L. H. C. (1928).Limiting forms of the frequency distributions of the

633 largest or smallest members of a sample. Proceedings of the Cambridge Philosophical Society,

634 24, 180–190.

 29
635 Gellens, D. (2002). Combining regional approach and data extension procedure for assessing

636 GEV distribution of extreme precipitation in Belgium. Journal of Hydrology, 268(1-4), 113-126.

637 Gulev, S. K., &Grigorieva, V.(2004). Last century changes in ocean wind wave height from

638 global visual wave data.Geophysical Research Letters, 31(24), L24302.

639 https://doi.org/10.1029/2004GL021040

640 Gulev, S.K.,&Grigorieva, V. (2006). Variability of the winter wind waves and swell in the North

641 Atlantic and North Pacific as revealed by the voluntary observing ship data. Journal of

642 Climate, 19(21), 5667-5685.https://doi.org/10.1175/JCLI3936.1

643 Gunn, K.,& Stock-Williams, C. (2012).Quantifying the global wave power resource. Renewable

644 Energy, 44, 296-304.https://doi.org/10.1016/j.renene.2012.01.101

645 Hagerman, G.(2001). Southern New England Wave Energy Resource Potential. Proc. Building

646 Energy 2001, Boston, USA.

647 Hersbach, H.,& Dee, D. (2016). ERA5 reanalysis is in production. ECMWF Newsletter, 147.

648 https://www.ecmwf.int/en/newsletter/147/news/35 era5-reanalysis-production (last access: 14

649 November 2018)

650 Hemer MA, Church JA, Hunter JR (2010) Variability and trends in the directional wave climate

651 of the Southern Hemisphere. Int J Climatol 30:475–491. https://doi.org/10.1002/joc.1900

652

653 Hemer, M.A., Simmonds, I.,&Keay, K. (2008).A classification of wave generation

654 characteristics during large wave events on the Southern Australian margin. Continental Shelf

655 Research, 28(4-5), 634-652.https://doi.org/10.1016/j.csr.2007.12.004

 30
656 Hemer, M.A., Manasseh, R., McInnes, K.L., Penesis, I.,& Pitman, T. (2018). Perspectives on a

657 way forward for ocean renewable energy in Australia. Renewable Energy, 127, 733-

658 745.https://doi.org/10.1016/j.renene.2018.05.036

659 Hemer, M.A., Zieger, S., Durrant, T., O'Grady, J., Hoeke, R.K., McInnes, K.L.,&Rosebrock, U.

660 (2016).A revised assessment of Australia's national wave energy resource. Renewable

661 Energy, 114, 85-107.https://doi.org/10.1016/j.renene.2016.08.039

662 Hulls, K. (1977).Wave power.New Zealand Energy Journal,4, 44–48.

663 Izaguirre, C., Méndez, F.J., Menéndez, M.,&Losada, I.J. (2011). Global extreme wave height

664 variability based on satellite data. Geophysical Research

665 Letters, 38(10),L10607.doi:10.1029/2011GL047302

666 Izaguirre, C., Méndez, F. J., Menéndez, M., Luceño, A., &Losada, I. J. (2010). Extreme wave

667 climate variability in southern Europe using satellite data. Journal of Geophysical

668 Research:Oceans, 115, C04009. https://doi.org/10.1029/2009JC005802.

669 Kharin, V.V.,&Zwiers, F.W. (2000). Changes in the extremes in an ensemble of transient climate

670 simulations with a coupled atmosphere–ocean GCM. Journal of Climate, 13(21), 3760-

671 3788.https://doi.org/10.1175/1520-0442(2000)013%3C3760:CITEIA%3E2.0.CO;2

672 Kharin, V. V., &Zwiers, F. W. (2005).Estimating extremes in transient climate change

673 simulations. Journal of Climate, 18(8), 1156–1173. https://doi.org/10.1175/JCLI3320.1

674 Kumar, P., Kaur, S., Weller, E.,& Min, S.K. (2019). Influence of Natural Climate Variability on

675 the Extreme Ocean Surface Wave Heights Over the Indian Ocean. Journal of Geophysical

676 Research: Oceans, 124(8), 6176-6199.https://doi.org/10.1029/2019JC015391

 31
677 Kumar, P., Min, S. K., Weller, E., Lee, H., & Wang, X. L. (2016). Influence of climate

678 variability on extreme ocean surface wave heights assessed from ERA‐interim and ERA‐20C.

679 Journal of Climate, 29(11), 4031–4046. https://doi.org/10.1175/JCLI‐D‐15‐0580.1

680 Kumar, V.S.,&Anoop, T.R. (2015). Wave energy resource assessment for the Indian shelf

681 seas. Renewable energy, 76, 212-219.https://doi.org/10.1016/j.renene.2014.11.034

682 Mackay,E. B. L. (2012). Ocean energy:Resource assessment for wave energy. In A. Sayigh

683 (Eds.), Comprehensive Renewable Energy (pp. 11–77).Elsevier.

684 Marshall, A.G., Hemer, M.A., Hendon, H.H.,&McInnes, K.L. (2018). Southern annular mode

685 impacts on global ocean surface waves. Ocean Modelling, 129, 58-

686 74.https://doi.org/10.1016/j.ocemod.2018.07.007

687 Menéndez, M., Méndez, F.J., Losada, I.J.,& Graham, N.E. (2008). Variability of extreme wave

688 heights in the northeast Pacific Ocean based on buoy measurements. Geophysical Research

689 Letters, 35(22), L22607.doi:10.1029/2008GL035394

690 Meucci, A., Young, I.R., Aarnes, O.J.,&Breivik, O. (2020). Comparison of wind speed and wave

691 height trends from twentieth century models and satellite altimeters.Journal of Climate, 33 (2),

692 611-624.https://doi.org/10.1175/JCLI-D-19-0540.1

693 Min, S.K., Cai, W.,&Whetton, P. (2013). Influence of climate variability on seasonal extremes

694 over Australia. Journal of Geophysical Research: Atmospheres, 118(2), 643-

695 654.https://doi.org/10.1002/jgrd.50164

696 Mollison, D.(1986). Wave climate and the wave power resource. In D.V. Evans & A. F. O. de

697 Falcao (Eds.), Hydrodynamics of ocean wave-energy utilization (pp. 133-156).Springer.

698 Mori N, Yasuda T, Mase H, Tom T, Oku Y (2010) Projection of extreme wave climate change

699 under global warming. Hydrol Res Lett 4:15–19. https://doi.org/10.3178/HRL.4.15

 32
You can also read