Exchange Rate, Petroleum Price and Price Determination in Sierra Leone
←
→
Page content transcription
If your browser does not render page correctly, please read the page content below
Exchange Rate,
Petroleum Price and Price
     Determination in
       Sierra Leone
                       By

                 B.I.B. Kargbo
Department of Research, Planning and Actuarial
 National Social Security and Insurance Trust
                 Sierra Leone

            AERC Research Paper 353
  African Economic Research Consortium, Nairobi
                September, 2018
THIS RESEARCH STUDY was supported by a grant from the African Economic
Research Consortium. The findings, opinions and recommendations are those of the
author, however, and do not necessarily reflect the views of the Consortium, its indi-
vidual members or the AERC Secretariat.

Published by: The African Economic Research Consortium
              P.O. Box 62882 - City Square
              Nairobi 00200, Kenya

Printed by:     Modern Lithographic (K) Ltd
                P.O. Box 52810 - City Square
                Nairobi 00200, Kenya

ISBN            978-9966-61-046-1

© 2018, African Economic Research Consortium.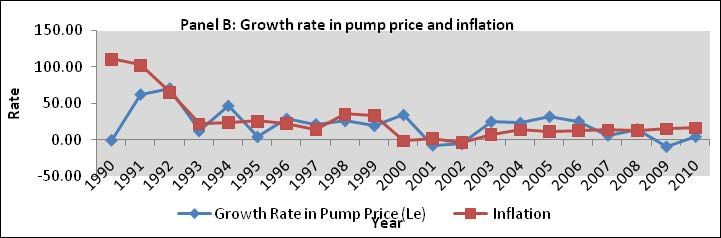
Contents
List of tables
List of figures
Abstract
Acknowledgements

1.    Introduction                                 1

2.    Stylized facts on prices in Sierra Leone     4

3.    Literature review and model specification    8

4.    Results                                     13

5.    Conclusion and policy implications          18

Notes		                                           19

References                                        21

Appendix                                          23
List of tables
1.    Phillips-Perron unit root tests                        14
2.    Cointegrated money demand                              14
3.    Petroleum pump price inflation                         15
4.    General-to-specific modeling                           16

1A. List of abbreviations                                    23
2A. Summary statistics of selected variables in log levels   23
3A. Johansen’s maximum likelihood cointegration test         23
3B.		                                                        24
List of figures
1.    Relative shares (percentage) of selected items to total imports      2
2.    Total value of imports and exports in US dollars, 1990-2010          2
3.    Trends in petrol pump price, inflation and exchange rate dynamics    7

A1.   Disequilibrium in petroleum pump price                              26
A2.   Disequilibrium in money supply                                      26
A3.   Disequilibrium in output                                            27
Abstract
The Sierra Leone economy is a net importer with a chronic negative balance of trade.
Imports as a percentage of GDP averaged 40.8% between 2001 and 2010. Imports of
food, mineral fuels and lubricants accounted for 50.8% of the total value of imports
within the same period. Also, the value of the leone depreciated from Le 920.75 in 1996
to Le 4,000 in 2010 while inflation averaged 12.6% for the same period. As a result of
the interplay of these forces, fuel prices are most times adjusted upwards to compensate
for the depreciation of the leone against the dollar or to match up with increases in the
world price of crude oil. This study determines the effects of monetary environment
as well as exchange rate movement and petroleum prices on domestic prices in Sierra
Leone by estimating a hybrid model of inflation in which inflation responds to its own
lags, lags of other variables, and a set of error-correction terms that represent short run
disequilibria from the money market, external sector and output that feed into the inflation
process.The empirical results from the parsimonious model show that petroleum product
prices and exchange rate, as well as monetary factors determine inflation in Sierra Leone.
What is also significant from the findings is that the contribution of petroleum prices to
domestic price formation is unfounded in the long run, meaning that it is only a short-
run phenomenon. The results also support the view that a fair portion of fluctuations in
domestic prices is driven by its own shocks.

JEL Classification: C13, E31, E51, O55.
Keywords: Sierra Leone, Inflation, Pump Price, Exchange Rate.
Acknowledgements
The research gratefully acknowledges comments from Ibi Ajayi (Chairman of Group B),
Moshin Khan, Stephen O’Connel, Dick Durevall, Akpan Ekpo and all other Resource
Persons as well as discussions from colleague researchers at Group B presentations at
the AERC Biannual Research Workshops in 2011 and 2012. The views expressed in
this paper are solely those of the author and do not necessarily reflect the position of the
institution of affiliation and I accept full responsibility for any errors.
Exchange Rate, Petroleum Prices and Price Determination in Sierra Leone 1
1. Introduction
The problem
I n many oil importing countries in Sub-Saharan Africa (SSA), the prices of petroleum
products as well as exchange rate dynamics are key elements driving domestic prices.
In other words, rising oil prices and currency depreciation are prominent external factors
affecting inflation (Salvatore, 1984). Monetary policy, fiscal policy and wage policy
also have an impact on domestic price levels.1 Several possible explanations account
for the impact of these external factors on domestic prices: a higher proportion of
imports on the CPI basket; a higher share of imported inputs in the production process;
and the degree of competitiveness of the different sectors of the economy. Petroleum
prices have a significant impact on domestic prices because fuel products are essential
in the production process. Menu-cost models of price adjustment suggest that inflation
is higher in markets where price changes are more frequent (Taylor, 1999; Amano and
van Norden, 1998). This is partially due to the cost of changing prices.
A continuous hike in petroleum prices can throw a country into balance of payment
difficulties, especially for an oil importing country such as Sierra Leone. This would
invoke larger and more frequent currency devaluations or depreciations and higher cost
for all other inputs, thus significantly contributing to domestic inflation (Salvatore, 1984).
Deficit financing of major capital expenditures can also be inflationary in developing
countries (Vogel, 1974). The reason is that the share of monetary GDP to total GDP is
very low, thus a given deficit financed by sale of government securities to the banking
system would lead to a disproportionate increase in money supply.
Petrol and diesel are the major petroleum products in Sierra Leone, used mainly for
power generation and transportation. Therefore, a rise in prices of petroleum products
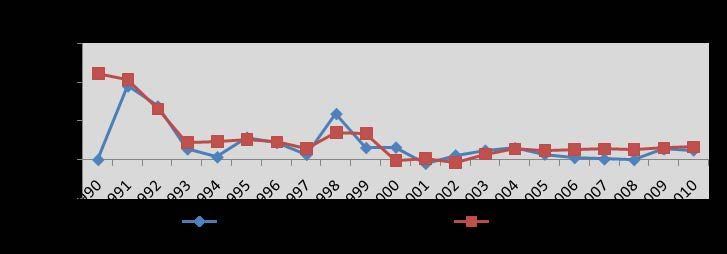
will increase almost the entire cost of production. The relative shares of selected major
imports over the period 1990-2010 are shown in Figure 1. The average share of fuels
and lubricants to total imports in Sierra Leone is 23.9% during the review period while
the average shares of food and machinery relating to the same period are 29.6% and
16.8%, respectively.
It is clear from Figure 1 that during the initial period, food imports outweigh imports
of fuel and lubricants, but the tide is reversed from 2003 upwards. It can also be seen that
during 2010, imports of machinery and equipment outweigh those of fuel and food. The
reason is due to the large importation of heavy machinery for the setting up of African
Minerals and London Mining, a company involved in the extraction of iron ore.
12 Research Paper 602
Figure 1:Relative shares (percentage) of selected items to total imports
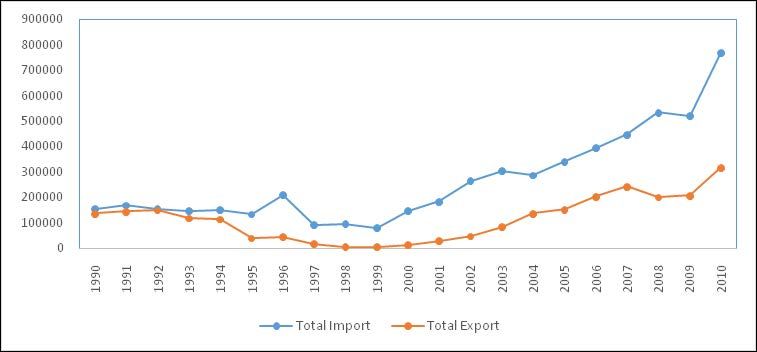
The total volume of trade between 1990 and 2010 is shown in Figure 2. It is clear
from Figure 2 that the value of imports outpaces exports during the entire study period,
and that the volume of trade increased during the initial period, nose dived in 1995
and 1996 when the war heightened, and gradually trended upwards for the rest of the
research period.
Figure 2: Total value of imports and exports in US dollars, 1990-2010
The critical concern is how to gauge the impact of petroleum prices on domestic
prices, since inflation is a perennial problem of the Sierra Leone economy, implying
that the former would have contributed only to a prevailing difficulty. In tandem with
this, domestic petroleum prices are determined according to world crude oil prices
and exchange rate movements. Thus, exchange rate dynamics have double impact onExchange Rate, Petroleum Prices and Price Determination in Sierra Leone 3
domestic prices; pass-through in general, and its specific impact on petroleum imports.2
As a result of this, it is not unusual for domestic petroleum prices in Sierra Leone to
likely respond to changes in exchange rate and fluctuation in world oil prices. This study
attempts to fill this gap in terms of exploring the link between domestic price level and
prices of imported petroleum products, on one hand, and the impact of exchange rate
movements on domestic prices, on the other. The reason is that understanding the causes
and consequences of price rigidities in an economy is essential for assessing the impact
of macroeconomic policies on that economy. This analysis is very significant if policy
makers are to mitigate the impact of exchange rate dynamics on petroleum prices, and
come up with policies that will enhance stability of pump price.
Objectives of the study
T he broad objective of this study is to investigate the role of prices of petroleum
products, and exchange rate, in price determination in Sierra Leone. The specific
objectives are to:
(i) Empirically examine the relative significance of pump price of petrol on inflation;
and
(ii) Investigate the effect of exchange rate on domestic inflation.
The rest of the paper is structured into four sections. Section II presents stylized
facts on prices in Sierra Leone. Section III discusses the relevant literature and model
specification. Section IV estimates the model and contained in Section V are some
conclusions and policy implications.4 Research Paper 602
2. Stylized facts on prices in Sierra Leone
T
he structure of the Sierra Leone economy is rudimentary. Retailing, dominated
by small-scale businesses, shapes the business landscape. The decade-long
civil conflict in the 1990s devastated both social and economic infrastructure
condemning many people to the abyss of poverty as the country is persistently ranked
as among the poorest in the world, according to the UN Human Development Index
(IMF Ex-Post Assessment of Longer-term Programme Engagement, No. 5-192). Sierra
Leone has a rich resource base as well as a diversified largely untapped agricultural
sector. The key exports of the West African nation are dwindling and include diamonds
and agricultural crops, coffee and cocoa. The mining industry accounted for almost 5%
of the country's GDP between 2007 and 2010, while minerals made up 79% of total
export revenue, with diamonds accounting for 46% of export revenue in 2008. The main
minerals mined in Sierra Leone are diamonds, rutile, bauxite, gold, iron and limonite. The
Government of Sierra Leone has signed lease agreements with some mining companies
that started the mining and exportation of iron ore and bauxite in 2012, with the growth
rate projected to be a double digit.
Exchange rate policy in Sierra Leone
A series of exchange rate adjustments were adopted in the 1980s due to persistent
deficit in the balance of payments.3 The deterioration in economic performance in
the 1980s, including poor external sector performance, led to the introduction of a dual
exchange rate system in 1982 under the Modified Exchange Rate Arrangement (MERA).
This involved an official exchange rate and a commercial market rate but the policy
was not effective as external sector performance continued to deteriorate. The poor
performance emanated from the fact that such a system often encourages the diversion
of export remittances from the official market to the parallel market.
As a result of these inherent difficulties, a unified exchange rate system was adopted
in July 1986. However, fiscal deficit continued to widen and was mainly financed by
borrowing from the domestic banking system, especially through domestic credit.
Therefore, money supply was difficult to control, leading to inconsistent monetary
expansion with high inflation and real exchange rate appreciation as consequences.4
Thus, external sector performance could not be improved despite the unification.
A managed type floating exchange rate regime was adopted in April 1990, and most
current account transactions were liberalized. The main reason for such a move was that,
the premium between the official and parallel market rate was getting larger during the
4Exchange Rate, Petroleum Prices and Price Determination in Sierra Leone 5
fixed exchange rate regime. Smuggling of diamond, gold and other produce was on the
increase, thereby undermining the balance of payments. The nominal exchange rate has
been depreciating since the adoption of the (managed) floating exchange rate.
The Central Bank of Sierra Leone introduced a system of foreign exchange auction
in February 2000. This weekly foreign exchange auction has continued to provide a
regular source of foreign exchange, complementing the other sources, with the intention
of financing private sector imports. The sectors opened to the auction are banks, oil
companies, manufacturing industries and general imports. Notwithstanding this action,
in most cases, the supply tends to lag behind the demand for foreign exchange.
CPI and petroleum prices
T he Consumer Price Index (CPI) in Sierra Leone is made up of 251 items categorized
under 12 functions according to the Classification of Individual Consumption
according toPurpose (COICOP). The weight of food and non-alcoholic beverages in the
CPI basket is 51.02%, while housing, water, electricity, gas and other fuels is 9.81% and
transport is 5.95%.5 Furthermore, the proportion of imported goods in the CPI basket is
almost 60%. This high proportion implies that exchange rate dynamics have an impact
on the prices of goods in the CPI basket. Also, the weight of food and non-alcoholic
beverages in the basket possibly explains why increase in transportation fares normally
impacts on the overall CPI, since these items need to be transported locally. Also, food
items are typically unprocessed goods and, therefore, have little value-added beyond their
primary input costs to absorb cost shocks (Kovanen, 2006). The average of imported
goods as a percentage of GDP between 2000 and 2010 was 40.75. The value of imports
within this same period averaged US$ 340 million, with mineral fuels and lubricants
and food accounting for 50.8%. Exchange rate depreciated from Le 920.75 in 1996 to
Le 3,450.68 in 2010, while inflation rate averaged 12.57% for the same period.
The impact of petroleum product prices on domestic prices is very crucial in Sierra
Leone, since transportation fares are sometimes raised to reflect increases in the pump
price of fuel.6 The difference between the domestic and world prices of fuel is sometimes
absorbed by the government through direct and indirect subsidies. This action sometimes
prevents a direct impact on inflation but has an indirect one through the management
of monetary and fiscal policies.
In few instances, for example in June 2009, Sierra Leoneans have experienced
reduction in petroleum product prices in response to decline in world price of crude but
the magnitude of the reduction at the domestic level is sometimes not commensurate
to the reduction at the world level. Similarly, the magnitude of the increase in world
price of crude is most times not fully transmitted to the domestic consumer. The pump
price of fuel is normally determined by the Petroleum Monitoring Unit located in the
Ministry of Trade and Industry.7 Petroleum products in Sierra Leone attract a series of
levies: an import duty of 5% on an ad valorem basis, storage cost, port charges, and
transfer and agency fees. These levies contribute to the landing cost of the products. In
addition to these levies, the products also lure an excise duty, a road user charge and a
petroleum fund levy. The management of oil-related taxes is under the Petroleum Fund
Unit located at the Ministry of Trade.6 Research Paper 602
The Government of Sierra Leone reintroduced a fuel subsidy in August 2009 to
match the soaring of the world price of crude oil around that time, but maintaining this
provision was not sustainable as the subsidy was eliminated in May 2011, coinciding
with the change in fuel measurement from imperial to metric. The excise duty on petrol
was Le 2,808 per gallon for 2009 and 2010 and currently stands at Le 137.07 per litre
(Le 625.04 per gallon), a reduction by 77.7%8 (Leone, 2011).
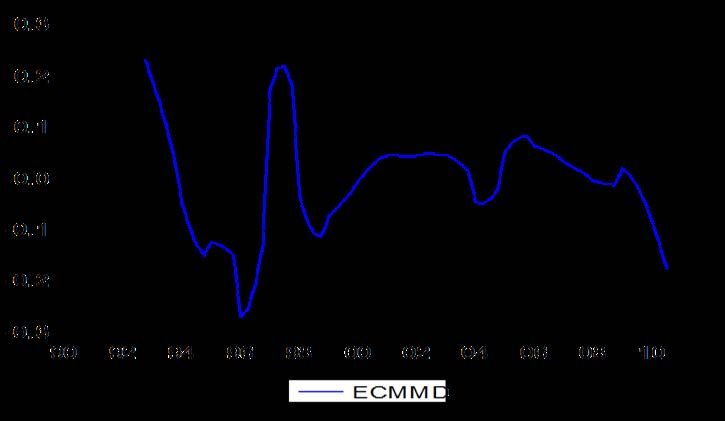
The dynamics in the pump price of petrol, inflation and movements in the exchange
rate is illustrated in Figure 3. The trend analyses explored all the links as specified earlier;
i.e. barrel price and pump price, pump price and inflation, exchange rate and inflation,
and exchange rate and pump price.
Panel A shows a cross plot of the growth rate of the pump price of petrol and the
Brent price per barrel. It is clear from Panel A of Figure 3 that the pump price of petrol
generally mimics the growth in the international price. This implies that there is some
pass-through from the international market to the domestic market for petroleum products.
Moreover, domestic prices do not fully reflect international prices in Sierra Leone due
to the fact that the good is politically sensitive, and that the authorities adjust taxes and/
subsidies to buffer the ensuing volatility.
A plot of the growth rate in pump price and inflation is contained in Panel B. It is
clear from Panel B that the pump price of fuel and inflation do not flow in the same
direction. The picture can best be described as being mixed; for example in 2000, there
is a drastic fall in inflation while the pump price soars. It can largely be generalized that
during the period under investigation, inflation rate does not perfectly echo movements
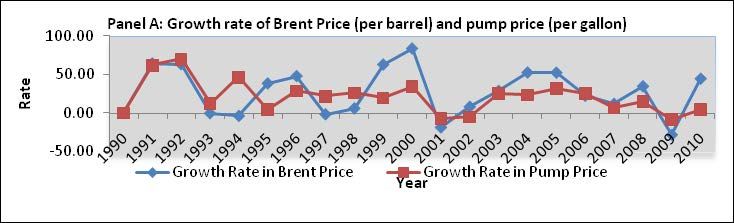
in petroleum pump price. The growth rate in the pump price of petrol, and exchange
rate, largely staggered throughout the period under review as displayed in Panel C. The
picture in the last two years (2009 and 2010) is that exchange rate soars while pump price
remains stable. A plausible reason that might explain such a clumsy link between the
two variables is the price stabilization policy intervention on the side of the government,
such as making foreign exchange available to oil importers at the official auction rate.
What is still clear is that the exchange rate depreciated throughout the period of analysis.
The link between exchange rate and inflation is displayed in Panel D. It can be inferred
that both variables largely move in the same direction, also suggesting some amount of
pass-through to domestic prices.Exchange Rate, Petroleum Prices and Price Determination in Sierra Leone 7 Figure 3: Trends in petrol pump price, inflation and exchange rate dynamics
8                                                                        Research Paper 602

3. The literature and model specification

T
        he oil crisis of the 1970s provoked investigations on the impact of imported
        petroleum on domestic inflation in not only oil-importing developing countries but
        also industrialized countries. The key implications arising from the studies are that
the oil price hike of the 1970s led to an average price spiral and adverse macroeconomic
consequences (Rafiq et al, 2009; Cologni and Manera, 2008; Cunado and Gracia, 2005;
Chen and Chen, 2007). Another factor worth noting is that inflation was widespread in
most LDCs even before the sharp increase in petroleum products in 1973 (Salvatore,
1984; Lowinger, 1978). In addition to the world price increase, exchange rate dynamics
also impacted on domestic prices (Perera, 2005; Leigh and Rossi, 2002; Choudhri and
Hakura, 2006).
    Lowinger (1978) investigated the link between domestic inflation and exchange rate
changes in less-developed countries by modelling a close-economy price equation as
well as an open-economy reduced form equation. The study revealed that for relatively
open economies, a variable exchange rate imposes additional costs in terms of a higher
rate of inflation. In almost all the regression equations, the coefficients of the expected
rate of inflation are positive and significance. A shortfall of this investigation is the lack
of determination of inflationary expectations.
    In assessing the impact of petroleum prices and exchange rates on domestic inflation
in developing nations, Salvatore (1984) extended the closed-economy monetary model to
examine the channels and relative significance of the increase in price and in the overall
cost of imported petroleum on domestic inflation in oil-importing developing nations.
The empirical results seem to pinpoint that higher petroleum prices did contribute to
domestic inflation in oil-importing developing nations. In a similar study for industrialized
countries, and adopting the same extended model, Salvatore (1986) concluded that the
main channel by which inflation was imported is primarily through currency depreciation
resulting from sharply increased petroleum import bills, rather than directly through
increase in the price of imported petroleum itself.
    A seminal study by Canetti and Greene (1992) did not find a common pattern in
African countries as far as the causes of inflation are concerned; in some cases, the
exchange rate channel seems to be more effective, while in others the money supply
growth has the longer term impact. The research used a vector auto-regression analysis to
separate the influence of money supply growth from exchange rate changes on prevailing
and predicted rates of inflation in Africa. The results of the investigation find that both
exchange rate movements and monetary expansion affect consumer price changes in a
number of SSA countries. In particular, the study disclosed that exchange rates have a

                                              8
Exchange Rate, Petroleum Prices and Price Determination in Sierra Leone 9
significant causal impact on prices in Tanzania, Sierra Leone and the Democratic Republic
of Congo (DRC). This is linked to the high inflation incidents in these countries.
The inflationary process in Sierra Leone was investigated by Kallon (1994) using
quarterly data for the period 1967-1987. The research estimated a reduced-form
inflation equation using an open economy IS-LM model. The findings could not reject
the hypothesis that money-supply growth would lead to an equi-proportionate increase
in inflation in the long run, while it is rejected in the short run. Moreover, the evidence
suggests that part of Sierra Leone's inflation is imported from the rest of the world.
On inflation and exchange rate dynamics literature, Agenor and Montiel (1999)
observe that under purchasing power parity (PPP), the domestic price level appears to be
determined by the exchange rate. Thus, stabilization of inflation would seemingly require
that the rate of depreciation be slowed to that of the exchange rate, thereby assigning it
the task of ensuring price stability, and external balance be achieved through restrictive
aggregate demand policies.
A detailed analysis of the exchange rate pass-through to domestic prices in Colombia
using two different econometric frameworks, unrestricted VAR and the Johansen
framework of multivariate cointegration, was undertaken by Rowland (2002). Impulse-
response functions were used in both frameworks. Based on the results of the research, the
pass-through in Columbia was incomplete. Import prices respond more swiftly compared
with producer prices with pass-through coefficients of 0.48 and 0.28, respectively. The
unrestricted VAR framework yielded a pass-through coefficient of 0.08 after a one year
lag, while the Johansen framework yielded a coefficient of 0.15. The fact that the two
frameworks produced different results called for further research to provide justification
for the application of both approaches.
Perera (2005) measured the impact of changes in petroleum prices (diesel price
was used as a proxy) on inflation in Sri Lanka for the period 2002 to 2004 using an
autoregressive distributed lag (ADL) model, and the research analysed both direct and
indirect impacts. The direct impact was measured through items relating to petroleum
prices, such as electricity charges and transport fares as included in the CPI basket. The
study revealed that an increase in diesel price by 10% would directly increase the Sri
Lankan CPI by 0.19%.The ADL model was used to assess the indirect impact. Increase in
diesel price by 10% would increase the monthly CPI by 1.01% with a lag of 2-3 months.
Thus, even though the indirect impact is larger compared with the direct impact, its effect
comes with a lag. A shortcoming of this study is that it does not take into consideration
the other factors that are important in domestic price determination in Sri Lanka.
An examination of the effect of changes in exchange rate on consumer prices in
Tanzania using a structural VAR model was undertaken by Mwase (2006). The study
finds that the exchange rate pass-through to inflation declined in the late 1990s despite
the depreciation of the currency, and it was partly attributed to the macroeconomic and
structural reforms that were implemented during the study period.
Khan and Schimmelpfennig (2006) examined the relative significance of monetary
factors as well as structuralist supply-side factors for inflation in Pakistan using a hybrid
monetarist model based on monthly data. The estimates from the Vector-Error Correction
Model indicate that monetary factors affect inflation, and that wheat prices influence
inflation only in the short run.10 Research Paper 602
Kovanen (2006) analysed the causes of frequent price changes in Sierra Leone using
micro-level price data from two perspectives: cross-section and overtime. The research
decomposed the variance of the monthly price change into extensive and intensive
margins. The study suggested that variance in inflation may be explained largely by the
extensive margin (fluctuations in the fraction of items subject to price changes). However,
the fraction of prices subject to change each month is influenced by lagged inflation
and broad money. While the coefficient of broad money was found to be statistically
significant with a positive impact on the fraction of prices changing each month, that of
the exchange rate variable was not statistically significant. The study concluded that by
containing money growth and inflation, monetary policy would reduce the fraction of
price changes in Sierra Leone.
The influence of commodity prices and money on inflation is studied by Browne
and Cronin (2007) using a cointegrated VAR framework and data from the US. The
empirical findings showed long-run proportional relationships between money, and in
turn consumer prices and commodity prices.
The impact of crude oil price volatility on economic activities in the Thai economy
was examined by Bloch et al (2008) using a VAR system. The different set of results
(Granger causality, impulse response and VAR decomposition) showed that oil price
volatility has significant impact on macroeconomic variables such as unemployment
and investment.
Cologni and Manera (2008) investigated the impact of oil prices on inflation and
interest rates in a co-integrated vector auto-regressive (VAR) framework for G-7
countries. Using quarterly data for the period 1980-2003, they find that, except for
Japan and the UK, oil prices significantly affect inflation, which is transmitted to the
real economy by increasing interest rates. Impulse response function analysis suggests
the existence of an instantaneous, temporary effect of oil price change on inflation.
Inflation dynamics and food prices in Ethiopia were examined by Durevall et al (2010)
using monthly data. The research developed a single-equation ECM and considered
money growth, exchange rate changes, imported inflation, energy-inflation, and world
fertilizer-price inflation. The key conclusion is that movement in international prices of
food and goods measured in domestic currency determined domestic prices in the long
run, and that agricultural supply shocks and money supply growth affect food inflation
and non-food price inflation, respectively, in the short run.
Adam et al (2012) developed an empirical to analyse the relationship between food
prices and inflation in Tanzania using high frequency data. The study estimated single
equation models for headline inflation and its core constituents, including energy, food
and core inflation as stationary processes that depend on their own past values, on
short term inflation determinants, and lagged deviations from a set of pre-estimated
long run inflation anchors. The results of the analyses pointed to the fact that monetary
or demand-side effects feed fuel and price inflation, even though the transmission to
headline inflation is principally through core inflation. Furthermore, food price inflation
is driven by domestic agricultural supply shocks as well as pass-through from world
prices for food and fuel.
This study goes beyond assessing the relative significance of exchange rate dynamics
on domestic prices but also examines the contribution of domestic pump price of fuelExchange Rate, Petroleum Prices and Price Determination in Sierra Leone 11
as well as the monetary factors to inflation.9 The differences between this study and the
few studies on Sierra Leone lie in the coverage period, type of data, methodology and
variables of interest (domestic petroleum pump price).
The model
T he determinants of inflation tend to vary across studies depending on the weights
allocated to the sources of inflation. The structuralist models of inflation stress
on supply-related factors such as wage costs, interest rates, output, foreign prices and
exchange rates (bottlenecks on the real side of the economy) as determinants of inflation.
The structuralists assume that these factors have to be accommodated by monetary
policy makers because they are exogenous to the monetary domain. Monetarist models
emphasize monetary growth with two well-known prepositions: i.e. exogenous changes
in money stock lead to equivalent percentage changes in the overall price level under
conditions of stable money demand; and exogenous changes in the money stock are
neutral in the long-run steady state.
The Phillips curve and the quantity theory are the two approaches used to model
inflation. The general theoretical framework of this analysis is derived from the quantity
theory perspective, and focuses on money supply and demand, assuming that inflation
is fuelled by excess money supply. Following the works of Woo (1984), Menon (1995),
Juselius (1992), Hyder and Shah (2005), Durevall et al (2010) and Adam et al (2012),
this study adopts the view that inflation mainly originates either from price adjustments
in markets with excess demand or supply, or from price adjustments due to import
costs. The approach is to embed a parsimonious model of inflation within a generalized
framework in which inflationary pressures emerge from the deviation from equilibrium
in different markets. The focus is on markets in three sectors: the monetary sector,
the external sector (limited to the petroleum sector in this study), and business cycle
fluctuations (deviation of output from its trend).
Specifically, the study hypothesizes that changes in the domestic price level are
affected by deviations from the long-run equilibrium in the money market, the petroleum
sector, and fluctuations in natural output. The parsimonious approach modelled inflation
as a set of error correction terms that measure deviations from equilibrium in the three
sectors, and in which inflation responds to its own lags, and lags of other variables.
Therefore, the research evaluates the impact on inflation of excess money supply,
changes in petroleum prices and output. This is a hybrid of inflation as it encompasses
the other variables considered in modelling inflation. The money demand function is
therefore specified as:
ln M t =β 0 + β1 ln Yt + β 2 ln Rt + ln P + ε t (1)
Where: M = Money Supply,
Y = Real Gross Domestic Product, and
R = Treasury bill rate, and
P = Consumer price inflation.1012 Research Paper 602
Petroleum is internationally traded; the study, therefore, measures the deviation of
pump price from the world petroleum price and the specification is shown in Equation 2.
λ0 + λ1 ln Et + λ2 ln BPt + υt
ln PPt = (2)
Where: PP = Pump price of petrol per gallon,
E = Exchange rate, and
BP = international price of Brent per barrel.
In order to examine the relative significance of the disequilibrium emerging from the
monetary sector and petroleum sector, the above specifications are estimated separately
and disequilibrium terms are then included in a single ECM. The specified ECM is:
k −1 k −1 k −1 k −1 k −1
d ln Pt = ∑ Ω0 d ln Pt −i + ∑ Ω1 d ln M t −i + ∑ Ω2 d ln Et −i + ∑ Ω3 d ln Rt −i + ∑(3)
Ω4 d ln Yt −i
i −1 i= 0 i= 0 i= 0 i= 0
k −1 k −1 k −1 k −1
ln M t −i + ∑ Ω2 d ln Et −i + ∑ Ω3 d ln Rt −i + ∑ Ω4 d ln Yt −i + ∑ Ω5 d ln PPt −i + Ω6 ECM pp (t −1) + Ω7 ECM md (t −1) + Ω8
i= 0 i= 0 i= 0 i =0
n PPt −i + Ω6 ECM pp (t −1) + Ω7 ECM md (t −1) + Ω8Ygap (t −1) + Dwar + µt
Where: d = First difference operator,
µ = White noise process,
Dw = War dummy,
ECMpp = Error correction representing disequilibrium from the pump price;
ECMmd = Monetary disequilibrium from the cointegrated money demand
equation, and
Ygap = the difference between GDP and ‘natural’ GDP, and all other
variables are as defined earlier.
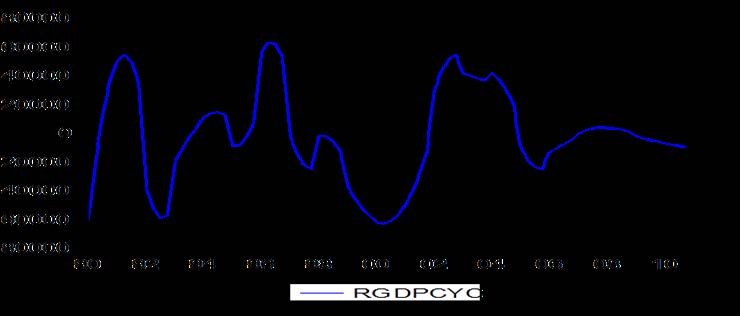
The GDP gap itself is an error-correction term. Conventionally, output variation
impact on inflation is gauged through direct measurement of what is referred to in the
literature as deviation of actual from potential output (Loening et al, 2009; Adam et al,
2012). The output gap is measured using Hodrick-Prescott (HP) filter.11
The war dummy is included in the specification to clean the influence of the
monetization of government expenditure driven by the cost of the conflict and subsequent
reconstruction programmes.12 The coefficients of the error correction terms, i.e. Ω6, Ω7
and Ω8 show the amount of disequilibrium transmitted in each period into the current
rate of inflation.Exchange Rate, Petroleum Prices and Price Determination in Sierra Leone 13
4. Results
Analytical tools and data requirements
T he empirical model used quarterly data for the period 1990-2010 as it provides
a reasonable time frame to study exchange rate, petroleum prices and price
determination in Sierra Leone. The selected period covers both war and non-war years.
Estimates were arrived at using general-to-specific modelling in order to obtain the
short-run dynamics. The time series properties of the data were examined using the
Phillips-Perron unit root test.
Inflation is change in overall year on year CPI. The pump price of petrol is considered
as a proxy for petroleum products because petrol is in higher demand compared with
diesel and, in the past seven years, there is unanimity in the pump price of petrol and
diesel. The exchange rate variable (E) used in this study is the nominal exchange rate.
Broad money (M) and the Treasury bill rate (TBR) are used in the model to capture the
effect of private agents’ decisions on inflationary trends.13
Estimates of the models
T he summary statistics of all the variables used in this empirical section is provided
in Appendix Table 2, while the correlation matrix is in Appendix Table 3. The
correlation coefficient between petroleum price and inflation is very high and also strong,
but the correlation between petroleum price and exchange rate is inverse. The correlation
between broad money and inflation is 0.96. The Phillips-Perron test statistic was used
to test the variables for unit root. All the variables in log levels are non-stationary and
are integrated of order one as contained in Table 1.14
1314 Research Paper 602
Table 1: Phillips-Perron unit root tests
Variable
Phillips-Perron Test Statistic Conclusion
_______________________________
With Drift Drift and
Trend
P Log Level 1.6145 -1.5957 I(1)
ΔLevel -4.5948** -4.0465*
Y Log Level 0.2293 -1.5307 I(1)
ΔLevel -4.3734** -4.7206**
M Log Level 0.1056 -1.9412 I(1)
ΔLevel -3.0435* -3.7832*
R Log Level -2.4570 -2.5820 I(1)
ΔLevel -4.8089** -4.8022**
BP Log Level -2.1628 -2.3529 I(1)
ΔLevel -4.4529** -4.2511**
PP Log Level 0.7517 -1.7163 I(1)
ΔLevel -4.8111** -5.3630**
E Log Level -0.4732 -3.2215 I(1)
ΔLevel -5.0173** -7.0695**
Ygap Log Level -23.7837** -31.4392** I(0)
ECMmd Log Level -5.3602** -5.3137** I(0)
ECMpp Log Level -8.8625** -8.8157** I(0)
Notes:
(i) Critical values for the Test Statistic with Drift at 1% and 5% are -3.5112 and -2.8972.
(ii) Critical values for the Test Statistic with Drift and Trend at 1% and 5% are -4.0738 and -3.4655.
(iii) ∆ represents first difference operator.
(iv) ** (*) implies significant at 1% (5%) level.
Cointegrated money demand
T he Johansen’s maximum likelihood procedure provides a unified framework
for the estimation and testing of cointegration relations in the context of vector
autoregression (VAR). The first stage in carrying out the Johansen’s maximum likelihood
procedure is the determination of the optimal lag length of the related VAR.15 The Akaike
Information Criterion (AIC), Schwartz Information Criterion (SIC), Hannan Quin (HQ)
test, Likelihood Ratio (LR) test and Final Prediction Error (FPE) test were used in the
selection of the appropriate lag lengths. A chosen lag length is appropriate if more of
the five criteria provide support for it. The diagnostics pointed to an optimal lag length
of 1. Thus, the VECM is estimated with a lag length of 1 and the associated system has
a cointegrating rank of 1. The cointegrated money demand equation is shown in Table
2 and the full cointegration analysis is shown in Appendix Table 3.
Table 2: Cointegrated money demand
Variable Coefficient t-statistic
Constant -13.138
LnY 1.311 11.826
LnR 0.386 3.876
LnP 1.347 5.846Exchange Rate, Petroleum Prices and Price Determination in Sierra Leone 15
In a bid to gauge the impact of the disequilibrium from the cointegrated money
demand on inflation, the lagged error-correction term, ECMmd, is carried over the
parsimonious model of inflation. The deviation obtained from the cointegrated money
demand involving M, Y, TBR and P is stationary.
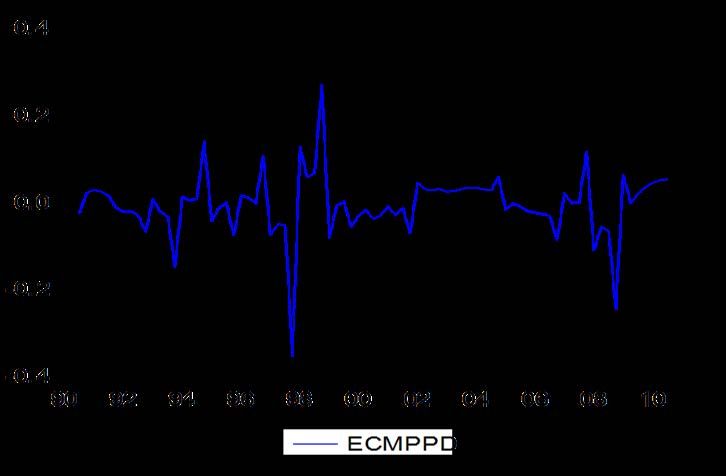
Model of petroleum price
T he estimates of the petroleum product specification are shown in Table 3. The
disequilibrium in the domestic pump price of petrol is obtained by taking the
deviation in the relative Brent price per barrel to the domestic pump, taking the exchange
rate into consideration. The deviation obtained in Table 3 is stationary after HP-filtering.
In addition to the deviation obtained from the cointegrated money demand function,
the lagged deviation from the petroleum product market is also carried over to the
parsimonious model of inflation (Appendix Figure 1 for the graphs of the disequilibria
from the different sectors). The pump price and barrel price series follow each other over
time as shown in Appendix Figure 1 and the associated disequilibrium graph appears
to be stationary.
Table 3: Petroleum pump price inflation
Variable Coefficient t-statistic
Constant 0.6519 3.81
LnE 0.5756 7.06
LnBP 0.4511 9.89
N=79, R2=0.968, Adj. R2=0.967
Normality(JB) = 0.04
Parsimonious inflation model for Sierra Leone
The research carried out a general-to-specific modelling and all the variables included in
the modelling process are in first difference and the model is estimated with OLS. The
estimation included the lagged error correction terms and the reported results are based
on models with 6 lags in the general ECM. The estimation results are shown in Table
4. The coefficient of the war dummy is not statistically significant in the estimation and
not reported, but the ECM of the pump price is included in the reported results in Table
4 for illustrative purposes, even though it is statistically insignificant.
The coefficient of lagged price variable is statistically significant, indicating some
degree of inflation inertia in the short run; i.e. there is a tendency for inflation to reproduce
itself from one period to the next. This finding is in consonance with the study carried by
Kovanen (2006) on the causes of frequent price changes in Sierra Leone. The coefficient
of GDP variable is also significant at the one per cent level, with the highest t-value and
biggest coefficient in the reported results. It explains most of the price waves in the short
run. This finding is consistent with an economy that is largely agrarian, as agriculture
contributes, on average, 40% of GDP.16 Thus, a fall in agricultural production will lead
to an upward movement in domestic prices.16 Research Paper 602
The coefficient of the money supply variable is also significant. This outcome is in
harmony with the studies undertaken by Kallon (1994) and Kovanen (2006). Broad
money’s coefficient was found to be significant and impacting on inflation on a monthly
basis, according to Kovanen. The coefficient of money supply is statistically significant
with a value of 0.27. This implies that in the short run, a unit increase in money supply
will increase inflation by 0.3 units. Another variable of monetary policy used by the
research is interest rate, proxied by the Treasury bill rate. The coefficient of this variable
is positive and significant. The Government of Sierra Leone heavily relies on the sale of
treasury bills to finance the revenue dwarfs in the budget, mostly for current consumption.
The Treasury bill rate is fundamental in raising the much needed revenue from the public.
Table 4: General-to-specific modeling
Variable Coefficient t-Statistic
Constant 0.0548 7.34
ΔP(t-1) 0.2462** 3.06
ΔY(t-3) -0.3498** -7.44
ΔM(t-4) 0.2672** 4.74
ΔE(t-4) 0.2266** 5.41
ΔR(t-4) 0.1902** 3.73
ΔPP(t-3) 0.1525** 5.99
ECMpp(t-1) 0.0169** 1.62
ECMmd(t-1) 0.0172** 3.10
Ygap(t-1) -0.0008** -5.86
Sigma = 0.0121341; RSS =0.00853966362; R2 = 0.84;
F(14,58) = 21.06 [0.000]**; log-likelihood = 226.87;
DW = 1.86;No. of observations = 73; No. of parameters = 15;
Mean(DLCPI) = 0.0346954; var(DLCPI) = 0.000711637
Diagnostic Tests
AR 1-5 test: F(5,27) = 0.74529 [0.5965]
ARCH 1-4 test: F(4,24) = 0.28264 [0.8863]
Normality test: Chi^2(2) = 0.264 [0.0022]
Hetero test: F(38,17) = 0.97996 [0.5404]
Chow test: F(22,34) = 0.70923 [0.7994] for break after 2005(1)
** Indicates significance at the 5% level
The coefficient of the exchange rate variable reported in Table 4 is significant at the
one per cent level. The exchange rate in Sierra Leone is on a free-fall throughout the
period of analysis and, as aforementioned, the average of imported goods as a percentage
of GDP between 2000 and 2010 was 40.75. This implies that depreciation in exchange
rate seeps to domestic prices. The coefficient of the exchange rate variable from the
estimation is 0.23, indicating that it has a stronger influence on inflation. This result is in
harmony with Canetti and Greene (1992), as the results of their investigation found that
both exchange rate movements and monetary expansion affect consumer price changes
in a number of SSA countries. In particular, the study revealed that exchange rates have
a significant causal impact on prices in Tanzania, Sierra Leone and DRC.
A prime variable of interest in this study is the pump price of petroleum products. The
reported coefficient in Table 4 shows that the pump price variable is highly significant and
carries the correct sign. The implication is that changes in the pump price of fuel affectsExchange Rate, Petroleum Prices and Price Determination in Sierra Leone 17
domestic prices in the short run. The t-value from the disequilibrium emanating from the
pump price of fuel (ECMpp) suggests that pump price is statistically insignificant in the
long run. The results of the estimation insinuate that the development in the pump price
of petroleum (PP) does not matter in price formation in Sierra Leone in the long run.
This finding is in tandem with Khan and Schimmelpfennig (2006) as it was concluded
for the case of Pakistan that wheat support price influence inflation in the short run but
not in the long run.
The output gap defining business cycle fluctuations is also important. The variable
explains the oscillations in domestic prices away from long-run equilibrium, even though
the coefficient is very minute. The tiny coefficient also translates into a minimal impact
on inflation in the long run. Apart from the output gap, the disequilibrium from the
monetary sector is also included in the estimation process, and the variable (ECMmd) is
significant at the one per cent level. This coefficient suggests that monetary environment
matters in price formation in the long run.
The reported results are based on models with six lags in the general parsimonious
ECM. An array of diagnostic tests is reported in Table 4 and seems to intimate that the
model is largely stable and does not exhibit neither serious generalized autocorrelation nor
evidence of heteroskedasticity. The overall goodness of fit of the model is comfortable;
i.e. a high percentage of the variation in domestic prices in Sierra Leone is explained
by the factors embedded in the parsimonious model.18 Research Paper 602
5. Conclusion and policy implications
T
his research explores the dominance of structural factors such as real GDP,
exchange rate and pump price of petrol and monetary factors (broad money and
treasury-bill rate) on domestic price determination in Sierra Leone by using a
parsimonious model of inflation. The approach specified error-correction equations
in which inflation responds to its own lags, lags of other variables, and a set of error-
correction terms that represent short run disequilibria that feed into the inflation process.
The essence is to examine whether the deviations from the long-run values explain future
inflation. The first specific objective was to examine the relative significance of the pump
price of petrol in determining inflation, and the second was exchange rate on inflation
while the research also analysed the effect of monetary factors.
The empirical results from the estimation show that lagged inflation has explanatory
power for subsequent inflation. The key result is that pump price of fuel as well as
exchange rate do play a part in the inflationary process at least in the short run. This
implies that changes in oil prices can only affect relative prices and not the inflationary
process, unless it attracts monetary expansion. The policy implication arising out of this
is that fiscal authorities can allow percolation of a sizeable pass-through in the short run.
Monetary factors (broad money and Treasury bill rate) and output are significant in
determining inflation in Sierra Leone, both in the short and long runs as the disequilibria
from the two markets also proved important. Since the study provides evidence that the
monetary environment as well as fluctuations in inflation play a role in the determination
of consumer prices in Sierra Leone, the policy implication is that by repressing money
growth and inflation, monetary policy could reduce the rate of inflation. Real GDP
negatively affects inflation. This implies that structural policies that will boost local
production of goods, especially food products, will help to stabilize prices. This is
due to the fact that the weight of food and non-alcoholic beverages in the CPI basket
is 51% and, coupled with a proportion of 60% of imported goods in the CPI basket, a
sustained increase in domestic production especially of the staple food (rice) might lead
to a downward spiral in CPI.
18Exchange Rate, Petroleum Prices and Price Determination in Sierra Leone 19
Notes
1. Gagnon and Ihrig (2004) suggested that it is the credibility of a country’s monetary policy
that ultimately determines how inflation reacts to the dynamics of exchange rate.
2. Exchange rate pass-through is defined as “the percentage change in local currency import
prices resulting from a 1% change in the exchange rate between the exporting and importing
countries.”
3. A fixed exchange rate regime was in place in the early 1980s but before that the leone
was pegged to the British pound between 1967 and 1978.
4. For example, the rate of inflation was 179% (the highest in the inflationary history of
Sierra Leone) in 1987.
5. For comprehensive details, see Statistics Sierra Leone CPI Report, various issues. The
CPI composition further reflects the nature of consumption and low levels of income, as
more than half of the goods in the basket are food items. The prices of food items, by their
very nature, are typically more volatile than the prices of non-food items.
6. The increase in transportation fares sometimes provokes an increase in the prices of local
foodstuffs and other essential goods brought to the major towns from rural areas.
7. The pump price of petroleum products is normally adjusted upwards or downwards
periodically as and when the combined effect of the changes in world market price and
the exchange rate leads to a minimum of 5% change in the landed cost of the product(s)
in the domestic currency.
8. The reason for this huge sacrifice on the part of the government is to enhance the welfare
of the consumers following the removal of the subsidy.
9. Pump price development is seen most times by many as a source of inflationary pressure
in Sierra Leone.
10. The Consumer Price Inflation is the retail price increase as measured by the year on year
percentage change in Consumer Price Index (CPI). CPI is the official measure of inflation
in Sierra Leone.
11. The HP filter is a model free-based approach used to decompos a time series into its trend
and cyclical components. Therefore, it is an algorithm that smoothens the original time
series.
1920 Research Paper 602
12. The civil war broke out in 1991 and its end was officially declared in January 2002.
13. See Appendix Table 1 for a complete listing of all variables and their abbreviations.
14. The deviations from GDP and pump price of fuel were made stationary by HP-filtering.
15. For full test details, see Johansen (1991).
16. The agricultural sector is dominated by small scale farmers, and production is almost
entirely subsistence and few cash crops such as cocoa, coffee and piassava are produced
for the export market.Exchange Rate, Petroleum Prices and Price Determination in Sierra Leone 21
References
Adam, C., D. Kwimbere, W. Mbowe and S. O’Connell. 2012. "Food prices and inflation in
Tanzania." Working Paper Series No 163 African Development Bank: Tunis, Tunisia.
Agénor, P. and P. Montiel. 1999. Development Macroeconomics. Princeton University Press:
New Jersey
Amano, R. A., and S. van Norden. 1998. “Exchange rates and oil prices.” Review of International
Economics, 6(4): 683–694.
Browne, F. And D. Cronin. 2010. “Commodity prices, money and inflation”. Journal of Economics
and Business, 62(4): 331–345.
Canetti, E., and J. Greene. 2000. “Monetary growth and exchange rate depreciation as causes of
inflation in African countries”. International Monetary Fund, Washington, DC. World Bank
Working Paper.
Chen, S.S. and H.C. Chen. 2007. “Oil prices and real exchange rates”. Energy Economics, 29(3):
390–404.
Choudhri, E.U. and D.S. Hakura. 2006. “Exchange rate pass-through to domestic prices: Does
the inflationary environment matter?”. Journal of International Money and Finance, 25(4):
614–639.
Cologni, A. and M. Manera. 2008. “Oil prices, inflation and interest rates in a structural
cointegrated VAR model for the G-7 countries”. Energy Economics, 30(3): 856–888.
Cunado, J. and F.P. de Gracia, 2005. “Oil prices, economic activity and inflation: Evidence for
some Asian countries”. The Quarterly Review of Economics and Finance, 45(1): 65–83.
Gagnon, J.E. and J. Ihrig, J. 2004. “Monetary policy and exchange rate pass-through”. International
Journal of Finance and Economics, 9(4): 315–338.
Hyder, Z. and S. Shah. 2005. "Exchange Rate Pass-Through to Domestic Prices in Pakistan,"
Macroeconomics, 0510020. University Library of Munich: Germany.
International Monetary Fund. 2005. "Sierra Leone: Ex-Post Assessment of Longer-term
Programme Engagement." International Monetary Fund Working Paper 05/192. .
Johansen, S. 1991. “Estimation and hypothesis testing of cointegration vectors in Gaussian vector
autoregressive models”. Econometrica, 1551–1580.
Juselius, K. 1992. “Domestic and foreign effects on prices in an open economy: The case of
Denmark”. Journal of Policy Modelling, 14(4): 401–428.
Kallon, K.M. 1994. “An econometric analysis of inflation in Sierra Leone”. Journal of African
Economies, 3(2): 199–230.
Khan, M.S. and A. Schimmelpfennig. 2006. "Inflation in Pakistan: Money or wheat?" International
Monetary Fund Working Paper 06/06.
Kovanen, A. 2006. "Why do prices in Sierra Leone change so often? A case study using micro-
level price data." International Monetary Fund Working Paper 06/53.
Leigh, M.D. and M.M. Rossi. 2002. "Exchange rate pass-through in Turkey." International
Monetary Fund Working Paper 02/204.
Leone, I.S. 2011. "Sixth review under the arrangement under the extended credit facility." No.
2122 Research Paper 602 10/176. IMF country report for Sierra Leone. Loening, J.L., D. Durevall, and Y.A. Birru. 2009. "Inflation dynamics and food prices in an agricultural economy: The case of Ethiopia." World Bank Policy Research Working Paper 4969. Lowinger, T.C. 1978. "Domestic inflation and exchange rate changes: The less-developed countries’ case." Weltwirtschaftliches Archiv, 114(1): 85–100. Menon, J. 1995. “Exchange rates and import prices for a small open economy”. Applied Economics, 27(3): 297–301. Murgasova, Z. 1996. "Exchange rate pass-through in Spain." International Monetary Fund Working Paper 96/114. Mussa, M. 2000. "The impact of higher oil prices on the global economy." International Monetary Fund. Mwase, N. 2006. "An empirical investigation of the exchange rate pass-through to inflation in Tanzania." International Monetary Fund Working Paper 06/150. Nugent, J.B. and C. Glezakos. 1979. “A model of inflation and expectations in Latin America”. Journal of Development Economics, 6(3): 431–446. Perera, W.T.K. 2005. “The impact of petroleum prices on inflation in Sri Lanka”. Stuff Studies, 35(1-2): 107–121. Rafiq, S., R. Salim and H. Bloch, H. 2009. “Impact of crude oil price volatility on economic activities: An empirical investigation in the Thai economy”. Resources Policy, 34(3): 121–132. Rowland, P. 2004. “Exchange rate pass-through to domestic prices: The case of Colombia”. Revista ESPE, 22(47): 106–125. Salvatore, D. 1984. “Petroleum prices, exchange rates, and domestic inflation in developing nations”. Weltwirtschaftliches Archiv, 120(3): 580–589. Salvatore, D. 1986. “Oil import costs and domestic inflation in industrial countries”. Weltwirtschaftliches Archiv, 122(2): 281–291. Taylor, J.B. 1999. "Staggered price and wage setting in macroeconomics." Handbook of macroeconomics, 1: 1009–1050. Vogel, R.C. 1974. “The dynamics of inflation in Latin America, 1950-1969”. American Economic Review, 102–114. Woo, W.T. 1984. "Exchange rate change and the prices of non-food, non-fuel items." Brooking Papers on Economic Activity, 2: 511–530.
Exchange Rate, Petroleum Prices and Price Determination in Sierra Leone                             23

Appendix A
Table 1A:      List of abbreviations
No.      Variable Name                                                                  Abbreviation
1        Consumer Price Inflation                                                           P
2        Real Gross Domestic Product (GDP)                                                  Y
3        Money Supply                                                                       M
4        Treasury Bill Rate                                                                 R
5        Brent Price per Barrel                                                             BP
6        Domestic Pump Price of Fuel                                                        PP
7        Exchange Rate                                                                      E
8        The difference between GDP and natural GDP                                         Ygap
9        Monetary disequilibrium from the cointegrated money demand equation                ECMmd
10       Error correction representing disequilibrium from the pump price                   ECMPP
11       War Dummy                                                                          Dw

Table 2A:       Summary statistics of selected variables in log levels
Statistical CPI Broad NEER Petroleum RGDP T-Bill
Measure		Money		Price		 Rate
Mean                    3.927         10.994          5.334         8.277          13.388     3.127
Median                  4.297         10.958          5.199         8.487          13.392     3.060
Maximum                 5.289         13.407          7.314         9.636          13.817     4.412
Minimum                 1.119          8.295          4.404         5.830          12.954     2.319
Std. Dev.               0.975          1.369          0.766         1.055           0.263     0.478
Skewness               -0.917         -0.060          0.587        -0.495          -0.024     0.825
Kurtosis                3.187          1.821          2.451         2.308           1.797     3.420
Jarque-Bera            11.902          4.919          5.815         5.041           5.013    10.032
Probability             0.003          0.085          0.055         0.080           0.082     0.007
Sum                   329.881        923.485        442.706       687.027        1111.167   259.519
Sum Sq. Dev.           78.945        155.620         48.073        91.226           5.687    18.769
Observations           84             84             83            83              83        83

Table 3A:      Johansen’s maximum likelihood cointegration test
No. of         Eigenvalue          Trace test          Maximum eigenvalue test
cointegrating 		          ________________________     ______________________
vectors                    Statistic       1% Critical  Statistic  1% Critical
		                                            Value 		               Value
None *                 0.4103          83.4595              84.45             36.9735       39.79
Notes:
(i) Trace test indicates 1 cointegrating vector at both 5% and 1% levels.
(ii) Max-eigenvalue test indicates 1 cointegrating vector at both 5% and 1% levels.

                                                    23
24
Appendix Table 3B
Cointegrating Eq: CointEq1
LMS(-1) 1.000000
LY(-1) -1.311307
(0.11089)
(-11.8258)
LTB(-1) -0.386196
(0.09964)
(-3.87590)
LP(-1) -1.347455
(0.05213)
(-25.8464)
c 13.13776
Error D(LM) D(LY) D(LTB) D(LP)
Correction:
CointEq1 -0.048163 0.044378 0.525468 0.043713
(0.01826) (0.01851) (0.08713) (0.01398)
(-2.63800) (2.39800) (6.03053) (3.12787)
D(LM(-1)) 0.518149 0.045267 0.032099 -0.071877
(0.14955) (0.15159) (0.71372) (0.11447)
(3.46482) (0.29863) (0.04497) (-0.62791)
D(LM(-2)) 0.158237 -0.019889 -0.671931 -0.019889 -0.671931 -0.019889
(0.13475) (0.13658) (0.64309) (0.13658) (0.64309) (0.13658)
(1.17433) (-0.14562) (-1.04485) (-0.14562) (-1.04485) (-0.14562)
D(LY(-1)) 0.093538 0.440173 -0.309610 0.440173 -0.309610 0.440173
(0.13296) (0.13478) (0.63458) (0.13478) (0.63458) (0.13478)
(0.70349) (3.26595) (-0.48790) (3.26595) (-0.48790) (3.26595)
continued next page
Research Paper 602You can also read