Fact Sheet: Deposit Return Systems Reduce Litter - Reloop ...
←
→
Page content transcription
If your browser does not render page correctly, please read the page content below
Factsheet:
Deposit Return Systems Reduce Litter
                                                                                        January 2021

         Fact Sheet: Deposit Return Systems Reduce Litter


                 Attaching a monetary value to beverage containers, in the form of refundable
                 deposits, decreases the likelihood that the containers will be littered or remain as
                 litter in the environment.

                 The impact of a DRS on litter reduction depends on a number of factors, including
                 the level of the deposit/refund and the program scope.

                 There are different ways to measure beverage containers as a proportion of litter,
                 each of which has its own advantages and pitfalls.

         Background
         The eyesore that is litter is an all too
         familiar sight in our cities and countryside.
         Aside from being unsightly, litter can have
         serious environmental, human health, and
         social effects, including reduced visual
         amenity, harm to our terrestrial and marine
         wildlife, and injuries from broken glass.
         There is also the economic cost of cleaning
         up litter and improperly discarded material,
         which is mostly borne by governments
         (including local governments), not the
         producers of packaged goods. In Europe,
         the total cost of cleaning up litter on land
                                                           i
         alone is estimated at €10 to 13 billion per year. By comparison, Keep America Beautiful
                                                                                             ii
         (KAP) estimates the annual cost to clean up litter in the U.S. to be $11.5 billion.
         In addition to increasing recycling rates, one of the main benefits of deposit-return
         schemes (DRS)—and one that cannot be accomplished without it—is litter reduction. Quite
         simply, this is because attaching a monetary value to a beverage container, in the form of a
         refundable deposit, decreases the likelihood that the containers will be littered or remain
         as litter in the environment, as consumers and other citizens will be motivated to return
         them for recycling so that they can claim the refund.
         It probably does not come as a surprise then that litter concerns were a primary reason
         why legislated DRSs were invented and passed in the first place. The first legislated
         system, established in British Columbia (Canada) in 1970, began as “The Litter Act” and
         was aimed at encouraging consumers to recycle beverage cans and bottles instead of
         tossing them to the side of the road. Many other DRSs introduced in the 1970s and 1980s
         were also mainly passed as anti-litter laws, including those in South Australia, Oregon,
         Vermont, and California, the latter of which’s legislation is aptly titled the “Beverage
         Container Recycling and Litter Reduction Act”.

         In New South Wales (NSW), the state government has identified DRS as one of the key
         actions it has implemented to achieve the objectives in the 2019-2022 NSW Litter
                              iii
         Prevention Strategy. The state’s decision to implement DRS in December 2017 was
         principally based on the results of a cost-benefit analysis where benefits to communities
                                                                                                  iv
         from litter reduction were estimated using their willingness to pay for decreased litter.
         The discussion document for the DRS decision stated that “by providing a reward, [DRSs]
                                                                                        v
         create a disincentive to litter and an incentive to pick up littered items.” Similarly,

         1
Factsheet:
Deposit Return Systems Reduce Litter

         Queensland’s DRS legislation (Queensland Waste Reduction and Recycling Amendment
         Act (2017) includes in its objects to “reduce the number of empty beverage containers that
                                               vi
         are littered or disposed to landfill.” The Tasmanian government’s decision to implement a
         DRS (planned for 2022) was also influenced by its ability to reduce littering behaviour;
         Environment Minister Elise Archer has publicly stated that “the scheme will encourage
         positive, incentivised recycling and re-use behaviours that will help reach our target of
                                                  vii
         becoming the tidiest state by 2023.”
         The effectiveness of DRS at reducing litter has also been recognized by the European
         Union. In 2019, the European Parliament and Council passed the Single-Use Plastic
         Directive, which introduced a wide range of measures to tackle commonly littered plastic
         that includes a requirement for member states to collect at least 90% of all single-use
         plastic bottles by 2029. The Directive specifically references DRS as a measure that could
         be taken to achieve this.

         Positive Impacts on Litter Reduction
                                                            Of course, the impact of a DRS on litter
                                                            reduction depends on a number of
                                                            factors, including the level of the
                                                            deposit/refund and the program scope.
                                                            For example, if a country only includes
                                                            beer and soft drinks in its DRS, littering
                                                            rates for those containers will differ
                                                            from littering rates for bottled water
                                                            containers that are excluded from the
                                                            program’s scope. In the same way,
                                                            littering rates will be higher in DRS
                                                            jurisdictions with lower deposit values,
                                                            as there is less of a financial incentive to
                                                            do the right thing.
         The most robust evidence of the impact of DRS on littering comes from the U.S., where
         government-funded studies examined beverage container litter pre- and post-DRS
         implementation in a number of states in the 1970s and 1980s. A review of these litter
         studies conducted by the Container Recycling Institute (CRI) found that beverage
         container litter reductions have consistently been between 70% and 84%, while total litter
                                                          viii
         has been reduced by between 34% and 47%. One study, which looked at beverage
         containers as a percentage of total litter in Hawaii, found a 60% reduction within three
                                       ix
         years of DRS implementation.
         There is also some robust evidence from Australia. According to the NSW Environmental
                                 x
         Protection Authority , prior to introducing the Return and Earn scheme, drink container
         litter made up 44% of the volume of litter in the state. Exchange for Change, the system
         coordinator for NSW’s DRS, reports that the program has contributed up to a 57%
         reduction of drink container litter by volume and an annual average of 40% reduction
                                                     xi
         compared to pre-scheme litter levels. Similar results have been reported in ACT
         (Australian Capital Territory) and Queensland, both of which introduced DRS in 2018. In
         ACT, an analysis conducted by Keep Australia Beautiful found that there has been a 40%
         decrease in the volume of eligible drinks container items in the litter stream since the
                                   xii
         scheme was launched. In Queensland, it is reported that the scheme has been responsible
         for a 54% reduction in beverage container litter and the elimination of 3 billion containers
                              xiii
         in the environment. Data has also shown a clear pattern of reduced beverage container
         litter in Northern Territory. In May 2012, just 5 months after Northern Territory introduced
         its DRS, there was some 39% less beverage container litter found than in November 2011
                                                                                xiv
         (before the DRS was introduced), and 46% less litter than in May 2011. There was an even
         greater reduction in beverage related items (e.g. bottle tops, plastic can holders, etc.) – a
                                                            xv
         52% reduction from November 2011 to May 2012.

         2
Factsheet:
Deposit Return Systems Reduce Litter
                                                                                         January 2021

         In Europe, we are only aware of one study that compared the amount of beverage
         containers in roadside litter before and after the implementation of DRS. Below is an
                                   xvi
         excerpt from that report, which describes the impact of the introduction of a DRS in
         Estonia:
         “Before the introduction of a deposit refund scheme in Estonia, the composition
              of litter along roadsides was analysed. It was done in the framework of a clean-up
         campaign that was organised in 2003. Beverage containers were up to 80 % of the
         litter collected. Plastic bottles and aluminium cans formed a major part of the beverage
            containers. After the deposit was introduced in Estonia (in 2005), the amount of litter
           along roadsides decreased significantly. The follow up roadside litter survey that
           was carried out two years after the DRS im plem entation in Estonia showed
          that the share of beverage containers had dropped below 10 % of all litter.”

         In addition to pre- and post-DRS litter surveys, a number of studies have been carried out
         to quantify the additional litter reduction benefits that could be achieved if an existing DRS
         were expanded, for example, by including a wider range of beverage containers in the
         program or by increasing the deposit. One such study, carried out by Eunomia Research
                         xvii
         and Consulting estimated that introducing a best-in-class DRS in California could further
         reduce the combined tons of aluminum and PET beverage containers littered across the
         state every year by 1,740 tons. For aluminum specifically, the study found that the tons of
         containers littered each year would decrease by 71%, while PET bottle litter would
         decrease by 51%. A similar study, also by Eunomia, found that increasing the level of the
         deposit to 10-cents (up from 5-cents) and widening the scope of Vermont’s existing bottle
         bill would likely decrease the number of beverage containers littered by as much as
              xviii
         66%.
         Various other studies have been undertaken to estimate the impact that a potential DRS
         could have on litter in countries or states without a deposit system currently in place. A
         study carried out by Government of Western Australia in August 2018, for example,
         estimated that the state’s future DRS (to be implemented in 2020), would result in 706
                                                                                    xix
         million fewer beverage containers being littered over a period of 20 years. Another study
         undertaken by Eunomia in 2017 assumed that a DRS in England would lead to an 80%
         reduction in littering of beverage containers subject to a DRS, and a 32% reduction in litter
                 xx
         overall. Key findings from a cost-benefit analysis of a Tasmanian DRS found that over a
         20-year period from 2014-15 to 2034-2035, a deposit system could reduce beverage
         container litter on the island state by an estimated 6,271 tonnes, a 35% reduction on
                             xxi
         baseline volumes. Based on expert opinions and results in other parts of Australia that
         had implemented DRS, a different study in New Zealand predicted that beverage container
         litter would fall by 70% after the introduction of a DRS, which would reduce overall
                                                                           xxii
         national litter volumes in the country by between 8.9% and 13.6%.
         Although less robust, other evidence
         that DRS has a positive impact on
         litter    reduction      comes     from
         comparisons       of   litter   amounts
         between deposit and non-deposit
         jurisdictions. A recent report by Keep
         South Australia Beautiful (KESAB)
         offers     one     such      comparison.
         According to KESAB’s 2018-2019 CDL
         Containers and Plastic Shopping Bags
         in the Litter Stream Report, beverage
         container litter currently represents
         only 2.9% of liter items in South
         Australia, where deposits have been
         mandatory since 1977, compared to
         14.2% in Western Australia, whose

         3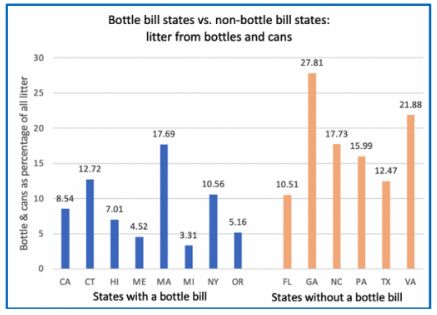
Factsheet:
Deposit Return Systems Reduce Litter
xxiii
DRS is only set to launch in October 2020. Further comparative evidence comes from a
2018 study published in Marine Policy by Australia’s national science agency CSIRO, which
evaluated the effectiveness of DRSs when it comes to litter reduction on the coasts of two
countries, Australia and the U.S. CSIRO concluded that “the proportion of containers found
in coastal debris surveys in states with [DRS] was approximately 40% lower than in states
without [DRS]. … These results provide strong evidence that fewer beverage containers
end up as mismanaged coastal waste in states that provide a cash refund for returned
xxiv
beverage containers.”
Similar evidence has been found in Europe, where in 2014, the Ocean Conservancy
surveyed beaches in Germany (which has a DRS) and Spain (which does not have DRS),
and found that the number of drinks containers littered per kilometer was more than 13
xxv
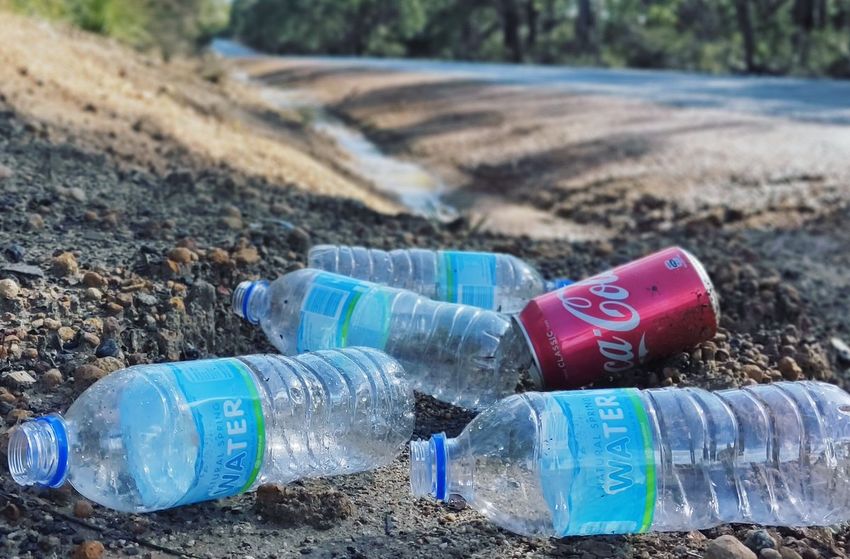
times higher in Spain (330 containers/km vs. 24 containers/km). In a more recent
(2020) study that compared litter data between states with and without bottle bills, Clean
Virginia Waterways of Longwood University found that plastic bottles, glass bottles, and
aluminum cans are approximately 2.5 times more frequently littered in Virginia (a state
without a bottle bill) than in U.S. states with bottle bills (see Figure 1). In Virginia, bottles
and cans accounted for nearly 22% of all litter recorded by volunteers in the 2019
International Coastal Cleanup. In contrast, in states with bottle bills, they accounted for
xxvi
8.69%, on average, of the total debris recorded.
Figure 1 Bottle Bill States vs. Non-Bottle Bill States: Litter from Bottles and Cans
Methodological Issues with Measuring Litter
When analyzing the results of litter studies, it’s important to recognize that such studies
often use different methodologies to quantify litter, which prevents direct comparisons
and harmonization of data across regions or time-scales. Part of the problem is that there
is no standardized system for quantification. In general, there are three ways to think
about, and measure, the overall amount of beverage container litter, and the proportion of
all litter that is comprised of beverage containers.
Some studies measure beverage container litter by weight, which is relatively easy and
provides a quick method for quantifying large numbers of containers that have been
collected during a survey. Weight measurements also make it possible to rapidly deal with
broken or fragmented material (e.g. glass bottles). Others surveys quantify litter by item
count, in which a cigarette butt is equivalent to a discarded plastic bottle, for example.
Still, others measure litter by volume. Depending on which one is used, estimates of
actual litter quantities can vary substantially. To illustrate, a litter composition study in the
4Factsheet:
Deposit Return Systems Reduce Litter
January 2021
Czech Republic concluded that PET bottles accounted for 30% of overall litter by weight,
xxvii
and 37% of litter by volume.
As noted by the Container Recycling Institute, another issue that must be taken into
consideration when comparing the results of litter surveys is that there is no standardized
xxviii
method for determining “deposition rates”, or clean-up and counting frequency. Some
surveys might be conducted a year after the last clean-up at a given study site, while
others might be conducted just a few days or weeks after. Studies also differ in the types
of areas or use patterns they survey. For instance, some litter surveys may be conducted
on roadsides while others are carried out in rivers, beaches, or parks. Even within a specific
area category, several other factors play a role, such as traffic densities on urban vs. rural
roads. The entities that fund the studies can also vary; for example, some studies may be
funded by non-profit organisations while others are funded by the beverage industry. Even
studies that employ similar methodologies can generate different results (e.g. depending
on how and the extent to which small items of litter (size threshold) are counted). Clearly,
these methodological variations will impact the results of litter surveys.
Different stakeholders have varying opinions on which of these methodologies are most
relevant to the discussion. Most survey protocols recommend one or more of these
methods with “item counts” being the predominant approach. Irrespective of current
usage, each of these methods has its advantages and pitfalls.
Reloop believes that the “best methodology” depends on the issue we’re attempting to
address. For instance, if we are looking at litter in the context of rising waste collection
costs, then it is likely that volume is the most relevant measure as beverage containers are
generally of large volume relative to their weight, compared to other types of waste.
Voluminous waste types cause collection containers to fill up quickly and thus require a
higher collection frequency, which increases costs. Volume is also a relevant measure if we
are talking about visual amenity. While they may not weigh as much as other types of litter
and may not be as common as cigarette butts or chewing gum in terms of count, research
by Keep Scotland Beautiful (2007) suggests that people consider large or highly visible
xxix
items of food and drink packaging to be the most irritating types of litter.
Final Thoughts
Beyond increasing recycling rates, litter reduction is one of the primary benefits of DRS.
No other method of beverage container collection has proven, in and of itself, to be nearly
as effective at reducing litter rates. From an industry perspective, DRS not only helps
reduce public pressure around the litter problem, but secures larger quantities of clean
feedstock to use as recycled content in their new bottles. As governments around the
world consider their options to solve the complex challenges of packaging waste over the
coming years, DRS should be front and centre.
Reloop is a broad platform of like-minded interests that share a common vision for a circular
economy. The founding members of the organisation bring together industry, government, and
non-governmental organisations to form a network for advances in policy that create enabling
system conditions for circularity across the global economy. With members coming from different
sectors, the platform aims to work as a catalyst in order to generate economic and environmental
opportunities for all stakeholders in the value chain. This includes producers, distributors, recyclers,
academia, NGOs, trade unions, green regions, or cities.
Want to learn more about Reloop and keep up-to-date with our latest work?
Follow us on Twitter @reloop_platform or visit our website at www.reloopplatform.org.
5Factsheet:
Deposit Return Systems Reduce Litter
Endnotes
i
“Robertson, D. “Absolute Rubbish! The Litter Crisis in Europe.” Accessed August 5, 2020 from
https://visual.ly/community/Infographics/environment/litter-crisis-europe-infographic
ii
Hampton VA. “Keep America Beautiful: Litter Research.” Accessed August 5, 2020 from
https://hampton.gov/958/Keep-America-Beautiful-Litter-Research
iii
NSW Government. December 2019. “NSW Litter Prevention Strategy 2019-2022.” Accessed 21 August 2020 from
https://www.epa.nsw.gov.au/-/media/epa/corporate-site/resources/litter/19p1753-litter-prevention-
strategy.pdf?la=en&hash=37A13D05A443F1532AE98E6306E15BC2EF77C64B
iv
Sapere Reseach Group. August 2017. “Cost-benefit analysis of a Container Deposit Scheme.” Report for the
Auckland Council. Accessed 21 August 2020 from http://www.wasteminz.org.nz/wp-
content/uploads/2017/12/Container-Deposit-CBA-Report-Final.pdf
v
New South Wales Environment Protection Authority (2015) Op cit. p.15, as cited in Sapere Research Group,
August 2017, “Cost-benefit analysis of a Container Deposit Scheme.” Accessed 21 August 2020 from
http://www.wasteminz.org.nz/wp-content/uploads/2017/12/Container-Deposit-CBA-Report-Final.pdf
vi
Marsden Jacob Associates. April 2018. “Final Report – A Model Framework for a Container Refund Scheme in
Tasmania.” Report prepared for EPA Tasmania. Accessed 21 August 2020 from
https://dpipwe.tas.gov.au/Documents/Marsden%20Jacob%202018%20CRS%20Model%20Framework.pdf
vii
Jarvie, E. 6 June 2019. “Tasmanian government commits to introducing container refund scheme.” The
Advocate. Accessed 21 August 2020 from https://www.theadvocate.com.au/story/6204281/tasmania-to-
implement-container-refund-scheme-by-2022/
viii
Container Recycling Institute. Bottle Bill Resource Guide: Litter Studies in Bottle Bill States.” Accessed August 5,
2020 from http://www.bottlebill.org/index.php/benefits-of-bottle-bills/litter-studies-in-bottle-bill-states
ix
Ocean Conservancy International Coastal Cleanup, 2003-2011
x
NSW Government. “Return and Earn: NSW recycling success story.” Accessed 20 August 2020 from
https://www.exchangeforchange.com.au/_cache_51b2/content/6531970000008035.pdf
xi
Exchange for Change. “Return and Earn Annual Statutory Report 2018-2019.” Accessed from
https://www.exchangeforchange.com.au/who-we-are/publications-and-reports.html
xii
Exchange for Change. “2018-2019 ACT CDS Annual Statutory Report.” Accessed from
https://www.exchangeforchange.com.au/who-we-are/publications-and-reports.html
xiii
Container Exchange (CoEX). “Annual Report 2019-2020.” https://containerexchange.com.au/wp-
content/themes/coex160620/annual-report/dist/img/ce-report.pdf
xiv
Boomerang Alliance. February 2013. “Independent Review: The Northern Territory Container Deposit System.”
Accessed 2 September 2020 from
http://www.bottlebill.org/assets/pdfs/campaigns/australia/NT%20CDS%20Report%20Final_180213.pdf
xv
ibid.
xvi
Balcers, O., Brizga, J., and H. Morra. (2019). “Deposit Return Systems for Beverage Containers in the Baltic
States. Riga: Green Liberty. Accessed August 5, 2020 from
https://www.researchgate.net/publication/332242306_Deposit_Return_Systems_for_Beverage_Containers_in_t
he_Baltic_States_Riga_Green_Liberty
xvii
Eunomia Research and Consulting. May 2020. “California: Environmental & Social Impacts of a Failing Bottle
Bill.” Accessed August 5, 2020 from https://www.eunomia.co.uk/reports-tools/california-bottle-bill/
xviii
Eunomia Research and Consulting. March 2020. “Impacts of Increasing Vermont’s Bottle Bill Scope and Deposit
Value.” Accessed August 6, 2020 from https://www.eunomia.co.uk/reports-tools/impacts-of-increasing-
vermonts-bottle-bill-scope-and-deposit-value/
xix
Government of Western Australia, Department of Water and Environmental Regulation. August 2018.
“Consultation Regulation Impact Statement: Western Australia Container Deposit Scheme.” Accessed August 5,
2020 from https://www.wa.gov.au/sites/default/files/2019-12/cris-wa-container-deposit-scheme.pdf
xx
Eunomia Research and Consulting. October 2017. “Impacts of a Deposit Refund System for One-Way Beverage
Packaging on Local Authority Waste Services – Final Report.” Accessed August 5, 2020 from
https://www.sas.org.uk/wp-content/uploads/Financial-impacts-of-a-DRS-on-Local-Authority-Waste-Services.pdf
xxi
Marsden Jacob Associates. 16 April 2014. “Final Report: Cost Benefit Study of a Tasmanian Container Deposit
System – Final Report.” Accessed 21 August 2020 from
https://dpipwe.tas.gov.au/Documents/Marsden%20Jacob%202014%20Tasmanian%20CDS%20Cost_Benefit%20S
tudy.pdf
xxii
Sapere Research Group. August 2017. “Cost-benefit analysis of a Container Deposit Scheme.” Report for the
Auckland Council. Accessed 21 August 2020 from http://www.wasteminz.org.nz/wp-
content/uploads/2017/12/Container-Deposit-CBA-Report-Final.pdf
xxiii
KESAB Environmental Solutions. December 2019. “CDL Containers and Plastic Shopping Bags in the Litter
Stream 2018-19.” Accessed August 6, 2020 from https://www.epa.sa.gov.au/files/14628_kesab_cdl_2019.pdf
xxiv
Schuyler, Q. et al. (2018). “Economic incentives reduce plastic inputs to the ocean.” Marine Policy, 96, 250-255.
https://www.sciencedirect.com/science/article/abs/pii/S0308597X17305377
xxv
Association for the Protection of Rural Scotland (APRS). 2017. “Have You Got the Bottle? A Modern Deposit
Return System for Scotland.” Accessed August 6, 2020 from http://www.haveyougotthebottle.org.uk/wp-
content/uploads/2017/08/APRS-Holyrood-submission.pdf
xxvi
Clean Virginia Waterways of Longwood University. 2020. “Report: Littered Bottles and Cans: Higher in Virginia
Than in States with Bottle Bills.” https://drive.google.com/file/d/1wyDpBGJcjUj6uOuddgOuzg_OK3w8lRpW/view
6Factsheet:
Deposit Return Systems Reduce Litter
January 2021
xxvii
SPF Group. 2007. ANALÝZA VOLNĚ POHOZENÝCH OD PADŮ V ČESKÉ REPUBLICE. Accessed 2 September
2020 from http://data.idnes.cz/soubory/vedatech/95A100219_TAJ_ANALYZAVOLNEPOHOZENYCH.PDF
xxviii
Container Recycling Institute. April 2015. “Estimating Beverage Container Litter Quantities and Cleanup Costs
in Michigan.” Accessed August 6, 2020 from
http://www.bottlebill.org/assets/pdfs/benefits/MichiganLitterCleanupCosts%20FINAL%20April2015.pdf
xxix
Zero Waste Scotland. “Rapid Evidence Review of Littering Behaviour and Anti-Litter Policies.” Accessed 2
September 2020 from
https://www.zerowastescotland.org.uk/sites/default/files/Rapid%20Evidence%20Review%20of%20Littering%20
Behaviour%20and%20Anti-Litter%20Policies.pdf
7You can also read