Feasibility Study of Municipal Contraction Requested In October 2020 Citizen Petition - April 15, 2021
←
→
Page content transcription
If your browser does not render page correctly, please read the page content below

Feasibility Study of Municipal Contraction
Requested In October 2020 Citizen Petition

              April 15, 2021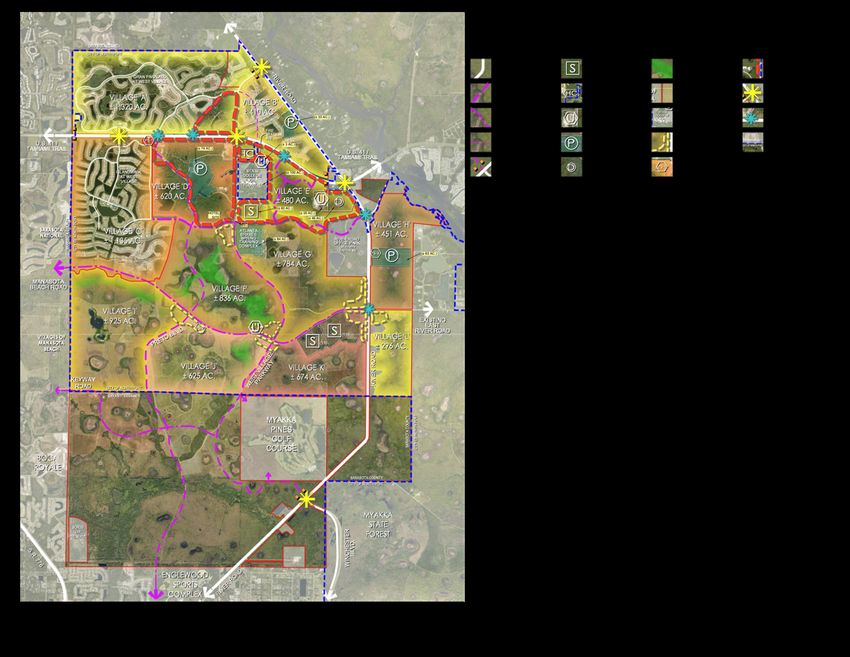
Table of Contents

Section 1. Background                                                  1
  A. Citizen Petition For Contraction of City of North Port Boundary   1
  B. Statutory Process For Contraction By Petition                     2
  C. Feasibility Report                                                4

Section 2. Financial Considerations of Contraction                      6
  A. Fiscal Impact Overview                                             6
  B. Fiscal Analysis Approach                                          11
  C. Fiscal Impacts on City Funds                                      14
  D. Effects on Residents in the Contraction Area                      20

Section 3. Effects of Contraction on Service Delivery                  23
  A. Fire and EMS Services                                             23
  B. Continuity of Fire Rescue Services After Contraction              27
  C. Law Enforcement Service Considerations                            28
  D. Continuity of Law Enforcement Services After Contraction          31
  E. Solid Waste and Recycling                                         32
  F. Continuity of Solid Waste Services After Contraction              32
  G. Code Enforcement                                                  33
  H. Building Permits and Inspections                                  33
  I. Planning and Zoning                                               34
  J. Water and Wastewater                                              35
  K. Streets, Roads, and Drainage                                      37

Section 4. Additional Issues Related to the Contraction Petition       39
  A. Impact on Future Bond Capacity and Bond Ratings                   39
  B. Hurricanes and Public Emergencies                                 40
  C. Dilution of Resident Representation                               41
  D. Renegotiating Existing Obligations and Agreements                 42
  E. Damaging City’s Long-Range Plan for Economic Diversity            43
  F. Damage to Local Economy from Delays in Development Activity       45
  G. Need to Re-District the City Commission Districts                 47

Section 5. Statutory Framework For Contraction by Petition             49
  A. Contraction Criteria                                              49
  B. Characteristics of the Contraction Area                           50
  C. Application of Contraction Criteria to Contraction Area           55
  D. Conclusion of Statutory Analysis                                  65

                                             i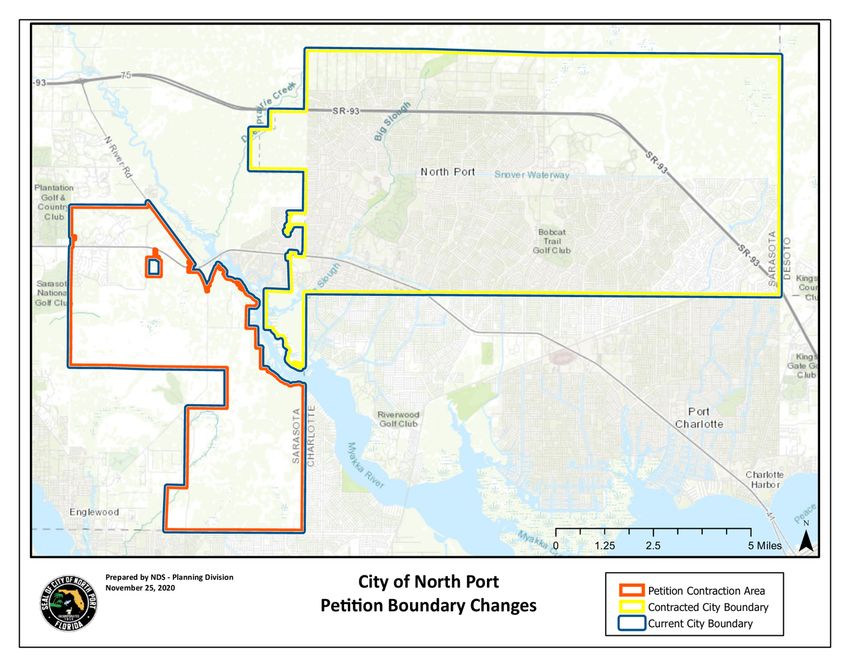
SECTION 1. BACKGROUND
           A.       CITIZEN PETITION FOR CONTRACTION OF CITY OF NORTH PORT BOUNDARY
This Contraction Feasibility Study for the City of North Port, Florida (“City”) has been prepared to
identify and analyze fiscal and other impacts to the City of North Port related to a citizen petition
for municipal contraction filed with the City on October 28, 2020, (“Contraction Petition” or
“Petition”) pursuant to Florida Statutes §171.051(2).1 This citizen-initiated petition was organized
and sponsored by the West Villagers for Responsible Government (“WV4RG” or “Petitioner”). The
Contraction Petition filed with the City on October 28, 2020 requests that the municipal boundaries
of the City of North Port be contracted to remove “all lands west of the Myakka River from the City
of North Port Municipal Boundary.”2 The lands west of the Myakka River that are within the City
of North Port and proposed for removal from the City boundaries are referred to as the
“Contraction Area” in this Report.
The proposed Contraction Area consists of lands located within the West Villages Improvement
District (“WVID”) including approximately 8,730 acres,3 the Myakka State Forest and Southwest
Florida Water Management District (“SWFWMD”) Park/Preserve lands of approximately 6,982
acres, and some additional parcels comprising approximately 243 acres of land within the City

1
  F.S. §171.051 Contraction procedures. —Any municipality may initiate the contraction of municipal boundaries
in the following manner:
          (1) The governing body shall by ordinance propose the contraction of municipal boundaries, as described in
the ordinance, and provide an effective date for the contraction.
          (2) A petition of 15 percent of the qualified voters in an area desiring to be excluded from the municipal
boundaries, filed with the clerk of the municipal governing body, may propose such an ordinance. The municipality to
which such petition is directed shall immediately undertake a study of the feasibility of such proposal and shall, within
6 months, either initiate proceedings under subsection (1) or reject the petition, specifically stating the facts upon
which the rejection is based.
                                                           ***

2
  Cover/Transmittal Letter Submission of Petition by Qualified Voters, submitted to City of North Port on Oct. 28,
2020. A previous petition for contraction was constructively withdrawn upon submittal of the Oct. petition pursuant
to a Joint Stipulation Regarding Submission of Petition executed by the City and by representatives of West Villagers
for Responsible Government, a political committee, and West Villagers for Responsible Government, Inc. The
previous petition proposed to exclude only lands within the West Villages Improvement District located within the
City boundaries.

3
    Source: Map of City of North Port West Villages, prepared by NDS – Planning Division, August 11, 2020.

                                                   Page 1 of 68
boundary but not part of WVID or the SWFWMD lands.4 A map illustrating the Contraction Area
requested in the October 2020 Contraction Petition is included as Figure 1 in this Report (“City of
North Port Petition Boundary Changes”, prepared by NDS – Planning Division, Nov. 25, 2020).
Figure 1 – Map of Petition Contraction Area Boundary

        B. STATUTORY PROCESS FOR CONTRACTION BY PETITION
To provide a framework for consideration of the Contraction Petition, it is helpful to briefly review
the statutory process and requirements for such petitions. The Florida Legislature has established
contraction procedures and criteria for municipal contractions in Florida Statutes Chapter 171, the
Municipal Annexation or Contraction Act (“Act”). As stated in F.S. §171.021, the purposes of the

4
 Acreage of areas within the Contraction Area but outside the boundaries of the WVID is based on acreage data
available on the Sarasota County Property Appraiser’s website and review of maps prepared by NDS – Planning
Division.

                                               Page 2 of 68
Act are to:
       “… set forth procedures for adjusting the boundaries of municipalities through
       annexations or contractions of corporate limits and to set forth criteria for
       determining when annexations or contractions may take place so as to:
       (1) Ensure sound urban development and accommodation to growth.
       (2) Establish uniform legislative standards throughout the state for the adjustment of
       municipal boundaries.
       (3) Ensure the efficient provision of urban services to areas that become urban in
       character.
       (4) Ensure that areas are not annexed unless municipal services can be provided to
       those areas.”
Consideration of a municipal contraction by petition is provided for in F.S. §171.051(2). A petition,
filed with the municipal clerk, of 15 percent of the qualified voters of an area desiring to be
excluded from a municipality may propose a boundary contraction. Upon verification of the
signatures, the municipality must study the feasibility of the proposal. F.S. §171.052 provides that
only those areas which do not meet the criteria for involuntary annexation in s. 171.043 may be
proposed for exclusion. Stated another way, if a proposed contraction area fulfills the criteria in
F.S. §171.043, then the proposed area is not eligible for contraction. This Section of this Report
reviews the specific statutory criteria as applied to the proposed Contraction Area and Petition.

Pursuant to F.S. §171.051(2) and after a study of the feasibility of the proposed contraction, the
City shall either: (1) initiate proceedings to contract its boundaries by proposing an ordinance using
the statutory process in F.S. §171.051(1), or (2) reject the petition, specifically stating the facts
upon which the rejection is based. The Act does not restrict the reasons and facts on which the
Commission may base its decision on the proposed petition. The Florida Office of the Attorney
General, in AGO 76-221, has opined that, in addition to compliance with F.S. §171.043 being
sufficient grounds for rejecting a petition for contraction, “a municipal governing body would
appear to have broad discretion under the statute to reject any such petition, so long as it

                                          Page 3 of 68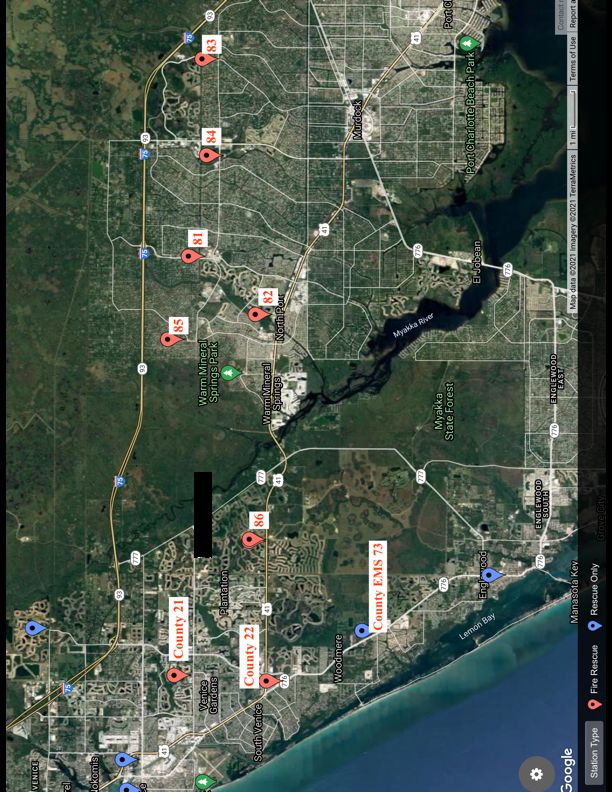
specifically states its reasons therefor.”5 A Circuit Court decision upholding the denial by the City
of Polk City of a contraction petition illustrates how the City’s decision on the Contraction Petition
might be reviewed if its decision were to be challenged.6 In finding that Polk City’s stated reasons
for denial, the Chief Judge held that the City followed the essential requirements of the law and
that the City Council’s decision was supported by competent substantial evidence. In that case, a
feasibility report indicated negative financial impacts on the City if the contraction were approved.
The policies reflected in the purposes of the Act are relevant for the City Commission to consider
in addition to the City’s Comprehensive Plan and related planning documents and the fiscal and
other impacts discussed in this Report when evaluating the proposed Contraction Petition.
Information and analysis provided in this Report is intended to assist the City Commission with
review of the feasibility and advisability of removing the Contraction Area from the City’s
boundaries as proposed in the Contraction Petition.

         C. FEASIBILITY REPORT
This Feasibility Report, prepared to fulfill the requirement of F.S. §171.051(2), identifies a range of
issues and impacts related to removal of the Contraction Area from the municipal boundaries of
the City for consideration by the City of North Port City Commission (“Commission”). The City has
engaged Munilytics, Inc. to provide this Contraction Feasibility Study. This Report discusses
projected fiscal impacts to the City over the period of FY2022 through FY2026 (see SECTION 2),
potential impacts on the provision of municipal services within the Contraction Area (see SECTION
3), and a range of additional issues including the inability of the City to achieve adopted long-range
and short-term planning goals and objectives, the necessity of renegotiating many existing

5
  Florida AGO 76-221. “[I]it would certainly seem that a finding of compliance with s. 171.043 would constitute
sufficient grounds for rejecting a petition for initiation of contraction procedures. However, a municipal governing
body would appear to have broad discretion under the statute to reject any such petition, so long as it specifically
states its reasons therefor.”

6
   See, Order denying Petition for Writ of Certiorari, Orlampa, Inc. v City of Polk City, 2010CA-007881, Tenth Judicial
Circuit for Hardee, Highlands, and Polk County, Florida, Nov. 23, 2011 (upholding Polk City Council’s rejection of
petition for contraction finding City’s decision was supported by competent substantial evidence; City’s reasons
were: (1) insufficient number of petition signatures, (2) feasibility study demonstrated an adverse financial impact to
the City, and (3) excluding the property from the City would not be feasible based on the economic loss to the City).

                                                  Page 4 of 68
interlocal agreements and development agreements, potential disruption of ongoing capital
facilities planning and construction, and difficulties posed for the transition of existing
development approvals and rights from the City to Sarasota County (see SECTION 4). In addition,
the Report analyzes the Contraction Area under the statutory criteria for contraction in the context
of existing conditions within the City and the Contraction Area and under the framework of the
stated purposes of the Act (see SECTION 5). The Commission may reasonably consider any and all
of these facts, including impacts, issues, and concerns, in reaching its decision to propose a
contraction ordinance or to reject the Contraction Petition. If the Commission decides to reject
the Petition, the facts and reasons for the rejection must be stated.

                                         Page 5 of 68
SECTION 2. FINANCIAL CONSIDERATIONS OF CONTRACTION

          A. FISCAL IMPACT OVERVIEW
The financial impact on the City that would result from removal of the Contraction Area from the
City boundaries is significant. We estimate that the first five years (FY22-FY26) would result in a
net loss of $20,947,358 to the City of North Port. Over the 5-year projection period, the City is
projected to see a reduction of $58,526,291 in revenue and potentially save $37,578,933 in
reduced expenditures. The first year the net loss to the City would be $3,908,209. It is unlikely
that the City could reduce expenditures enough to offset the total anticipated revenue loss. These
losses combine across the City’s General Fund and Special Revenue funds (Road and Drainage Fund,
Fire Rescue District Fund, Sold Waste District Fund, Surtax III Fund). We expect the City’s Water
and Sewer Utilities Fund to generate 25% or more operating revenue on the same expenses
assuming that the City levies the maximum state-allowed municipal surcharge on non-City
customers, or those utility customers within the Contraction Area. We have not considered the
City’s non-major funds in this analysis as we believe they are either not impacted by contraction,
not material to the City’s operation, have by law revenues that should match expenditures over
time, or are essentially internal operation funds charged back to other funds and therefore
eliminated. Table 1 summarizes the net effect across the studied funds:
Table 1. Financial Impact of Contraction Across All Funds
                                                      City of North Port, Florida
                                                      Fiscal Impact Contraction
                                                          Reduction Impact
                Fiscal Year                    2022             2023           2024           2025           2026          Cumulative
Estimated Total Revenue Reduction General
 Fund, Road & Drainage, Fire Rescue, Solid
           Waste, Capital (Surtax)            $9,406,645       $10,192,191    $10,989,637    $11,799,341    $12,621,669     $58,526,291
  Estimated Total Expenditure Reduction
General Fund, Road & Drainage, Fire Rescue,
        Solid Waste, Capital (Surtax)          $5,498,436       $6,058,781     $6,619,126     $7,179,471     $7,514,922     $37,578,933
            City Net Shortfall                ($3,908,209)     ($4,133,410)   ($4,370,511)   ($4,619,870)   ($5,106,747)   ($20,947,358)

The expenditure reductions are forecast using population projections and a per capita cost
approach to City services, excluding those services funded through the three assessment districts
operated by the City. We have assumed that certain City services and associated expenditures,
such as City Commission, City Attorney, City Manager, City Clerk, Finance, Information Technology,
and Human Resources and other functions would not be reduced at all. It does not appear that

                                                             Page 6 of 68
any Parks and Recreation expenditures could be reduced, either. These operations would likely
exist in the same manner as they do now, regardless of whether the Contraction Area is removed
from the City. It can be expected that much of the almost $21 million in reduced net revenue
would need to be recovered from the portion of the City that remains incorporated after the
contraction, most likely in the form of higher property taxes and increased fire and road and
drainage assessments. Alternatively, or in combination with property taxes and fire assessments
increases, residents and businesses could see a reduction in the level of services, most notably
police and fire services. The major funds within the City’s financial structure would experience
reduced funding after the contraction and would need to reduce expenses and/or generate
increased revenue from the remaining residents and businesses in the City.
The General Fund is expected to see a reduction of more than $33 million over the five-year study
period. Property tax revenue reductions using the current millage rate levy occur because of the
loss of the tax base in the Contraction Area. We have assumed 400 additional homes are added
each year, and we believe that to be conservative (meaning more homes than projected could be
added and increase the projected losses to the City). Utility, franchise and communications
services taxes will be reduced because the homes and businesses within the Contraction Area that
consume utilities will no longer pay those taxes to the City.     State shared revenues such as
municipal revenue sharing and the half-cent sales tax will be reduced because they are distributed
to the City by the state using formulas which are largely population driven. Taxes on commercial
property insurances that are used to help pay for police and fire pensions will be reduced as those
properties will now be in the unincorporated area and not subject to any taxes imposed by the City.
The City will still have to pay for those benefits to employees from other revenues. Business tax
receipts on the commercial properties with the Contraction Area will also no longer contribute to
City revenue. Table 2 details the projected reduction in revenue to the City’s General Fund if the
Contraction Area is removed from the City:

                                         Page 7 of 68
Table 2. Forecasted Reductions in General Fund Revenues
                                                   City of North Port, Florida
                                                   Fiscal Impact Contraction

                Fiscal Year                 2022            2023             2024          2025           2026         Cumulative
                                      Estimated Revenues Reduction Due To Contraction
Ad Valorem Taxes                             4,156,182       4,551,323       4,958,318      5,377,523      5,809,304     24,852,650
Insurance Premium Tax Fire                      12,498          12,873          13,259         13,657         14,066        $66,353
Insurance Premium Tax Police                    30,638          31,558          32,504         33,480         34,484      $162,664
Electric Utility Tax                         $127,615        $139,191         $150,767       $162,343       $173,919      $753,833
Communication Services Tax                   $182,435        $199,349         $216,263       $233,177       $250,090     $1,081,314
Local Business Tax                              $7,741          $7,981          $8,228         $8,483         $8,746        $41,179
Electric Franchise Fee                       $465,746        $507,994         $550,242       $592,490       $634,738     $2,751,212
Municipal Revenue Sharing                    $172,415        $188,400         $204,385       $220,369       $236,354     $1,021,923
Half Cent Sales Tax                          $571,239        $624,199         $677,159       $730,120       $783,080     $3,385,797
   Total General Fund Revenue Reduction      5,726,509      $6,262,867      $6,811,125     $7,371,641     $7,944,782     34,116,925

Excluding the Contraction Area from the City leaves the City with an assessed taxable value of
$3,883,561,732 in FY2020-21 (FY2021). In order to replace the initial revenue reductions, without
consideration of any expenditure reductions, the Commission would be required to increase the
millage rate from the current 3.7667 mills to 4.8369 mills (a 28.4% increase) just to replace the ad
valorem tax revenue reduction. An increase to 5.0552 mills (a 38.3% increase) would be needed
to replace all the projected reduced income, including property taxes as well as other revenues, in
the first year of the contraction. Adopting these higher millage rates would increase the property
tax burden on those properties remaining in the City after removal of the Contraction Area. The
impact on the single-family homeowner in the City with an average assessed taxable value of
$109,735 would be a property tax increase of $117.44 or $158.16, respectively.

Table 3. Effect on City’s Millage Rate After Contraction
                                                                            Mills        Millage Rate
                            Current Millage Rate FY21                    0.0037667               3.7667
   Single Family Average Taxable Value       $109,735
             Advalorem Taxes Lost                                        0.0010702
           Ad Valorem Tax Increase                        $117.44        0.0048369                4.8369 New Millage Rate
                                                                                                   1.0702 Increase

All Revenue lost in 2022 including ad valorem                            0.0052080                5.2080 New Millage Rate
           Ad Valorem Tax Increase                        $158.16        0.0014413                 1.4413 Increase

                                                         Page 8 of 68
Furthermore, the City’s special revenue funds would also experience reductions in revenues from
removal of the Contraction Area. These reductions will require a reduction in expenditures
(meaning service efforts), increased property taxes, and/or increased special assessments.
The Fire Rescue District would experience an initial drop in special assessment revenue of over $1.4
million based on the FY21 assessments billed and an almost $10 million revenue reduction over
the 5-year forecasted period. In order to accommodate the disruption in assessment revenue, it is
highly likely that expenditures and/or services would be reduced or assessments increased on the
remaining property owners in the City. Table 4 details the expected revenue losses each year based
upon the current assessment rates and the expected number of new properties added each year
in the Contraction Area. The forecast is based on average revenue of $317 per new home (includes
an average assessment of $245 per home plus $72 per home as a proxy for new non-residential
construction) applied to the projected 400 new homes per year.
Table 4. Forecasted Reductions in Fire Assessment District Revenues
City of North Port, Florida
Fiscal Impact Contraction
Fiscal Year 2022 2023 2024 2025 2026 Cumulative
110 Fire Rescue District Estimate Revenue Contraction Reduction
Fire/Rescue Assessment $1,446,291 $1,573,091 $1,699,891 $1,826,691 $1,953,491 $9,818,947
The Road & Drainage District fund would have almost a $500,000 reduction in revenue the initial
year after contraction and more than $3 million over the 5-year forecast period. Most of this will
result in reduced maintenance and improvements. The revenue reduction occurs because the
County 9th Cent fuel tax, the state’s 5-cent and 6-cent fuel taxes, and the portion of municipal
revenue sharing allocated to transportation needs are distributed based upon the City’s population,
which will be reduced if the Contraction Area is removed. The City also levies a small Road &
Drainage District special assessment in the Contraction Area and would no longer collect those
assessments as well. To avoid potentially violating bond covenants and risking litigation, and to
avoid burdening remaining residents and businesses with those obligations, which were incurred
at least in part for the benefit of properties in the Contraction Area, the City and the County should
try to enter into an agreement for the County to collect those amounts from property owners in
Page 9 of 68the Contraction Area to then be transferred to the City until the bonds are paid off. Table 5 details
the various revenues for the Road and Drainage District fund and the forecasted reduced revenue:
Table 5. Forecasted Road and Drainage District Fund Revenue Reductions
City of North Port, Florida
Fiscal Impact Contraction
Fiscal Year 2022 2023 2024 2025 2026 Cumulative
107 Road & Drainage District Revenue Contraction Reduction
County 9th Cent Fuel Tax $24,516 $25,824 $27,131 $28,439 $29,747 $158,865
1st Gas Tax 1 - 6 Cent $125,078 $131,751 $138,424 $145,097 $151,770 $810,523
2nd Gas Tax 1 - 5 Cent $92,250 $97,172 $102,093 $107,015 $111,937 $597,794
Revenue Sharing Muni Gas Taxes $49,454 $52,092 $54,730 $57,369 $60,007 $320,467
Road Maintenance Assessment $195,257 $203,845 $212,433 $221,021 $229,609 $1,248,833
$486,553 $510,683 $534,812 $558,941 $583,070 $3,136,483
Solid Waste assessments would initially decline by over $1 million, culminating in over $7 million
revenue reduction during the forecast period. These assessment revenues are levied on benefitted
properties, which, in the case of the contracted area, are the homes. These reduced revenues will
be partially offset with certain reduced expenditures for the City, such as tipping fees for waste
disposal at the landfills, but other costs, such as labor and equipment, may not disappear from the
City’s operations. It’s likely that the solid waste assessments in the remaining incorporated area
of the City will be increased. It may also happen that the City would have to reduce a crew or at
least some personnel who currently provide collection and disposal services in the Contraction
Area. If the City keeps all of its employees, solid waste assessments will need to increase. If they
don’t keep all of those employees, then services in the remaining area might be diminished. Table
6 notes the decreased revenue from reduced solid waste assessments based upon the growth of
the area over the study period:
Table 6. Solid Waste District Fund Revenue Reductions
City of North Port, Florida
Fiscal Impact Contraction
Fiscal Year 2022 2023 2024 2025 2026 Cumulative
120 Solid Waste District Revenue Contraction Reduction
Solid Waste Assessments $1,082,900 $1,180,900 $1,278,900 $1,376,900 $1,474,900 $7,379,400
Page 10 of 68Finally, capital infrastructure would have to be reduced as the City’s share of the County Local
Option Surtax fund would see a reduction over $900 thousand initially, and in excess of $5 million
over the forecast period. Although the current voter approved tax is about to expire, based on
prior voting outcomes for this tax in Sarasota County, we have assumed the tax will be renewed
and continue into the future. These funds are the City’s share of local option sales tax collections
in the County and are distributed based upon the City’s proportionate share of the County-wide
population. The revenue reduction represents the per capita distribution multiplied by the
reduction in population, giving consideration to the expected growth in population in the
Contraction Area. Table 7 details the revenue reduction over the study period:
Table 7. Surtax 3 Fund
City of North Port, Florida
Fiscal Impact Contraction
Fiscal Year 2022 2023 2024 2025 2026 Cumulative
306 Surtax Contraction Revenue Reduction
Local Discretionary Sales Tax $920,713 $1,006,074 $1,091,435 $1,176,795 $1,262,156 $5,457,173
B. FISCAL ANALYSIS APPROACH
In order to analyze the fiscal impact to the City, certain elements of data and information that was
relied upon was provided by the Sarasota County Tax Collector (“Collector”), Office of Economic
and Demographic Research for the State of Florida, the adopted City budgets and audited financial
states, reports filed by the City with the State’s Chief Financial Officer, U.S. Census information,
and proprietary databases licensed through Esri™ that provided current estimated and future
forecasted demographic information.
We used the Sarasota County Tax Collector data to analyze property tax bills for fiscal year 2020-
21 (property tax year 2020). We used data from the City Planning Department of to determine
which parcels are located within the Contraction Area.
Fiscal impact analysis of the Petition Contraction relies heavily upon the existing and forecasted
population within the Contraction Area. For purposes of determining population in the Area, we
Page 11 of 68used completed housing units billed by the Tax Collector and merged that with data from the City,
and then further adjusted that using demographic details provided by Esri. The number of homes
billed by the Tax Collector7 in 2020 was 4,980 within the Contraction Area. About 23% of the homes
in the Contraction Area are not occupied by residents that count towards population. This is
considered a vacancy rate, but that does not mean that people do not occupy the home at least
part of the year. It’s likely that many of these homes are not considered the primary residence of
the occupants. Florida is known for having many seasonal residents that require and expect
services. Our population estimate for the Contracted Area is 5,465 permanent residents in 2020.
As the graph in Figure 2 illustrates, housing units added to the tax roll appear to have peaked during
2018 at almost 700 new units. The subsequent two years saw a decline to 445 units in 2020. While
no one can exactly identify what the future of new home units added will be, it appears reasonable
and conservative to expect the growth in new home construction to average about 400 units per
year over the next 5 years. As a result, we are using that as an estimated number of new housing
units of 400 per year with 2.02 persons per household in the calculations to project population and
therefore revenue. It would not be surprising to find in the current housing market to see this
number be ultimately exceeded. Were that to occur, the revenue reductions would be even
greater than forecasted in this study.
(continued)
7
Sarasota County Tax Collector and City Planning Department merged data files to incorporate the year a housing
unit was built.
Page 12 of 68Figure 2. Number of Homes Added to Property Tax Roll Per Year in Contraction Area
Based upon the assumptions of new housing unit growth of 400 per year, a 23% unit vacancy rate
pursuant to Esri’s estimate, and a household occupancy of 2.02 people per home (using the Esri
estimates for the forecast period), we calculated that 622 new residents will be added to the City’s
population annually over the next 5 years. This growth is illustrated in the graph in Figure 3:
(continued)
Page 13 of 68Figure 3. Projected Addition of Population in Contraction Area
10,000
Projected Population Growth
9,197
9,000
8,000
7,000
6,709
6,000
5,000
4,000
3,000
2,000
1,000
-
2022 2023 2024 2025 2026
Series2 6,709 7,331 7,953 8,575 9,197
C. FISCAL IMPACTS ON CITY FUNDS
Almost 85% of the City’s General Fund revenues8 are derived from four revenue categories: ad
valorem taxes, other taxes (most taxes on utilities), intergovernmental revenues, and charges for
services. Ad valorem taxes account for about 37% of all General Fund revenues. To a large degree,
the planned future development of the Contraction Area is likely to be the largest contributor of
growth to the City’s property tax base.
The General Fund of the City has eleven categories of revenue and other financing sources that are
used to fund the City’s General Fund operations (by definition, the General Fund is used to account
for activities not accounted for in another fund. It is almost always a municipality’s largest and
8
Page 115 of the “FY2021AdoptedBudget.pdf”
Page 14 of 68most diverse fund). We will focus our attention to the four main categories previously mentioned.
Our more detailed analysis for the FY2021 budget year and the next five forecasted years reflects
our best estimates based upon the assumptions of new housing stock additions and projected
population growth within the Contraction Area. As reflected in the FY21 ad valorem taxes billed
by the Sarasota County Tax Collector, $5,597,306 or about 11% of the estimated General Fund
revenue comes from the Contraction Area. In order to determine this amount, we used the County
Tax Collector’s property tax files for the City’s 2020-2021 fiscal year (property tax year 2020) which
also included special assessments within the Contraction Area. The ad valorem taxes billed in the
Contraction Area ($3,772,550) represent about 20% of the City’s total ad valorem taxes
($18,723,440 budgeted) in Fiscal Year 2020-2021. While property taxable values and property tax
rates determine the amount of property taxes to be collected, we are also able to provide estimates
of other sources of revenue to the General Fund based on specific data and the aforementioned
housing and population assumptions.
Insurance premium taxes are levied on commercial insurance premiums written on properties in
the City and these taxes are used to help pay for the pension costs of fire and police employees
who retire from the City and we allocated the Contraction Area an amount based upon the
proportion of commercial property values in that area to the total commercial property values in
the entire City. Estimates of electric franchise and utility taxes was determined by calculating the
square feet of each buildings, the use of each property, and published annual energy costs of
various building uses by the Energy Information Administration of the U.S. Department of Energy.
For projected added housing units, we used the current average home square footage in the
Contraction Area of 2,156. This results in the loss of an estimated $11,576 per year revenue for
the added 400 single family homes. Similarly, the electric franchise fee follows the same formula
and the loss is $42,248 annually. These two sources from taxes on utilities comprise over 10% of
the revenue provided by the Contracted Area. The communication services tax is the amount
attributed per capita provided by the State of Florida9 in fiscal year 2020-2021, which is over 2.8%
9
http://edr.state.fl.us/Content/local-government/data/county-municipal/index.cfm
Page 15 of 68of the funds collected. Municipal revenue sharing represents more than 2.7% of the funding.
Municipal revenue sharing and the City’s portion of the half-cent sales tax are essentially per capita
distributions, and the loss of population results in reduced revenue.
The sum of these revenue losses was used to determine the impact on the City.
We utilized the City’s filed annual financial reports with the State of Florida’s Chief Financial Officer
to analyze and project future revenues of the City and the Contraction Area. We used the reported
fiscal years 2015 through 2019 and preliminary amounts provided by the City for 2020 to project
the future through linear regression. Table 8 reflects the prior reported fiscal years and projected
future General Fund revenues of the City. The model assumes current tax rates and distribution
methods.
(continued)
Page 16 of 68Table 8. Historical and Projected City Revenue Detail
FISCAL YEAR 2015 2016 2017 2018 2019 2020 2021 2022 2023 2024 2025 2026
311000 - Ad Valorem Taxes 9,228,706 10,087,024 11,017,060 12,079,877 13,589,528 17,246,919 17,374,325 19,229,362 21,149,736 23,017,912 24,671,838 26,045,922
312510 - Fire Insurance Premium Tax (Firefighters' Pension) 139,199 137,557 139,168 153,366 167,919 196,278 194,649 211,957 228,838 242,953 256,115 267,896
312520 - Casualty Insurance Premium Tax (Police Officers' Retirement ) 341,432 378,333 405,720 453,918 495,381 523,055 563,719 602,061 641,187 676,258 713,322 752,742
314100 - Utility Service Tax - Electricity 749,292 788,561 836,661 899,698 949,894 1,010,751 1,057,909 1,115,833 1,171,593 1,224,725 1,279,911 1,333,654
315000 - Communications Service Tax (Chapter 202) 1,863,757 1,809,323 1,895,025 1,952,279 2,002,556 2,073,080 2,101,027 2,176,511 2,225,833 2,280,306 2,335,468 2,388,614
316000 - Local Business Tax (Chapter 205) 136,049 142,197 118,613 137,009 130,086 133,248 129,673 129,240 133,074 129,476 130,399 129,752
323100 - Franchise Fee - Electricity 2,918,342 2,941,991 3,121,469 3,234,444 3,443,055 3,471,321 3,626,543 3,774,563 3,892,236 4,017,565 4,132,545 4,278,815
323400 - Franchise Fee - Gas 32,362 31,593 30,365 32,635 31,289 31,639 31,421 31,652 31,815 31,419 31,680 31,641
324620 - Impact Fees - Commercial - Culture/Recreation 8,184 0 7,839 30,650 35,606 25,132 39,339 48,447 53,032 55,165 61,847 70,724
325100 - Special Assessments - Capital Improvement 236,380 (118,095) 307,360 303,196 277,209 355,154 404,429 527,877 510,961 580,481 653,408 705,636
329000 - Other Permits, Fees & Special Assessments 4,920 6,585 3,225 4,950 5,625 4,650 4,742 4,536 5,117 4,703 4,554 4,716
331200 - Federal Grant - Public Safety 10,272 36,965 15,637 13,579 293,393 492,932
331500 - Federal Grant - Economic Environment 11,147 45,011 289,357
331690 - Federal Grant - Other Human Services 62,823 58,757 66,252 65,370 65,279 7,855
331900 - Federal Grant - Other (3,619) 41,950 208,468
334100 - State Grant - General Government 15,000 0 33,000 0 1,877 0
334200 - State Grant - Public Safety 3,994 3,754 3,541 3,873 3,458 3,537 3,409 3,380 3,321 3,184 3,177 3,081
335120 - State Revenue Sharing - Proceeds 1,451,009 1,570,848 1,749,745 1,881,200 2,057,967 1,909,373 2,158,487 2,247,321 2,317,797 2,395,374 2,481,167 2,615,597
335140 - State Revenue Sharing - Mobile Home Licenses 2,226 2,325 2,640 2,094 2,401 1,941 2,097 1,957 1,801 1,784 1,633 1,605
335150 - State Revenue Sharing - Alcoholic Beverage Licenses 13,377 12,869 13,491 14,933 13,987 18,754 17,737 19,213 20,531 21,791 23,252 23,810
335180 - State Revenue Sharing - Local Government Half-Cent Sales Tax 5,028,895 5,378,559 5,630,639 6,054,853 6,466,628 6,308,752 6,820,158 7,075,343 7,328,885 7,546,541 7,795,899 8,132,772
337100 - Local Government Unit Grant - General Government 1,000 0
337200 - Local Government Unit Grant - Public Safety 1,370 4,616 0
337500 - Local Government Unit Grant - Economic Environment 347 0
337700 - Local Government Unit Grant - Culture/Recreation 4,355 0
341100 - Service Charge - Recording Fees 110,947 93,351 97,605 115,004 130,366 157,984 153,906 174,630 191,194 204,814 218,075 230,408
341200 - Internal Service Fund Fees and Charges 0 0 0 0 0
341900 - Other General Government Charges and Fees 18,330 51,769 61,453 89,653 134,654 153,013 179,839 207,733 239,756 267,099 292,051 322,148
342100 - Service Charge - Law Enforcement Services 274,814 272,223 265,179 353,265 495,716 121,538 296,341 283,922 257,537 207,464 172,518 219,409
342600 - Service Charge - Ambulance Fees 1,313,856 1,441,635 1,452,365 1,668,756 1,972,414 2,251,043 2,332,811 2,568,728 2,826,280 3,035,839 3,225,728 3,430,744
342900 - Service Charge - Other Public Safety Charges and Fees 67,075 74,166 141,680 139,533 60,291 145,062 139,251 142,297 136,720 149,806 171,464 163,243
343900 - Service Charge - Other Physical Environment Charges 55,968 69,184 57,618 114,050 117,837 106,281 132,219 146,026 160,838 163,986 178,687 195,220
3,170
346900 - Service Charge - Other Human Services Charges 11,441 0
347100 - Service Charge - Libraries 753 2 0
347200 - Service Charge - Parks and Recreation 239,813 242,659 251,072 310,470 286,916 504,660 457,572 523,402 591,086 652,229 717,812 746,201
347400 - Service Charge - Special Events 21,520 21,106 29,019 26,672 20,552 15,197 18,782 15,967 11,603 9,578 8,433 6,680
347500 - Service Charge - Special Recreation Facilities 47,034 51,921 64,230 56,254 59,814 49,912 57,870 55,702 52,528 53,046 51,996 52,786
3,500
349000 - Other Charges for Services 4,804,417 4,868,578 4,846,641 5,341,001 5,965,718 6,218,155 6,426,199 6,863,785 7,302,958 7,624,172 7,931,924 8,321,393
351100 - Judgments and Fines - As Decided by County Court Criminal 84,891 66,334 65,000 77,207 109,956 103,232 107,914 123,809 135,797 143,572 148,880 161,921
354000 - Fines - Local Ordinance Violation 95,333 42,351 104,175 86,720 40,701 62,789 53,499 53,595 33,866 31,707 32,862 21,246
358200 - Sale of Contraband Property Seized by Law Enforcement 10,680 (110) 19 169 746 0
361100 - Interest 165,936 138,884 142,622 167,247 688,023 637,233 726,177 910,805 1,092,043 1,241,715 1,314,417 1,498,442
362000 - Rents and Royalties 241,063 262,829 255,787 256,786 253,882 197,971 220,589 202,552 188,194 172,563 160,562 155,857
364000 - Disposition of Fixed Assets 46,566 17,464 59,338 51,169 24,166 25,810 28,235 26,990 13,061 10,274 10,528 4,728
365000 - Sale of Surplus Materials and Scrap 26 85 728 2,257 219 452 1,034 984 730 470 852 759
366000 - Contributions and Donations from Private Sources 189,319 100,342 53,793 115,034 123,133 156,358 119,477 152,503 174,060 174,731 184,456 193,045
173
369900 - Other Miscellaneous Revenues 96,839 101,756 266,165 378,192 141,324 115,745 215,863 191,415 129,486 96,023 127,336 109,629
381000 - Inter-Fund Group Transfers In 357,530 387,930 412,690 420,260 1,799,050 463,900 1,117,505 1,284,918 1,428,160 1,500,703 1,422,552 1,811,566
384000 - Debt Proceeds 0 0
388200 - Compensation for Loss of General Capital Asset 26,777 17,310 12,871 18,255 24,469 117,875 84,495 111,594 140,167 166,565 187,973 197,305
Total General Fund Revenue & Projection 30,527,494 31,593,285 34,049,644 37,105,878 42,574,401 45,923,249 47,399,241 51,240,613 54,821,820 58,135,991 61,135,321 64,629,706
Based on the 6-year historical data, the City’s revenue projection grows annually in excess of 6.4%
through 2026 by the average income increasing over $3.4 million per year. If the Contraction
Petition is successful, it is projected the City will face a reduction of revenue, on average, of about
11% of its estimated annual General Fund Revenue. Table 9 depicts the projected reduction in
revenue through 2026.
Table 9. Projected City Revenue Losses Due to Contraction
City of North Port, Florida
Fiscal Impact Contraction
Estimated Revenues After Contraction
Fiscal Year 2022 2023 2024 2025 2026 Cumulative
Estimated General Fund Revenue 51,240,613 54,821,820 58,135,991 61,135,321 64,629,706 289,963,451
Total General Fund Revenue Reduction (5,597,306) (6,090,321) (6,595,236) (7,112,408) (7,642,206) (33,037,477)
Total Estimated General Fund Revenue 45,643,307 48,731,499 51,540,756 54,022,912 56,987,500 256,925,974
Change in revenue projection -10.9% -11.1% -11.3% -11.6% -11.8% -11.4%
Page 17 of 68As shown earlier, some of the reduction to City revenues could be
interpreted as a gain for the Contraction Area residents and owners in
the future if they assume they will be paying less annually than currently.
However, this perspective is only part of the picture. Another
component is the potential impact on the expenditures of the City and
how any deficit would be addressed.
Forecasts in the General Fund expenditures for the City and the Contraction Area was determined
in many instances on a per capita basis. Revenues and expenditures for the City as a whole will be
used to determine the impact of contraction will have to the remaining incorporated areas of the
City. In order to calculate the impacts, both revenues and expenditures of the City are taken from
the financial filings with the State of Florida10. The detail of expenditures is shown in Table 10:
10
https://apps.fldfs.com/LocalGov/Reports/Default.aspx
Page 18 of 68Table 10. Historical and Projected City Expenditure Detail
Ex penditure General Fund
Fiscal Year 2015 2016 2017 2018 2019 2020 2021 2022 2023 2024 2025 2026
511.10 - Legislative - Personnel Services 229,631 231,567 241,034 278,916 285,195 306,217 320,263 341,729 360,413 374,569 394,490 411,910
511.30 - Legislative - Operating Expenses 130,747 125,132 135,437 120,655 137,246 120,462 125,293 124,618 121,589 122,139 117,942 119,498
512.10 - Executive - Personnel Services 1,175,506 1,265,965 1,264,934 1,321,412 1,588,065 1,658,442 1,722,800 1,843,405 1,983,199 2,100,152 2,181,541 2,303,658
512.30 - Executive - Operating Expenses 224,857 264,030 287,148 209,037 273,944 203,044 227,933 207,401 193,456 193,871 171,642 172,244
512.60 - Executive - Capital Outlay
513.10 - Financial and Administrative - Personnel Services 1,639,077 1,767,526 2,034,749 2,385,716 2,349,527 2,443,909 2,715,530 2,875,957 2,996,552 3,118,374 3,316,234 3,480,168
513.30 - Financial and Administrative - Operating Expenses 908,576 1,047,094 788,019 815,616 1,387,685 808,147 1,013,912 1,023,400 1,092,022 1,072,957 995,101 1,118,976
513.60 - Financial and Administrative - Capital Outlay
514.10 - Legal Counsel - Personnel Services 268,935 360,742 458,224 426,167 500,991 646,089 670,971 729,487 795,570 883,951 946,686 999,593
514.30 - Legal Counsel - Operating Expenses 263,386 265,050 206,034 169,181 198,251 211,382 169,154 159,739 163,781 160,104 142,773 131,207
514.60 - Legal Counsel - Capital Outlay
515.10 - Comprehensive Planning - Personnel Services 675,604 764,451 826,257 956,000 1,010,745 1,070,976 1,168,554 1,247,106 1,326,820 1,396,109 1,480,675 1,562,794
515.30 - Comprehensive Planning - Operating Expenses 27,356 91,078 196,505 88,182 101,584 194,384 192,348 195,353 201,346 246,709 263,572 267,120
515.60 - Comprehensive Planning - Capital Outlay
516.10 - Non-Court Information Systems - Personnel Services 690,124 762,641 793,768 990,400 985,560 1,067,742 1,157,054 1,238,442 1,319,379 1,375,715 1,469,356 1,545,780
516.30 - Non-Court Information Systems - Operating Expenses 881,456 866,851 1,056,972 1,013,933 1,201,311 1,267,279 1,336,913 1,440,737 1,514,897 1,625,118 1,694,281 1,787,250
516.60 - Non-Court Information Systems - Capital Outlay
519.10 - Other General Government - Personnel Services 1,042,342 1,049,839 1,001,324 1,086,544 654,242 745,712 671,528 559,129 449,958 340,274 313,190 186,744
519.30 - Other General Government - Operating Expenses 1,340,328 1,669,481 1,625,169 1,829,056 1,372,667 1,325,855 1,451,201 1,300,998 1,204,034 1,092,492 1,099,554 1,015,229
519.60 - Other General Government - Capital Outlay
521.10 - Law Enforcement - Personnel Services 12,614,040 12,547,715 13,191,651 14,302,106 15,678,098 17,037,144 17,490,171 18,803,623 19,982,109 21,038,504 22,033,312 23,077,910
521.30 - Law Enforcement - Operating Expenses 1,281,759 1,441,185 1,381,245 1,830,711 2,134,959 2,009,261 2,296,683 2,495,586 2,709,133 2,822,197 2,984,774 3,219,705
521.60 - Law Enforcement - Capital Outlay
521.70 - Law Enforcement - Debt Service 41,465 41,465 41,465 0
524.10 - Protective Inspections - Personnel Services 476,519 501,162 449,216 473,974 476,817 661,704 594,330 636,815 697,205 743,018 782,981 797,293
524.30 - Protective Inspections - Operating Expenses 78,259 65,121 147,307 187,758 220,663 272,424 309,712 363,619 400,165 445,209 491,285 534,137
524.60 - Protective Inspections - Capital Outlay
525.30 - Emergency and Disaster Relief - Operating Expenses 5,200 15,040
526.10 - Ambulance and Rescue Services - Personnel Services 3,396,172 3,524,192 3,715,078 4,107,104 5,095,805 6,440,289 6,412,518 7,243,094 8,092,396 8,865,923 9,488,753 10,102,346
526.30 - Ambulance and Rescue Services - Operating Expenses 493,290 528,592 643,193 758,879 1,063,774 919,365 1,119,676 1,247,796 1,354,881 1,450,634 1,529,584 1,685,428
526.60 - Ambulance and Rescue Services - Capital Outlay
552.10 - Industry Development - Personnel Services 75,345 113,711 157,531 160,882 531,648 220,311 408,104 468,472 522,994 566,284 567,129 685,198
552.30 - Industry Development - Operating Expenses 138,079 99,829 132,653 164,217 166,544 195,804 201,554 230,141 244,690 260,382 280,963 297,272
564.10 - Public Assistance - Personnel Services 213,272 240,206 208,566 274,475 312,090 325,318 346,500 376,460 414,112 432,741 457,830 488,053
564.30 - Public Assistance - Operating Expenses 67,030 64,620 51,285 93,080 91,174 108,587 112,220 127,628 142,984 148,863 162,614 173,358
564.60 - Public Assistance - Capital Outlay 0
572.10 - Parks/Recreation - Personnel Services 784,263 819,713 896,075 957,256 1,894,092 2,667,391 2,606,461 3,158,617 3,733,344 4,264,169 4,614,052 5,035,455
572.30 - Parks/Recreation - Operating Expenses 199,603 185,940 266,782 291,309 710,483 801,579 870,086 1,065,460 1,249,698 1,423,974 1,530,932 1,706,221
572.60 - Parks/Recreation - Capital Outlay
573.60 - Cultural Services - 25147
573.60 - Cultural Services - Capital Outlay
574.30 - Special Events - Operating Expenses 20155 52
581.90 - Interfund Transfers Out - Other Uses 67,000 27,000 67,000 320,000 335,000 358,000 458,867 565,711 644,079 688,282 781,472 871,132
Total Expenditures 29,860,915 31,076,976 32,873,174 36,469,780 41,659,514 44,127,056 46,170,338 50,070,522 53,910,806 57,252,715 60,292,719 63,775,679
Net Revenue 666,579 516,309 1,176,470 636,098 914,887 1,796,193 1,228,903 1,170,091 911,014 883,276 842,601 854,027
The City has a positive net income each reporting year and into the future using a linear regression
model. This has excluded the acquisition of capital assets or debt service, for acquired assets. We
have chosen to remove periodic large capital outlays because it distorts forecasts.
Based on the 6-year historical data, the City’s expenditure projection grows slightly more than the
revenue projection. The average projection is in excess of 6.6% through 2026. Assuming
expenditures are not modified as a result of the Contraction Area as revenues decline, the
projections change as can be seen in the Table 11:
Table 11. Fiscal Impact to City of Contraction
Page 19 of 68Fiscal Impact Of Contraction
Fiscal Year 2022 2023 2024 2025 2026 Cumulative
Estimated General Fund Revenue 51,240,613 54,821,820 58,135,991 61,135,321 64,629,706 289,963,451
Total General Fund Revenue Reduction (5,597,306) (6,090,321) (6,595,236) (7,112,408) (7,642,206) (33,037,477)
Total Estimated General Fund Revenue 45,643,307 48,731,499 51,540,756 54,022,912 56,987,500 256,925,974
Total Estimated General Fund Projected
Expenditures 50,070,522 53,910,806 57,252,715 60,292,719 63,775,679 285,302,442
Deficit After Contraction (4,427,215) (5,179,307) (5,711,960) (6,269,807) (6,788,179) (28,376,468)
The reduction in revenue will require action by the City to take one or more actions to raise taxes
and assessments or cut services or both. The estimated growth in taxable values of the City help
reduce the impact of the decreased revenues, but not by much. Projected assessed taxable value
assumes a 3% growth in value based upon the 2020 assessed taxable value provided by the
Sarasota County Tax Collector ($3,883,561,732). Were the City to only increase the millage rate in
future years to accommodate for the decreased revenue, then the effect on property taxes is
illustrated in Table 12:
Table 12. Illustrated Impact to City Property Tax Rate from Contraction
Millage Rate Impact Of Contraction on Average Home Value
Current Millage Rate: 3.7667 Average Home Value East of Mayakka River $109,735
Fiscal Year 2022 2023 2024 2025 2026
Deficit After Contraction ($4,556,417) ($5,351,853) ($5,927,849) ($6,529,040) ($7,090,756)
Projected Ad valorem Taxes $19,229,362 $21,149,736 $23,017,912 $24,671,838 $26,045,922
Projected Assessed Taxable Value at Current Millage Rate $4,000,068,584 $4,120,070,641 $4,243,672,761 $4,370,982,944 $4,502,112,432
Projected Millage Rate Change to Mitigate Lost Revenue 1.1391 1.2990 1.3969 1.4937 1.5750
New Projected Millage Rate 4.9058 5.0657 5.1636 5.2604 5.3417
Average Taxable Home Value with 3% Increase 116,418 119,910 123,508 127,213 131,029
Average Single Family Advalorem Tax Bill Based on New
Projected Millage Rate is: $571.12 $607.43 $637.74 $669.19 $699.92
Tax Bill Based on Current Millage Rate is: $438.51 $451.67 $465.22 $479.17 $493.55
Annual Increase in Ad valorem Tax Bill $132.61 $181.69 $212.00 $243.45 $274.18
As shown, the millage rate rises from its current 3.7667 to 4.8735 currently and then to 5.2745 in
2026. Under this scenario, the average homeowner in the remaining incorporated City would see
an increase in their annual property tax bill.
The City Commission will have to address how to handle this significant loss of revenue, but if they
choose to make up for the decreased revenue with just property taxes, then an average single
family property tax bill for a homeowner could be expected to increase as illustrated in Table 13:
Page 20 of 68Table 13. Effect on Property Tax Bills if Contraction Occurs
Millage Rate Impact Of Contraction on Average Home Value
Current Millage Rate: 3.7667 Average Home Value East of Mayakka River $109,735
Fiscal Year 2022 2023 2024 2025 2026
Deficit After Contraction ($4,556,417) ($5,351,853) ($5,927,849) ($6,529,040) ($7,090,756)
Projected Ad valorem Taxes $19,229,362 $21,149,736 $23,017,912 $24,671,838 $26,045,922
Projected Assessed Taxable Value at Current Millage Rate $4,000,068,584 $4,120,070,641 $4,243,672,761 $4,370,982,944 $4,502,112,432
Projected Millage Rate Change to Mitigate Lost Revenue 1.1391 1.2990 1.3969 1.4937 1.5750
New Projected Millage Rate 4.9058 5.0657 5.1636 5.2604 5.3417
Average Taxable Home Value with 3% Increase 116,418 119,910 123,508 127,213 131,029
Average Single Family Advalorem Tax Bill Based on New
Projected Millage Rate is: $571.12 $607.43 $637.74 $669.19 $699.92
Tax Bill Based on Current Millage Rate is: $438.51 $451.67 $465.22 $479.17 $493.55
Annual Increase in Ad valorem Tax Bill $132.61 $181.69 $212.00 $243.45 $274.18
One should assume that certain appropriations within the General Fund will not be affected
through the possible reduction in city size as the result of the Contraction Area being removed from
the City. As noted earlier, certain operations (City Commission, City Attorney, City Manager, City
Clerk, Finance, Information Technology, and Human Resources) will not likely be reduced. Other
programs, such as Parks and Recreation, are not likely to be reduced, either, as those costs would
continue to exist.
D. EFFECTS ON RESIDENTS IN THE CONTRACTION AREA
Much of the analysis heretofore has concentrated on the impact the removal of the Contraction
Area has on the City. In the summary at the beginning of this analysis, the impact on the City’s
three assessment districts was lightly addressed because assessment districts are theoretically a
break-even operation.
In the meantime, the residents in the Contraction Area would see annual savings in what they pay
for local government. Service levels will likely be different, and probably lower, in the Contracted
Area. This is detailed later in the report.
The average single family home size in the Contraction Area is 2,156 square feet with an average
taxable value of $247,205. The owner would pay the City $931.15 in property taxes, $326.92 for a
fire assessment, $245.00 for a solid waste assessment, and $21.47 in road & drainage assessments.
Electric franchise taxes would be $103.25 and electric utility taxes would be $35.00. The
homeowner would pay the City a total of $1,662.79.
Page 21 of 68Assuming the Contraction Area would receive county equivalent services, the home would pay an
EMS millage that would cost $163.16. It would be included in the County’s Fire Rescue assessment
district and be charged $155.48. The Solid waste assessment in the County is $218.31. If the
Contracted Area can be included in the Stormwater assessment program, it could cost up to $90.65
or beyond. Electric franchise taxes would be $103.25. The annual water surcharge for this
homeowner could be $281.73. This homeowner would pay a total of $1,012.58. The comparison
is shown in Table 14:
Table 14. Comparison of Costs Between City and Unincorporated Area
Cost Comparison For Average Home In Contraction Area (City vs. Unincorporated)
Average Square Feet of a Home in Contracted Area 2,156
Average Taxable Value of Home in Contracted Area $247,205
City Unincorporated
City Property Tax $931.15 $0.00
County EMS Property Tax $0.00 $163.16
Fire assessment $326.92 $155.48
Solid Waste assessment $245.00 $218.31
Road Drainage/Stormwater assessment $21.47 $90.65
Electric Franchise Fee $103.25 $103.25
Electric Utility tax $35.00 0
Outside City Utility Surcharge $281.73
Total cost $1,662.79 $1,012.58
Costs are but one part of living in a City. The services and level of those services can be starkly
different and that is addressed later in this report.
Page 22 of 68SECTION 3. EFFECTS OF CONTRACTION ON MUNICIPAL SERVICES DELIVERY
The City of North Port has spent considerable time, effort, and money over the years in planning
for future municipal services to all of its residents. Service efforts are not the same in North Port
as they are in the unincorporated areas of Sarasota County, and many things should be considered
in virtually every operation of the City. Most of what the City provides within the Contraction Area
residents and businesses will still need from the County. In this section we detail each of these
services and issues that should be considered.
A. Fire and EMS Services
Figure 4. Fire Rescue and Rescue Stations in City of North Port and Sarasota County
Emergency Services Consulting International (ESCI) issued a Fire Station Location Study in October
2019. The study was for the area within the boundaries of the West Villages Master Planned
Page 23 of 68Community within the City of North Port. The study was commissioned by West Villages, LLLP, to
determine the future optimal location for North Port Fire Rescue Station 86, as well as future fire
stations that may be required to serve the development at buildout. Two additional potential
future fire rescue stations were also identified in the study, though they have not been included in
the map above or our financial projections since they were outside the study timeline. The new
Station 86 is under construction and is expected to be completed in the Fall of 2021 and will be
staffed at that time. The initial annual cost of staffing and operating Station 86 with a Fire
Apparatus Ladder Truck, Rescue Vehicle, and Brush Truck is estimated at $2,184,705 starting in
Fiscal Year 2022. The initial capital cost of the station is estimated to be $12,513,621, which does
not include the cost of land required of the Developer. Total first year costs of opening and
operating Station 86 are about $14.7 million. The capital costs will have ultimately been paid by
development through the payment of impact fees. The Station location identification and payment
of capital components was facilitated by the City, WVID, and the Developer.
While fire stations are generally assigned particular geographic areas, they do not operate in a
vacuum. Station personnel rely upon the assistance of other fire rescue personnel in other fire
stations to assist in events such as structural fires. The location of each station is in part determined
by the location of other stations that can be called upon to help when needed. This is not an
infrequent occurrence. Station 86 has been sited in part to serve the growing area west of the
Myakka River but also at a location where it can be assisted by other North Port fire stations as
well as providing assistance to those stations. It is common for one station's engines or rescue
vehicle to move up to cover another station that may be involved in a call for service and may be
tied up for some time. The more stations, equipment, and manning a City has available, the better
the fire or rescue services, the less likely situations will arise that cannot be covered due to the
unavailability of additional resources. Table 15 from the ESCI report illustrates the resources
needed to fight a typical 2,000 square foot residential structure fire:
Page 24 of 68You can also read