2017-2022 CEDS Comprehensive Economic Development Strategy - September 30, 2017 Sponsored in part by the U.S. Economic Development Administration.
←
→
Page content transcription
If your browser does not render page correctly, please read the page content below
2017-2022 CEDS
Comprehensive
Economic
Development
Strategy

September 30, 2017
Sponsored in part by the
U.S. Economic Development
Administration.
CONTENTS
Introduction                                       2
Vision                                             2
Summary Background                                 3
Our Region                                         6
SWOT Analysis                                      7
Data Fact Sheets                                   8
Economic Resilience                               21
                                                       CEDS STRATEGY COMMITTEE
Strategic Direction/Action Plan                   24
                                                       LaChaun Banks       NC Growth—UNC Frank Hawkins Kenan Institute of Private Enterprise
                                                       Paul Barnes         Aberdeen & Rockfish Railroad Company
Goal 1: Competitive Advantage                     25   Jim Bradshaw        Cape Fear Council of Governments—Workforce Development Business Services
                                                       Martie Butler*      Richmond County Economic Development Commission
Challenge                                         28   Jim Caldwell        Mid-Carolina Council of Governments
Performance Measures                              28   Amy Cannon*         Cumberland County
                                                       James Freeman       UNC-Pembroke—Thomas Family Center for Entrepreneurship/Incubator
Goal 2: Regional Infrastructure                   29   Thomas Hall         UNC-Pembroke—Thomas Family Center for Entrepreneurship/Incubator
                                                       Barry Graham        Eco Building LLC
Challenge                                         30   Mike Hargett        Brunswick County Economic Development Commission
Performance Measures                              30   Chuck Heustess      Bladen County Economic Development—Bladen’s Bloomin’ Agri-Industrial, Inc.
                                                       Velva Jenkins*      Brunswick Community College—Economic & Workforce Development
Goal 3: Revitalized and Vibrant Communities       31   Randall Johnson*    North Carolina Biotechnology Center—Southeastern Office
                                                       Gary Lanier*        Columbus County Economic Development & Planning
Challenge                                         32   Mark Lanier         University of North Carolina at Wilmington
Performance Measures                              32   Chris May           Cape Fear Council of Governments
                                                       Gwen McGougan*      Hoke County
Goal 4: Healthy and Innovative People             33   Jackie Newton*      Pender County
                                                       Cliff Pyron         North Carolina State Ports Authority
Challenge                                         34   David Richardson    Lumber River Council of Governments
                                                       Carnell Robinson*   Harnett County
Performance Measures                              34   Jimmy Smith         Four County Electric Membership Corporation—Economic & Community Development
                                                       Jill Smith          Campbell Oil Company
Goal 5: Entrepreneurs and Small Business Growth   35   Jerry Stephens*     Robeson County
                                                       Larry Stone*        Larry Stone & Association
Challenge                                         36
                                                       John Swope*         Sampson County Economic Development Commission
Performance Measures                              36   Greg Taylor         Carolina Small Business Development Fund
                                                       Mark Ward*          Scotland County Economic Development Corporation
Evaluation Framework                              37   Beth Wilkerson      Small Business and Technology Development Center
                                                       Steve Yost          The Southeastern Partnership, Inc.
Appendix A                                        39   Mark Zeigler        North Carolina Department of Commerce—Community Development
INTRODUCTION
The Southeastern Economic Development Fayetteville which includes Fort Bragg—and incorporate elements from other regional
Commission (SEDC) was designated as an Wilmington on the coast. The counties in plans;
Economic Development District (EDD) through between these two designated metro areas 4. Evaluation Framework to include
the US Economic Development Administration are more rural in nature. performance measurements to evaluate
(EDA) in 1968. As the region’s EDD, the SEDC the implementation of the CEDS and
is responsible for developing and In February 2015, the EDA released new impact on the regional economy.
maintaining a Comprehensive Economic guidelines for creating an impactful CEDS.
Development Strategy (CEDS) designed to This five-year plan follows the new guidelines The SEDC CEDS aligns with the NC Tomorrow
support integrated planning and facilitate imposed by the EDA. The CEDS is a Plan published in 2014 that identifies
greater engagement to promote economic strategy-driven plan for regional economic regional and State priorities for resilient
prosperity. development that provides the capacity economic and community development.
building foundation by which the public sector,
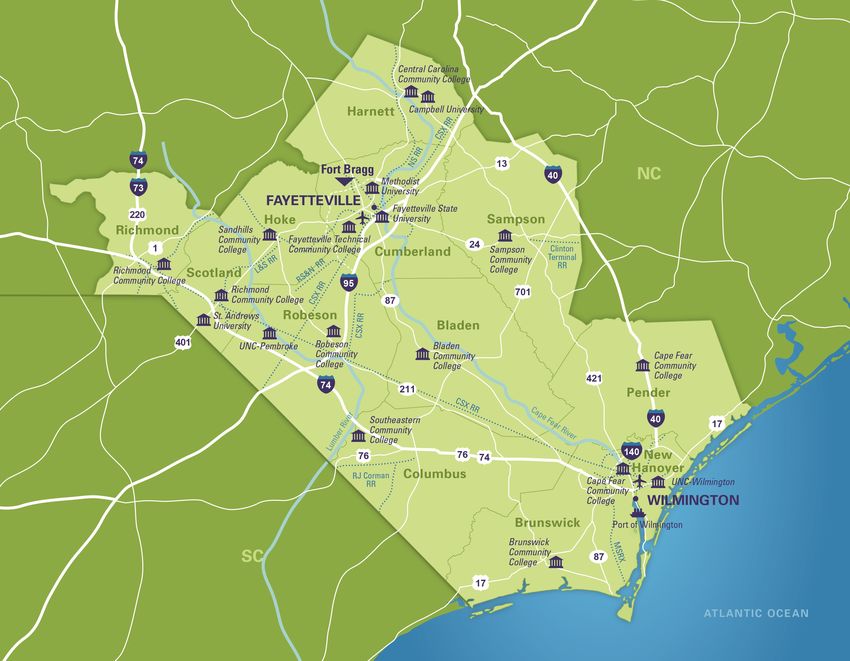
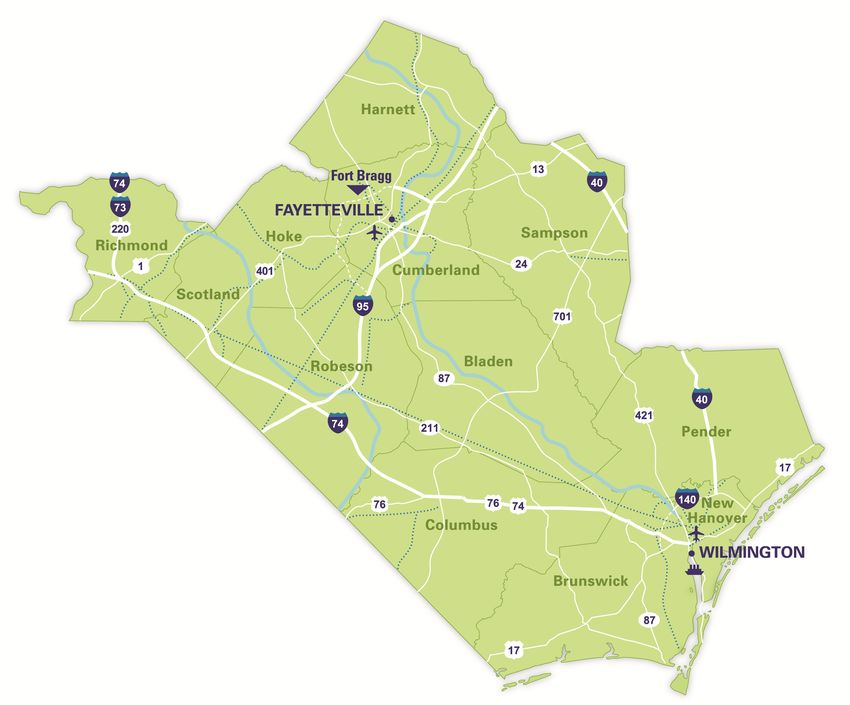
The SEDC region consists of the twelve counties working in conjunction with the private and A key element in the process is the CEDS
in the extreme southeastern corner of North nonprofit sectors, create an environment for Strategy Committee that broadly represents
Carolina. These counties include Bladen, regional economic prosperity. This plan is the main economic interests of the region. The
Brunswick, Columbus, Cumberland, Harnett, comprised of four main elements as required CEDS Strategy Committee was formed in
Hoke, New Hanover, Pender, Richmond, by the EDA: February 2017 and met from March through
Robeson, Sampson and Scotland. September to complete the plan. Throughout
1. Summary Background of economic the region, four public meetings were
This region is one of the largest Economic conditions of the region; facilitated to conduct the SWOT analysis to
Development Districts in North Carolina. Its 2. SWOT Analysis to identify the regional help shape the vision, goals, objectives and
size and geographic location make it a hugely strengths, weaknesses, opportunities and strategies for the plan. The 30-day public
diverse region extending from the coastal threats; comment period was held from August 25,
plain to the piedmont. The local economies 3. Strategic Direction or Action Plan to build 2017 to September 24, 2017 to seek
range from the two metropolitan areas— on findings from the SWOT analysis and stakeholder input and public comments.
VISION
To achieve regional prosperity in healthy, connected, and globally competitive
communities, through improving education and infrastructure, targeting existing strengths
and strategic growth sectors, and enhancing the business climate and quality of life.
2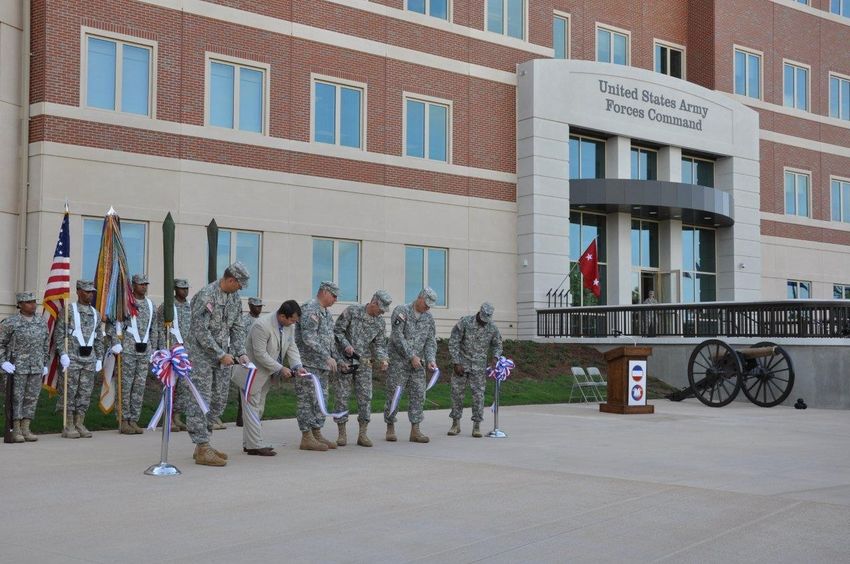
SUMMARY BACKGROUND
Demographic and Socioeconomic Data                          shifted from the Wilmington MSA to the             Lumbee Tribe, grew to be the majority
Over 1.2 million people live in the region,                 Myrtle Beach (SC) MSA. Historically,               population during the 1980s.
and its growing population includes newly                   Brunswick has been in the Wilmington MSA,
arriving residents from around the world at                 and since Horry County, SC is not in the SEDC      The most remarkable demographic change in
all stages of life and career. The population               planning area, the Myrtle Beach MSA is not         the population is found in the distribution of
of the twelve-county region grew by an                      reference in this plan.                            age. In 2010, exactly 154,672 persons were
estimated 4 percent from 2010-2015, from                                                                       counted as age 65 or over in the SEDC
1,228,074 to 1,280,229. By the year 2036,                   Rates of growth in most of the rural interior      region. This represents a 32.5 percent
the population of the region is expected to                 counties have been negligible. The counties        increase in the region since the 2000 Census.2
grow by 246,966 people expanding to                         of Bladen, Columbus, Richmond, Robeson and
1,475,040 people. The majority of this                      Scotland experienced an estimated                  From 2008 to 2012, the poverty rate within
increase is attributable to five counties:                  population loss. Richmond County has the           the state has grown from 14.6% to 18%,
Brunswick, Harnett, Hoke, New Hanover and                   most significant loss at –2.7 percent in           according to the Pew Charitable Trusts. About
Pender.1                                                    population growth. Projected population            252,000 persons—21.8 percent of the
                                                            growth estimates continue this trend.              population in the region—had incomes below
Growth has not been consistent across the                                                                      the poverty level 2010.2 Some communities
region. Brunswick, a coastal county,                        The racial makeup of the region is fairly          remain disconnected from good jobs and
experienced the largest estimated rate of                   consistent by county with majority white           growing industries and the networks and
growth at 14 percent since 2010. The                        population (60 percent), followed by African       infrastructure that can connect residents to
counties of Harnett, Hoke, New Hanover,                     Americans (26 percent), Other Races (8             economic opportunity. When for generations
Pender followed with rates of increase                      percent) and American Indians (6 percent).         communities cannot access the tools and
estimated over 8 percent. These are the                     Robeson County is the exception among the          systems that support mobility and prosperity,
same counties that experienced a 20 percent                 twelve counties with a majority of American        it becomes difficult for these areas to reduce
growth rate from 2000-2010. Most of these                   Indian population (38 percent) followed by         the economic hardship of the residents. The
counties are located within either the                      whites (29 percent) and African Americans          results is that poverty persists. Bladen,
Fayetteville or Wilmington MSA where                        (24 percent) making it the only truly tri-racial   Columbus and Robeson are among the State’s
growth has been the strongest. As a result of               county in the region and in the State.2            ten counties that experience persistent
the 2010 Census, Brunswick County was                       American Indians, primarily members of the         poverty.

                                                                                                           BY MSA:
                                       246,966
                                      Population growth projected by the year                              Fayetteville $17B
                                      2036 per the NC Office of State
                                      Budget and Management (OSBM)                                         Wilmington $13.6B
1https://www.osbm.nc.gov/demog/county-projections
2https://www.census.gov/2010census/

                                                                                    3
SUMMARY BACKGROUND
Environment, Culture and Natural Resources         Two major rivers traverse the region—the          Workforce
The region has a treasure chest full of historic   Cape Fear and the Lumber. The Lumber River        The region’s workforce, which now numbers
sites, trails and museums dedicated to             is the only State and Federally-designated        nearly 540,000, includes a diverse
our cultural heritage. Larger cities and small     river in the region. It was established in 1989   cross-section of workers in agriculture,
towns alike offer opportunities for                as both a state park and designated as a          manufacturing, wholesale trades, construction,
entertainment and enrichment in the realm of       Natural and Scenic River by the North             healthcare, government, and the professions.
art, heritage, military, science, and many         Carolina General Assembly. In addition, it is     The largest private employers include
other areas. Festivals and events are held         the only blackwater river in North Carolina to    Wal-Mart Corp., Smithfield Foods, Lowes
throughout the year in cities and communities      be designated as a National Wild and Scenic       Home Centers, Goodyear Tire & Rubber, PPD
all across the region. Many colleges and           River by the US Department of the Interior.       Inc., Mountaire Farms of NC, Progress Energy,
universities in the region have performing arts                                                      and Cape Fear Valley Health Systems.
that feature performers and speakers of            The Cape Fear River is also a blackwater
national and international renown. Several         river but does not have the Federal               Educational attainment has an integral link to
cities also have regional theaters, symphonies,    designation. The Cape Fear headwaters are         the wage-earning capacity of individuals.
and local arts councils.                           located near Greensboro and Cape Fear             Advancing the level of education in the
                                                   flows into the Atlantic Ocean near Cape Fear,     population leads to better economic outcomes
The region includes state parks, lakes, rivers,    a prominent headland, from which it takes its     for individuals and the communities in which
fertile farms, and pine-covered woodlands.         name. A series of locks and dams, all located     they live. Educational attainment is
The condition of our natural environment in the    in Bladen County, make the river navigable        advancing in the region. The percentage of
region impacts our public health, economic         from Wilmington to Fayetteville.                  the population 25 years and older with less
and recreational opportunities, among many         Opportunities for boating, fishing, swimming,     than a high school education and without a
others. Our overall quality of life is,            canoeing, and other recreational activities are   diploma decreased from 2000 to 2010.
arguably, connected to the quality of              available along its entire length.                During the same period, the percentage of
environment in which we live and work.                                                               population with Associate’s, Bachelor’s,
Protection for and wise use of our natural         The counties of Pender, New Hanover, and          and Graduate degrees increased.
environment—air, land, and water                   Brunswick include miles of Atlantic shoreline
resources—are essential to support the             and numerous towns that have built upon the       Transportation
economic growth and development of the             ocean amenities. In addition to the               The region has a unique network of
region now and for future generations.             beachfront, this coastal region also includes     transportation assets that continues to spur
Within the region, there are approximately         wetland areas which are also major natural        economic advantages. The Port of
1.2 million acres of forested land. As is true     attractions for people and wildlife alike.        Wilmington, the region’s “gateway of the
for the state, the majority of that—76                                                               global economy”, connects firms across the
percent—is in private hands. Forest resources      Temperate climate, abundant waterways,            state to buyers and suppliers around the
in the region support wildlife habitat and         stimulating historical attractions, and outdoor   world. Interstate 95 and 40, along with US
offer numerous opportunities for recreation.       recreational amenities produce an enviable        Highway 74 forms a triangle of major
Forest resources also support jobs and incomes     quality of life for those who live and work in    highway access across the region.
in the region.                                     the region.

                                                                          4
SUMMARY BACKGROUND
Two of the Nation’s premiere freight railway                                      Duty students, 8,757 civilian employees,          County was $477.68 million, and for
companies serve this region—CSX                                                   3,516 Contractors, and 62,962 active duty         Brunswick County was $470.58 million ranking
Transportation and Norfolk Southern. The                                          family members. There are 98,507 Army             them 8th and 10th in the State for 2013.5
region is home to several smaller short line rail                                 retirees and family members in the area. The
companies—Aberdeen & Rockfish Railroad,                                           annual base payroll is approximately $3           There has been a distinct difference in the
Carolina Southern Railroad, and Laurinburg &                                      billion.4                                         economic growth of the urban and rural areas
Southern Railroad.                                                                                                                  in the region. While larger cities have
                                                                                  The military in our region maintain two army      experienced rapid population and economic
Just recently, intermodal rail service returned                                   air fields—Simmons and Pope. Both air fields      growth, many of the small towns have
to the Port of Wilmington with the debut of a                                     are located in Cumberland County, as part         suffered from loss of jobs and population.
new freight rail service, dubbed the Queen                                        of Fort Bragg, a military installation of
City Express. The service will allow massive                                      the United States Army and is the largest         The economy of the region cover two
containers of goods to travel from the Port of                                    military installation in the world (by            metropolitan areas—Fayetteville and
Wilmington to Charlotte and vice versa—                                           population).                                      Wilmington. Biotechnology and life sciences
taking trucks off the highways and perhaps                                                                                          are poised to experience significant growth in
further incentivizing new business in the region                                  As part of the Base Closure and Reassignment      the region, including in the Wilmington MSA,
and state.3                                                                       (BRAC) process, Fort Bragg took command of        supported by the knowledge based workers
                                                                                  Pope Field, formerly known as Pope Air Force      in the area. In the Fayetteville MSA, there is
Air travel is highlighted in the region by a                                      Base. The US Army Forces Command                  a larger concentration of distribution and
system of fourteen smaller airports and two                                       (FORSCOM) and U.S. Army Reserve                   logistics, and defense related businesses
major public airports offering commercial jet                                     Command (USARC) were relocated to Fort            supported by the military installation and
service, all of which are designed to                                             Bragg in 2011. This has created a variety of      access to I-95.
accommodate private and commercial needs.                                         new opportunities for businesses located in the
Commercial jet service is provided to                                             region. FORSCOM alone has a $30 billion           Anchor industries such as agriculture and
Wilmington International and Fayetteville                                         annual obligation authority for defense and       healthcare provide a solid foundation that
Regional Airport. The Laurinburg-Maxton                                           other contracts.4 This provides unmatched         continues to support the region. In the rural
Airport, with its accompanying industrial                                         opportunities for enterprising businesses that    areas of the region there is a greater focus on
development complex, is quickly evolving into                                     want to compete for these dollars.                the agriculture, food processing and
a major facility and can accommodate most                                                                                           advanced manufacturing industries.
types of private and commercial usages.                                           Economy
                                                                                  The diverse economy of the region includes        The urban and rural areas offer
Military                                                                          a mix of commercial, retail and industrial        complementary assets, and better integration
Fort Bragg was built as the first modern                                          businesses augmented by tourism. North            between them is important for socio-economic
military base in the state in 1918. It serves a                                   Carolina is the 6th most visited state in the     performance of the region. A diversified
population of 52,280 active duty Soldiers,                                        country. The direct economic impact of tourist    economy creates a sustainable cycle of
12,624 Reserve Components and Temporary                                           dollars spent in 2013 for New Hanover             economic activity.
3https://www.bizjournals.com/triangle/news/2016/07/20/what-the-new-queen-city-express-raildoes-for-nc.html?s=print                       5https://www.nccommerce.com/tourism/research/economic-impact/teim

4https://www.nccommerce.com/Portals/47/Publications/Industry%20Reports/2015-Economic-Impact-of-the-Military-on-North-Carolina.pdf

                                                                                                                     5
SEDC REGION

6
SWOT ANALYSIS
STRENGTHS: WEAKNESSES: OPPORTUNTIES: THREATS:
Competitive Advantages Competitive Disadvantages Regional Improvement or Progress Negative Impacts
NC Port of Wilmington Affordable and Quality Military Failing Infrastructure
Housing
Regional Airports Tourism Housing Options
Mental Health System
Quality of Life Agri-Tourism Water Quality and
Industrial Building Shortage Availability
Right-to-work State Workforce Development
Aging Infrastructure Natural Disasters
Universities and Community Agricultural Industries
Colleges Youth Exodus Environmental Issues
Wastewater Regionalization
Transportation Network Aging Workforce BRAC 2018
Climate
Agricultural Expertise Broadband and Drug Epidemic
Entrepreneurial and Small
Telecommunications
Available Certified Sites Business Support Unfunded Mandates
Aging School Facilities
Military Presence Capital for Businesses Economic Gap—2 NCs
Youth Recreation and Agriculture Labor Force
Biotechnology and Marine Higher Education Institutions
Lifestyle Opportunities
Sciences Health Care Industrial Automation
Childcare
Cost of Doing Business North Carolina Coast Youth Flight
Political Cohesiveness
Public-Private Partnerships Leveraging Urban Growth High School Drop-out Rate
Capital for Businesses
Life Sciences Incentives
Regional Identity
Small Business Regulations
Regional Cooperation
Healthcare Provider Shortages
In compilation of the 2017-2022 CEDS, the SEDC conducted a Strengths, Weaknesses, Opportunities, and Threats (SWOT) analysis to lay the
foundation for CEDS strategies, goals, and objectives. The SWOT analysis was completed via secondary research and stakeholder feedback
garnered through interviews and roundtable discussions.
7
REGIONAL DATA SHEET
SOURCES
Includes the Counties of: 1. Stats America 2015-16
2. NC Office of Bud & Mgt
7. NC Dept of Rev 2016-17
8. Southeastern Univ Consortium
3. Suburban Stats 2016 9. Census, ACS 2015
4. Data USA 2015 10. Bureau of Labor & Stats 2016
Bladen, Brunswick, Columbus, Cumberland, Harnett, 5. nccomm.com 2015 11. Center for Am. Progress 2015
6. livingwage.mit.edu 12. Public Schools of NC Annual
Hoke, New Hanover, Pender, Richmond, Robeson, Sampson & Scotland Dropout Report 2015-16
Region NC
1
P 2010 Census Female3 Median Age Median Property Value4 Median Household Income $41,149 $47,830
9
1
O
1,217,051 51% 38 H $120,008
E
Per Capita Personal Income $32,969 $40,759
P 3 O C
2016 Estimate Male Age 65+ Homeowner Vacancy Rate 5
Per Capita Living Wage6 $22,036 $22,797
U O
1,287,584 49% 15% U 2.44% County Property Tax7 N/A N/A
L N
Growth in population S
A since 2010 census Minority Under 18 Rental Vacancy Rate5 O Unemployment Rate 6.47% 4.90%
T I M 10
5.8% 40% 24% N 9.54% Total Labor Force 539,133 4,920,437
I I 11
O 2020/2030 Proj.2 G Occupied Housing Units1 C Poverty Rate 21.83% 17.2%
N 1,324,264 / 1,418,069 40,070 Food Insecurity Rate8 19.25% 16.5%
LARGEST PRIVATE SECTOR EMPLOYERS5 $30,747 $41,098 $40,118
2016 LARGEST INDUSTRIES1
4473 2682 2267
Wal-Mart Associates Inc New Hanover Reg. Med $40,205 $49,093
Food Lion PPD, Inc 8465 6107 Retail Trade
Smithfield Foods Inc. Goodyear Tire & Rubber $50,396 Manufacturing
Cape Fear Valley Health Systems Progress Energy Serv. 9540 $23,635
41437 Health Care & Social Services
Lowes Home Centers Inc. Mountaire Farms of NC $40,744
14790 Accommodation & Food Services
EDUCATIONAL ATTAINMENT1 Public Administration
High School or more 82.8% $23,242
16764 $46,665
Adm., Support, Waste Mgmt & Rem Serv.
Bachelor Degree or more 18.8% 39111
$39,930 Construction
High School Dropout rate 2.32%12 18344
Professional, Scientific & Technical Serv
HIGHER EDUCATION $13,523
$36,401 Educational Services
33480
Campbell University Brunswick Community College 34799
Fayetteville State University Cape Fear Community College Wholesale Trade
Methodist University Central Carolina Community College
St. Andrews University Fayetteville Technical Community College $ = annual average wage per job Agriculture, Forestry, Fishing & Hunting
UNC Pembroke Richmond Community College # = total number of jobs
UNC Wilmington Robeson Community College Since 2006, jobs increased by 7,573 for the region. Finance & Insurance
Miller Motte College Sampson Community College
Bladen Community College Sandhills Community College Average wages increased $7,037/co or 24.9%. Transportation & Warehousing
Southeastern Community College
8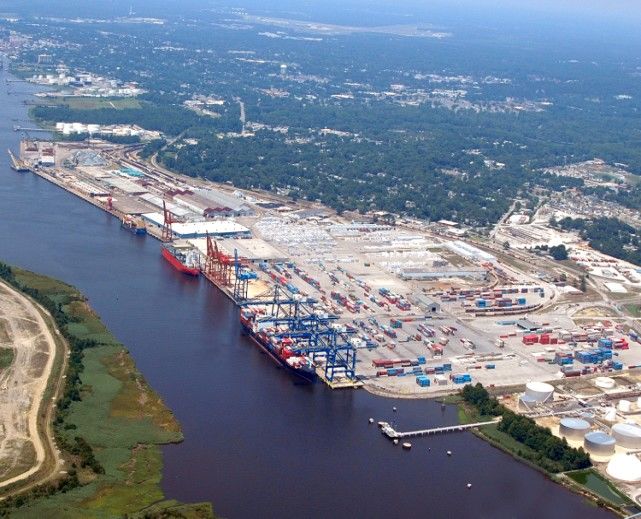
BLADEN COUNTY DATA SHEET
SOURCES
BLADEN COUNTY, NC 1. Stats America 2015-16
2. NC Office of Bud & Mgt
7. NC Dept of Rev 2016-17
8. Southeastern Univ Consortium
3. Suburban Stats 2016 9. Census, ACS 2015
County Seat: Elizabethtown (3,544) 4. Data USA 2015
5. nccomm.com 2015
10. Bureau of Labor & Stats 2016
11. Center for Am. Progress 2015
6. livingwage.mit.edu 12. Public Schools of NC Annual
Founded in 1739 Dropout Report 2015-16
County NC
1
P 2010 Census Female3 Median Age Median Property Value4 Median Household Income $33,882 $47,8309
1
O H E
P
35,190 52% 42.6 $85,000 C
Per Capita Personal Income $32,681 $40,759
O
U 2016 Estimate Male3 Age 65+ Homeowner Vacancy Rate5 O Per Capita Living Wage6 $21,278 $22,797
U County Property Tax7
L 33,741 48% 17.7% 1.10% N $0.82/$100 N/A
Growth in population S
A since 2010 census Minority Under 18 Rental Vacancy Rate 5 O Unemployment Rate 6.90% 4.90%
T I M
-4% 44% 22% N 9.40% Total Labor Force 14,723 4,920,43710
I I 11
O 2020/2030 Proj.2 G Occupied Housing Units1 C Poverty Rate 25.40% 17.2%
N 35,009 / 35,010 14,401 Food Insecurity Rate8 21% 16.5%
$42,298
LARGEST PRIVATE SECTOR EMPLOYERS5 $42,014
$33,841 119 LARGEST INDUSTRIES1
Smithfield Foods, Inc. First Source Staffing $39,006 124
329 254
Manufacturing
Gildan Yarns LLC Lineage Logistices LLC $14,060
Cape Fear Valley Health Systems Wal-Mart Assoc. Inc. 497
$20,089 Retail Trade
Specialty Products Technology Chemours 646
Packers Sanitation Serv. Inc. Ltd Kuraray Public Administration
1 $30,902 Agriculture, Forestry, Fishing & Hunting
EDUCATIONAL ATTAINMENT 789
High School or more 79% $35,805 $39,774 Adm., Support, Waste Mgmt & Remedial
917 5802 Serv.
Bachelor Degree or more 14% Accommodation & Food Services
12
$21,623
High School Dropout rate 1.48% 940
Transportation & Warehousing
Construction
HIGHER EDUCATION
$ = annual average wage per job
# = number of jobs Finance & Insurance
Since 2006, jobs decreased by 330 or 2.5%.
Average wages increased $8,221 or 31.4%. Professional, Scientific & Technical Services
9BRUNSWICK COUNTY DATA SHEET
SOURCES
BRUNSWICK COUNTY, NC 1. Stats America 2015-16
2. NC Office of Bud & Mgt
7. NC Dept of Rev 2016-17
8. Southeastern Univ Consortium
3. Suburban Stats 2016 9. Census, ACS 2015
County Seat: Bolivia (143) 4. Data USA 2015
5. nccomm.com 2015
10. Bureau of Labor & Stats 2016
11. Center for Am. Progress 2015
6. livingwage.mit.edu 12. Public Schools of NC Annual
Founded in 1764 Dropout Report 2015-16
County NC
1
P 2010 Census Female3 Median Age Median Property Value4 Median Household Income $48,831 $47,8309
1
O H E
P 107,431 51% 49 $182,500 C Per Capita Personal Income $36,307 $40,759
O
U 2016 Estimate Male3 Age 65+ Homeowner Vacancy Rate5 O Per Capita Living Wage6 $23,878 $22,797
U County Property Tax7
L 126,953 49% 26.0% 3.70% N $0.485/$100 N/A
Growth in population S
A since 2010 census Minority Under 18 Rental Vacancy Rate5 O Unemployment Rate 6.3% 4.9%
T I M
18% 17% 18% N 23.40% Total Labor Force 49758 4,920,43710
I I 11
O 2020/2030 Proj.2 G Occupied Housing Units1 C Poverty Rate 14.30% 17.2%
N 138,430 / 170,230 49,193 Food Insecurity Rate8 15% 16.5%
21
$60,139
LARGEST PRIVATE SECTOR EMPLOYERS 5
$48,769 1164 LARGEST INDUSTRIES1
Progress Energy Service Co. Liberty Healthcare Grp. 1289
Retail Trade
$111,840
Wal-Mart Associates Inc. McAndersons Inc. 1341 $23,837
Food Lion Dosher Mem. Hospital 5102 Accommodation & Food Services
$29,180
Brunswick Novant Med. Center Troon Golf LLC
1486 Health Care & Social Services
Lowes Foods LLC SBH Wilmington LLC
$19,266 Public Administration
1
1505
EDUCATIONAL ATTAINMENT $16,170
High School or more 87% $41,811 Construction
4411
1892
Bachelor Degree or more 26% Arts, Entertainment & Recreation
12 $43,783
High School Dropout rate 3.28% 2219 $40,311
3746 Adm. & Waste Mgmt & Remediation
Services
Utilities
HIGHER EDUCATION
$ = annual average wage per job
# = number of jobs Manufacturing
Since 2006, jobs increased by 3,148 or 11.3%.
Average wages increased $6,988 or 23.3%. Professional, Scientific & Technical Services
10COLUMBUS COUNTY DATA SHEET
SOURCES
COLUMBUS COUNTY, NC 1. Stats America 2015-16
2. NC Office of Bud & Mgt
7. NC Dept of Rev 2016-17
8. Southeastern Univ Consortium
3. Suburban Stats 2016 9. Census, ACS 2015
County Seat: Whiteville (5,168) 4. Data USA 2015
5. nccomm.com 2015
10. Bureau of Labor & Stats 2016
11. Center for Am. Progress 2015
6. livingwage.mit.edu 12. Public Schools of NC Annual
Founded in 1833 Dropout Report 2015-16
County NC
1
P 2010 Census Female3 Median Age Median Property Value4 Median Household Income $34,478 $47,8309
1
O H E
P 58,090 50% 41 $83,900 C Per Capita Personal Income $30,262 $40,759
O
U 2016 Estimate Male3 Age 65+ Homeowner Vacancy Rate5 O Per Capita Living Wage6 $21,091 $22,797
U County Property Tax7
L 56,505 50% 17.0% 1.80% N $0.805/$100 N/A
Growth in population S
A since 2010 census Minority Under 18 Rental Vacancy Rate5 O Unemployment Rate 6.4% 4.90%
T I M
-2.7% 39% 23% N 10.50% Total Labor Force 22,778 4,920,43710
I I 11
O 2020/2030 Proj.2 G Occupied Housing Units1 C Poverty Rate 24.00% 17.2%
N 57,089 / 57,088 22,006 Food Insecurity Rate8 20% 16.5%
LARGEST PRIVATE SECTOR EMPLOYERS5 $34,175 $26,128
430 393
LARGEST INDUSTRIES1
Atlantic Corporation $41,445
International Paper Co. Inc. Health Care & Social Services
475
Century Employer Org. LLC Community Innovations
Columbus Reg. Healthcare Sys. National Spinning Co. $39,774 Retail Trade
BB&T Food Lion $24,182 2731
1024
Wal-Mart Associates Liberty Healthcare Grp Manufacturing
$13,030
1 1096 Public Administration
EDUCATIONAL ATTAINMENT $23,888
High School or more 79.6% $35,013 2064 Educational Services
1356
Bachelor Degree or more 12%
12
Accommodation & Food Services
High School Dropout rate 1.81% $35,753 $59,538
1755 1958 Admin & Support & Waste Mgmt & Rem.
Serv.
Finance & Insurance
HIGHER EDUCATION
$ = annual average wage per job
# = number of jobs Construction
Since 2006, jobs decreased by 1,297 or 7.7%.
Average wages increased $5,242 or 18.3% Ag, Forestry, Fishing & Hunting
11CUMBERLAND COUNTY DATA SHEET
SOURCES
CUMBERLAND COUNTY, NC 1. Stats America 2015-16
2. NC Office of Bud & Mgt
7. NC Dept of Rev 2016-17
8. Southeastern Univ Consortium
3. Suburban Stats 2016 9. Census, ACS 2015
County Seat: Fayetteville (204,759) 4. Data USA 2015
5. nccomm.com 2015
10. Bureau of Labor & Stats 2016
11. Center for Am. Progress 2015
6. livingwage.mit.edu 12. Public Schools of NC Annual
Founded in 1754 Dropout Report 2015-16
County NC
1
P 2010 Census Female3 Median Age Median Property Value4 1 Median Household Income $42,380 $47,830
9
O H E
P 319,431 52% 31.1 $128,600 C Per Capita Personal Income $37,611 $40,759
O
U 2016 Estimate Male3 Age 65+ Homeowner Vacancy Rate5 O Per Capita Living Wage6 $23,733 $22,797
U County Property Tax7
L 327,127 48% 11.0% 3.40% N $0.74/$100 N/A
Growth in population S
A since 2010 census Minority Under 18 Rental Vacancy Rate5 O Unemployment Rate 6.3% 4.90%
T I M
2.4% 48% 26% N 8.80% Total Labor Force 127,861 4,920,43710
I I 11
O 2020/2030 Proj.2 G Occupied Housing Units1 C Poverty Rate 18.80% 17.2%
N 325,775 / 325,117 122,643 Food Insecurity Rate8 20% 16.5%
$42,014
LARGEST PRIVATE SECTOR EMPLOYERS5 254 $33,841 $42,298 LARGEST INDUSTRIES1
Cape Fear Valley Health Systems Pruitthealth Vet. Serv. 124 119
$39,006 Manufacturing
$14,060
Wal-Mart Associates Eaton Corporation 497
329
Goodyear Tire and Rubber Inc. Sykes Enterprises Inc. $20,089 Retail Trade
Food Lion Methodist Uinversity 646
Purolator Filters Na LLC Lowes Home Centers Public Administration
1 $30,902 Agriculture, Forestry, Fishing & Hunting
EDUCATIONAL ATTAINMENT 789
Adm., Support, Waste Mgmt & Remedial
High School or more 90% $35,805
$39,774
Serv.
5802
Bachelor Degree or more 23.3% 917 Accommodation & Food Services
12
High School Dropout rate 2.55% $21,623
940 Transportation & Warehousing
Construction
HIGHER EDUCATION
$ = annual average wage per job
Finance & Insurance
# = number of jobs
Since 2006, jobs increased by 2,598 or 2.2%.
Professional, Scientific & Technical Services
Average wages increased $8,784 or 27.7%.
12HARNETT COUNTY DATA SHEET
SOURCES
HARNETT COUNTY, NC 1. Stats America 2015-16
2. NC Office of Bud & Mgt
7. NC Dept of Rev 2016-17
8. Southeastern Univ Consortium
3. Suburban Stats 2016 9. Census, ACS 2015
County Seat: Lillington (3,581) 4. Data USA 2015
5. nccomm.com 2015
10. Bureau of Labor & Stats 2016
11. Center for Am. Progress 2015
6. livingwage.mit.edu 12. Public Schools of NC Annual
Founded in 1855 Dropout Report 2015-16
County NC
1
P 2010 Census Female3 Median Age Median Property Value4 Median Household Income $48,301 $47,830 9
1
O H E
P 114,678 50% 33.6 $135,400 C Per Capita Personal Income $31,129 $40,759
O
U 2016 Estimate Male3 Age 65+ Homeowner Vacancy Rate5 O Per Capita Living Wage6 $21,611 $22,797
U County Property Tax7
L 130,881 50% 11.0% 2.40% N $0.75/$100 N/A
Growth in population S
A since 2010 census Minority Under 18 Rental Vacancy Rate5 O Unemployment Rate 5.7% 4.90%
T I M
14.1% 32% 27% N 8.20% Total Labor Force 51,533 4,920,43710
I I 11
O 2020/2030 Proj.2 G Occupied Housing Units1 C Poverty Rate 17.70% 17.2%
N 134,189 / 148,167 42,672 Food Insecurity Rate8 18% 16.5%
$50,720
LARGEST PRIVATE SECTOR EMPLOYERS5 $22,833
$46,654 499 LARGEST INDUSTRIES1
575
Food Lion Champion Home Builders 991
Retail Trade
Campbell University, Inc. Multitech Mech. Support
Betsy Johnson Memorial Hospital Edwards Bro. Malloy $24,295 Health Care & Social Services
Wal-Mart Associates, Inc. Principle Long Term Care $45,816 4087
Carlie C's Operation Center, Inc. Godwin Mfg. Co. Inc 1436 Accommodation & Food Services
1
$41,700 Manufacturing
EDUCATIONAL ATTAINMENT 1632
$28,252
High School or more 85.6% 2580
Public Adminstration
$38,957
Bachelor Degree or more 19.6% 1831 Construction
12
High School Dropout rate 4%
$38,633 $12,817
Educational Services
1969 2522
HIGHER EDUCATION Adm. & Support & Waste Mgmt & Rem.
Serv.
$ = annual average wage per job
# = number of jobs Professional, Scientific & Technical Services
Since 2006, jobs increased by 820 or 3.5%.
Average wages increased $5,205 or 18.3% Finance & Insurance
13HOKE COUNTY DATA SHEET
SOURCES
HOKE COUNTY, NC 1. Stats America 2015-16
2. NC Office of Bud & Mgt
7. NC Dept of Rev 2016-17
8. Southeastern Univ Consortium
3. Suburban Stats 2016 9. Census, ACS 2015
County Seat: Raeford (4,998) 4. Data USA 2015
5. nccomm.com 2015
10. Bureau of Labor & Stats 2016
11. Center for Am. Progress 2015
6. livingwage.mit.edu 12. Public Schools of NC Annual
Founded in 1911 Dropout Report 2015-16
County NC
1
P 2010 Census Female3 Median Age Median Property Value4 Median Household Income $42,819 $47,8309
1
O H E
P 46,952 51% 31.4 $141,500 C Per Capita Personal Income $29,382 $40,759
O
U 2016 Estimate Male3 Age 65+ Homeowner Vacancy Rate5 O Per Capita Living Wage6 $21,507 $22,797
U County Property Tax7
L 53,262 49% 8.0% 3.50% N $0.75/$100 N/A
Growth in population S
A since 2010 census Minority Under 18 Rental Vacancy Rate5 O Unemployment Rate 6.5% 4.90%
T I M
13.4% 54% 29% N 9.80% Total Labor Force 19,973 4,920,43710
I I 11
O 2020/2030 Proj.2 G Occupied Housing Units1 C Poverty Rate 19.90% 17.2%
N 58,774 / 70,888 16,990 Food Insecurity Rate8 19% 16.5%
$45,086
LARGEST PRIVATE SECTOR EMPLOYERS5 $35,558 152 LARGEST INDUSTRIES1
Butterball LLC Wal-Mart Assoc. Inc $40,713 202
261 Manufacturing
The Staffing Alliance LLC First Health Carolinas $43,838
Cape Fear Valley Health Systems Autumn Corporation 338
Health Care & Social Services
Conopco Inc. House of Raeford Inc.
$43,024
Burlington Industries Food Lion 1686 Retail Trade
$11,964
1 410
EDUCATIONAL ATTAINMENT Adm., Support, Waste Mgmt & Remedial
$11,084 Serv.
High School or more 85% 429
Bachelor Degree or more 19.3% Accommodation & Food Services
12
High School Dropout rate 1.77% $22,240
$24,923 Public Administration
761
1254
Construction
HIGHER EDUCATION
$ = annual average wage per job
Transportation & Warehousing
# = number of jobs
Since 2006, jobs increased by 300 or 3.8%.
Average wages increased $8,730 or 34.4%. Wholesale Trade
14NEW HANOVER COUNTY DATA SHEET
SOURCES
NEW HANOVER COUNTY, NC 1. Stats America 2015-16
2. NC Office of Bud & Mgt
7. NC Dept of Rev 2016-17
8. Southeastern Univ Consortium
3. Suburban Stats 2016 9. Census, ACS 2015
County Seat: Wilmington (112,067) 4. Data USA 2015
5. nccomm.com 2015
10. Bureau of Labor & Stats 2016
11. Center for Am. Progress 2015
6. livingwage.mit.edu 12. Public Schools of NC Annual
Founded in 1729 Dropout Report 2015-16
County NC
1
P 2010 Census Female3 Median Age Median Property Value4 Median Household Income $52,456 $47,830
9
1
O H E
P 202,667 52% 37.8 $214,300 C Per Capita Personal Income $40,487 $40,759
O
U 2016 Estimate Male3 Age 65+ Homeowner Vacancy Rate5 O Per Capita Living Wage6 $24,066 $22,797
U County Property Tax7
L 223,483 48% 15.0% 2.50% N $0.623/$100 N/A
Growth in population S
A since 2010 census Minority Under 18 Rental Vacancy Rate5 O Unemployment Rate 4.7% 4.90%
T I M
10.3% 19% 20% N 6.70% Total Labor Force 116,676 4,920,43710
I I 11
O 2020/2030 Proj.2 G Occupied Housing Units1 C Poverty Rate 17.30% 17.2%
N 234,826 / 264,016 88,403 Food Insecurity Rate8 16% 16.5%
LARGEST PRIVATE SECTOR EMPLOYERS5 $44,515 $57,206 LARGEST INDUSTRIES1
4416 3549
New Hanover Regional Med. Ctr Harris Teeter Accommodation & Food Services
$48,733
PPD, Inc. Food Lion
5241
Cellco Partnership GE Hitachi Nuclear Amer. $16,112 Retail Trade
Wal-Mart Associates WHA Medical Clinic 15596
$79,617 Health Care & Social Services
Corning Inc. Carolina Healthcare 5458
Professional, Scientific & Technical Services
1 $47,904
EDUCATIONAL ATTAINMENT 5913 $27,527
15162 Admin. & Support & Waste Mgmt & Rem.
High School or more 91.7% $20,089 Serv
Bachelor Degree or more 36.9% 7041 Construction
12 $72,953 $46,106
High School Dropout rate 1.65% 7370 12358 Manufacturing
Public Administration
HIGHER EDUCATION $ = annual average wage per job
# = number of jobs Educational Services
Since 2006, jobs increased by 9,005 or 9%.
Average wages increased $8,170 or 23.7%. Wholesale Trade
15PENDER COUNTY DATA SHEET
SOURCES
PENDER COUNTY, NC 1. Stats America 2015-16
2. NC Office of Bud & Mgt
7. NC Dept of Rev 2016-17
8. Southeastern Univ Consortium
3. Suburban Stats 2016 9. Census, ACS 2015
County Seat: Burgaw (4,096) 4. Data USA 2015
5. nccomm.com 2015
10. Bureau of Labor & Stats 2016
11. Center for Am. Progress 2015
6. livingwage.mit.edu 12. Public Schools of NC Annual
Founded in 1875 Dropout Report 2015-16
County NC
1
P 2010 Census Female3 Median Age Median Property Value4 Median Household Income $49,390 $47,830
9
1
O H E
P 52,217 50% 42.1 $153,400 C Per Capita Personal Income $32,937 $40,759
O
U 2016 Estimate Male3 Age 65+ Homeowner Vacancy Rate5 O Per Capita Living Wage6 $22,422 $22,797
U County Property Tax7
L 59,090 50% 16.7% 3.40% N $0.685/$100 N/A
Growth in population S
A since 2010 census Minority Under 18 Rental Vacancy Rate5 O Unemployment Rate 5.3% 4.90%
T I M
13.2% 24% 22% N 13.60% Total Labor Force 26,687 4,920,43710
I I 11
O 2020/2030 Proj.2 G Occupied Housing Units1 C Poverty Rate 14.80% 17.2%
N 64,102 / 76,410 20,130 Food Insecurity Rate8 15% 16.5%
LARGEST PRIVATE SECTOR EMPLOYERS5
$43,335
$26,461 231 LARGEST INDUSTRIES1
Pender Memorial Hospital RC Creations LLC $30,600 345
Retail Trade
L L Building Products (A Corp) Woodbury Wellness Ctr. 399
$41,433
Food Lion Lowes Home Centers Inc 434 $24,254 Accommodation & Food Services
Wal-Mart Associates Inc. Daybreak Rocky Mount 1550
C W Wright Construction Co LLC Huntington Health Care Health Care & Social Services
$42,796
1
720 Construction
EDUCATIONAL ATTAINMENT
$14,578
High School or more 85.7% $42,051 1386 Wholesale Trade
Bachelor Degree or more 21.2% 724
12 Manufacturing
High School Dropout rate 1.5% $39,157 $33,327
988 Public Administration
1144
Adm. & Support & Waste Mgmt & Rem.
HIGHER EDUCATION Serv.
$ = annual average wage per job
# = number of jobs Other Services(Except Public Adm.)
Since 2006, jobs increased by 719 or 6.7%.
Average wages increased $6,722 or 25.3%. Real Estate & Rental & Leasing
16RICHMOND COUNTY DATA SHEET
RICHMOND COUNTY, NC
SOURCES
1. Stats America 2015-16 7. NC Dept of Rev 2016-17
2. NC Office of Bud & Mgt 8. Southeastern Univ Consortium
3. Suburban Stats 2016 9. Census, ACS 2015
County Seat: Rockingham (9,080) 4. Data USA 2015
5. nccomm.com 2015
10. Bureau of Labor & Stats 2016
11. Center for Am. Progress 2015
Founded in 1779 6. livingwage.mit.edu 12. Public Schools of NC Annual
Dropout Report 2015-16
County NC
P 1
2010 Census Female3 Median Age Median Property Value4 Median Household Income $33,017 $47,830
9
1
O H E
P 46,639 51% 40 $78,600 C Per Capita Personal Income $31,361 $40,759
O
U 2016 Estimate Male3 Age 65+ Homeowner Vacancy Rate5 O Per Capita Living Wage6 $22,006 $22,797
U
L 44,939 49% 15.5% 2.10% N County Property Tax7 $.79/$100 N/A
Growth in population S
A Minority Under 18 Rental Vacancy Rate5 O Unemployment Rate 7% 4.90%
T
since 2010 census
I M
-3.6% 37% 24% N 5.00% Total Labor Force 16,883 4,920,43710
I I 11
O 2020/2030 Proj.2 G Occupied Housing Units1 C Poverty Rate 28.70% 17.2%
N 45,058 / 44,450 18,461 Food Insecurity Rate8 21% 16.5%
LARGEST PRIVATE SECTOR EMPLOYERS5 $38,035 LARGEST INDUSTRIES1
$37,527 193
Perdue Products Inc CHSPSC LLC 230 Manufacturing
First Health of The Carolinas Inc Cascades Holding Us $28,619 $35,316
Burlington Industries V LLC Superior Cranes Inc 329 809 Retail Trade
Wal-Mart Associates Inc Food Lion $43,664 $35,888
Plastek Industries Inc Hood Packaging Corp 729 2984 Health Care & Social Services
1 Accommodation & Food Services
$35,316
EDUCATIONAL ATTAINMENT 809
High School or more 80.6% Public Administration
Bachelor Degree or more 12.8% $11,477
12 1078 $24,526 Construction
High School Dropout rate 3.27% 1897
$37,586 Admin & Support & Waste Mgmt & Rem.
1765 Serv.
Transportation & Warehousing
HIGHER EDUCATION
$ = annual average wage per job
# = number of jobs Other Services (Except Public
Administration)
Since 2006, jobs decreased by 1,569 or 10.4%.
Average wages increased $7,347 or 28.1% Professional, Scientific & Technical Services
17ROBESON COUNTY DATA SHEET
SOURCES
ROBESON COUNTY, NC 1. Stats America 2015-16
2. NC Office of Bud & Mgt
7. NC Dept of Rev 2016-17
8. Southeastern Univ Consortium
3. Suburban Stats 2016 9. Census, ACS 2015
County Seat: Lumberton (21,499) 4. Data USA 2015
5. nccomm.com 2015
10. Bureau of Labor & Stats 2016
11. Center for Am. Progress 2015
6. livingwage.mit.edu 12. Public Schools of NC Annual
Founded in 1787 Dropout Report 2015-16
County NC
1
P 2010 Census Female3 Median Age Median Property Value4 Median Household Income $32,128 $47,830
9
1
O H E
P 134,168 51% 35 $70,200 C Per Capita Personal Income $27,487 $40,759
O
U 2016 Estimate Male3 Age 65+ Homeowner Vacancy Rate5 O Per Capita Living Wage6 $21,278 $22,797
U
L 133,235 49% 13.0% 1.50% N County Property Tax7 $0.77/$100 N/A
Growth in population S
A since 2010 census Minority Under 18 Rental Vacancy Rate5 O Unemployment Rate 7.9% 4.90%
T I M
‐0.7% 70% 26% N 6.40% Total Labor Force 50,767 4,920,437 10
I I 11
O 2020/2030 Proj.2 G Occupied Housing Units1 C Poverty Rate 30.60% 17.2%
N 132,087 / 129,510 45,773 Food Insecurity Rate8 23% 16.5%
LARGEST PRIVATE SECTOR EMPLOYERS5 $37,527 $38,035
LARGEST INDUSTRIES1
1025 $35,316 792
Mountaire Farms of NC Inc The Staffing Alliance LLC 911
$28,619 Health Care & Social Services
Southeastern Reg. Medical Ctr. BB&T 1362
Wal‐Mart Associates Inc. Kayser‐Roth Corporation
Manufacturing
Campbell Soup Supply Co. LLC Primary Health Choice $35,888
Two Hawk Employment Services Prestage Foods 7213 Retail Trade
$43,664
2410
1 Accommodation & Food Services
EDUCATIONAL ATTAINMENT $35,316
High School or more 75.1% 2762
Public Administration
Bachelor Degree or more 12.8% $24,526
12 $11,477 6458 Admin & Support & Waste Mgmt & Rem.
High School Dropout rate 1.71% 3620 Serv
Construction
$37,586
4957
HIGHER EDUCATION Finance & Insurance
$ = annual average wage per job
# = number of jobs Wholesale Trade
Since 2006, jobs decreased by 1,507 or 3.8%.
Average wages increased $5,418 or 20.1%. Transportation & Warehousing
18SAMPSON COUNTY DATA SHEET
SOURCES
SAMPSON COUNTY, NC 1. Stats America 2015-16
2. NC Office of Bud & Mgt
7. NC Dept of Rev 2016-17
8. Southeastern Univ Consortium
3. Suburban Stats 2016 9. Census, ACS 2015
County Seat: Clinton (8,674) 4. Data USA 2015
5. nccomm.com 2015
10. Bureau of Labor & Stats 2016
11. Center for Am. Progress 2015
6. livingwage.mit.edu 12. Public Schools of NC Annual
Founded in 1784 Dropout Report 2015-16
County NC
P1 2010 Census Female3 Median Age Median Property Value4 Median Household Income $40,660 $47,8309
1
O H E
P 63,431 51% 39 $87,600 C Per Capita Personal Income $35,357 $40,759
O
U 2016 Estimate Male3 Age 65+ Homeowner Vacancy Rate5 O Per Capita Living Wage6 $20,176 $22,797
U
L 63,124 49% 16.0% 1.70% N County Property Tax7 $0.825/$100 N/A
Growth in population S
A since 2010 census Minority Under 18 Rental Vacancy Rate5 O Unemployment Rate 5.4% 4.90%
T I M
‐0.5% 39% 25% N 6.70% Total Labor Force 29,801 4,920,43710
I I 11
O 2020/2030 Proj.2 G Occupied Housing Units1 C Poverty Rate 21.40% 17.2%
N 63,992 / 63,994 27,166 Food Insecurity Rate8 17% 16.5%
LARGEST PRIVATE SECTOR EMPLOYERS5 $43,633
$27,070
369
$41,447
215 LARGEST INDUSTRIES1
566
Smithfield Foods, Inc. Liberty Healthcare Grp
$39,372 Manufacturing
Prestage Farms Inc Piggly Wiggly 735
Hog Slat Co. Inc McDonalds $47,573 Agriculture, Forestry, Fishing & Hunting
Sampson Reg. Medical Center Golden Fleece Mfg $25,938 2897
Wal‐Mart Associates Inc. Temporary Connections 741 Retail Trade
1 $51,031 Accommodation & Food Services
EDUCATIONAL ATTAINMENT 771
High School or more 75.2% Wholesale Trade
$12,496
Bachelor Degree or more 12.4% 1216
$35,055
Admin & Support & Waste Mgmt & Rem.
12 2502
High School Dropout rate 2.26% Serv.
Construction
$24,552
2295
Public Administration
HIGHER EDUCATION
$ = annual average wage per job
# = number of jobs Other Services(Except Public Administration)
Since 2006, jobs decreased by 529 or 2.8%.
Average wages increased $6,573 or 22.8% Finance & Insurance
19SCOTLAND COUNTY DATA SHEET
SOURCES
SCOTLAND COUNTY, NC 1. Stats America 2015-16
2. NC Office of Bud & Mgt
7. NC Dept of Rev 2016-17
8. Southeastern Univ Consortium
3. Suburban Stats 2016 9. Census, ACS 2015
County Seat: Laurinburg (15,473) 4. Data USA 2015
5. nccomm.com 2015
10. Bureau of Labor & Stats 2016
11. Center for Am. Progress 2015
6. livingwage.mit.edu 12. Public Schools of NC Annual
Founded in 1812 Dropout Report 2015-16
County NC
P 1
2010 Census Female3 Median Age Median Property Value4 Median Household Income $35,447 $47,830
9
1
O H E
P 36,157 52% 39 $79,100 C Per Capita Personal Income $30,625 $40,759
O
U 2016 Estimate Male3 Age 65+ Homeowner Vacancy Rate5 O Per Capita Living Wage6 $21,382 $22,797
U
L 35,244 48% 15.0% 2.20% N County Property Tax7 $1.02/$100 N/A
Growth in population S
A since 2010 census Minority Under 18 Rental Vacancy Rate5 O Unemployment Rate 9.2% 4.90%
T I M
‐2.5% 54% 24% N 6.00% Total Labor Force 11,693 4,920,437 10
I I 11
O 2020/2030 Proj.2 G Occupied Housing Units1 C Poverty Rate 29.00% 17.2%
N 34,933 / 33,189 12,996 Food Insecurity Rate8 26% 16.5%
LARGEST PRIVATE SECTOR EMPLOYERS5 $39,769 $47,934
220
LARGEST INDUSTRIES1
$47,833 340
Scotland Memorial Hospital Farmers Furniture Co.
385
Fcc(North Carolina) LLC St. Andrews Pres. College $35,639 Manufacturing
Wal‐Mart Associates Inc Hanesbrands, Inc. 555
$47,152 Health Care & Social Service
Pilkington North America Inc Meritor Heavy Veh. Sys. $27,160 2088
Maverick Transportation LLC The Presbyterian Home 622
Retail Trade
1
EDUCATIONAL ATTAINMENT $12,603
Educational Services
High School or more 78.7% 1151
$41,575 Accommodation & Food Services
Bachelor Degree or more 15.8% 2008
12
Admin & Support & Waste Mgmt & Rem Serv
High School Dropout rate 2.5% $35,477
1257
$21,552 Public Administration
1682
HIGHER EDUCATION Transportation & Warehousing
$ = annual average wage per job
# = number of jobs Construction
Since 2006, jobs decreased by 3,785 or 24%.
Average wages increased $7,045 or 25%. Finance & Insurance
20ECONOMIC RESILIENCE
According to the US Economic Development of funds for grants; terrorist attacks; and can prepare residents for the future
Administration (EDA), Economic Resilience is substantial fluctuations in supplies, as economy, but also quickly react to shocks
the ability to recover quickly from a shock, the examples. Each of these types of shocks and help to retrain residents for the new
ability to withstand a shock, and the ability to should be considered when the following normal.
avoid a shock altogether. In this section, we actions are considered and planned for. Develop a procurement strategy and
have prepared a framework for Economic team who are authorized to procure
Resilience that provides an approach for Strategies to Develop a More Resilient Economy goods and services from local providers in
becoming better prepared for future The following pre- and post-shock actions will the event of an emergency. There should
disasters, including economic, manmade and help to develop a more resilient economy: be a database of local suppliers and
natural, recovering from disasters, and then services. The procurement team should
transitioning back to steady state. The Prepare plans that allow the community to have a working knowledge and
framework is depicted in the following absorb, respond, adapt, and recover to understanding of FEMA procurement and
diagram, and each of the three phases are pre-shock conditions. reimbursement rules.
further described in the following narrative. Develop a long-term strategy to diversify Develop responsive initiatives that define
and expand the regional industrial base. key stakeholders, roles, responsibilities,
Develop personal relationships and and actions. In addition, establish a system
reliable communication avenues with top for regular communication, monitoring,
employers in the region (See Appendix A and updating of business community needs
for list of top 10 employers in each and issues.
County). Steady-state initiatives diversify the
Develop personal relationships and a economic base of the region, making the
communication strategy for small entire region more adaptable and better
businesses in the region. able to withstand or avoid a shock.
Focus efforts on strengthening existing
businesses, especially high-growth Recovery
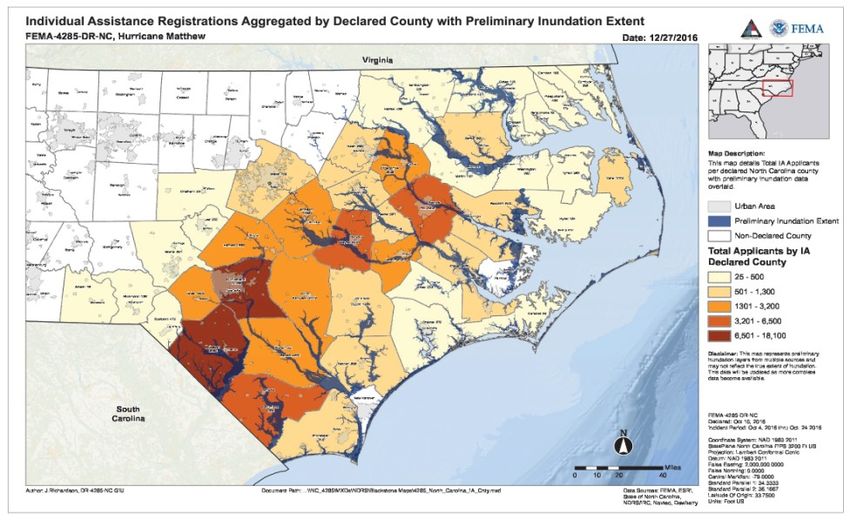
businesses. While the recovery plans will be uniquely
Pupose defined based on the type of shock that
The purpose of this section is to define Increase availability of “baseline”
business information. Develop inventory occurs, the information in this section centers
Economic Resilience and provide a guide to on the devastation that resulted from our most
increase economic resilience in the region. with contact information for businesses
within jurisdiction. recent shock, Hurricane Matthew. In the wake
Increase communications between local of Hurricane Matthew, the affected
Prepare communities, in collaboration with the NC
Various economic shock factors have varying government, emergency management,
utilities, and the business community. Department of Public Safety, have developed
levels of severity and devastation, including a resilient rebuilding plan tailored to each
natural disaster; major stock market Partner with community colleges and the
County. These plans go into detailed
fluctuations; economic downturns and university system to establish nimble
information for each County and delineate
recessions; government shutdowns; availability workforce development programs that
21ECONOMIC RESILIENCE
the major areas of impact and devastation and storm water planning and management/culvert upgrades,
that need to be addressed and specific infrastructure improvements. backup power, and critical response
projects that have been identified to address Housing—Adequate and affordable equipment
the impacted areas. For detailed information, housing Economic Development—
please visit the redevelopment plan website Economic Development—Overall Transportation improvements
infrastructure improvements to make Hoke County
below:
communities more desirable to current Economic Development—Increase eco
https://rebuild.nc.gov/HurricaneMatthew/ and future residents -tourism
Programs/RedevelopmentPlans Bladen County Economic Development—Agriculture
Economic Development—Revitalize alternative power supply
The following chart outlines the number of downtown Bladenboro Economic Development—Downtown
rebuilding projects identified in the four Infrastructure—Improve grid system Raeford revitalization
priority areas (Housing, Economic and backup power New Hanover County
Development, Infrastructure, and Environment) Environment—Stream restoration Infrastructure—New Hanover County
in each County: improvements logistics/emergency management
Bladen Brunswick Columbus Cumberland
Brunswick County center
Housing 2 Housing 1 Housing 2 Housing 3
Infrastructure—Various water, sewer, Environment—Expansion of
Econ. Dev. 4 Econ. Dev. 0 Econ. Dev. 3 Econ. Dev. 3 storm water, bridge and road recreation land/preservation of
Infrastructure 6 Infrastructure 19 Infrastructure 9 Infrastructure 8
Environment 3 Environment 2 Environment 3 Environment 4 improvements for communities in the floodplain
Harnett Hoke New Hanover Pender
County, i.e. water system and sewer Economic Development—Create
extension to industrial mega sites in resilient employment center
Housing 2 Housing 3 Housing1 Housing 6
Econ. Dev. 3 Econ. Dev. 4 Econ. Dev. 1 Econ. Dev. 3 partnership with Columbus County Pender County
Infrastructure 3
Environment 2
Infrastructure 4
Environment 5
Infrastructure 10
Environment 4
Infrastructure 5
Environment 3
Columbus County Housing—Increase available housing
Richmond Robeson Sampson Scotland Infrastructure—Back-up generators assistance and availability
Housing 3 Housing 7 Housing 5 Housing 3 for public facilities and various storm Infrastructure—Address flooding
Econ. Dev. 2 Econ. Dev. 4 Econ. Dev. 9 Econ. Dev. 4
Infrastructure 5 Infrastructure 30 Infrastructure 4 Infrastructure 4
water improvements and draining and flood warning
Environment 6 Environment 6 Environment 4 Environment 3 Housing—Provide affordable housing Richmond County
Economic Development—Downtown Infrastructure—Planning for power
Projects that were identified include both Rehabilitation/Revitalization Projects generation capabilities, resources,
short-term immediate needs, as well as long- for Fair Bluff, Whiteville and and identifying projects, as well as
term resiliency efforts that address the four Chadbourn existing building stock and jail
areas. Some examples of identified needs Cumberland County facility capacity.
include: Economic Development—Cumberland Environment—Expand community
Relatively All Counties County Qualified Local Contractor gardening to improve public health
Environment—Stream restoration Program for Reconstruction and quality of life as well as
Infrastructure—Stream gauges, early Infrastructure—Flood protection and providing fresh produce for
warning systems and communication backup power impoverished households
network for operators, backup power Harnett County Robeson County
generators for critical infrastructure, Infrastructure—Storm water Infrastructure—Improve water
22ECONOMIC RESILIENCE
supply assets including water treatment The actions contained within the industry leaders, county and local leaders, and
facility, system, and storage redevelopment plans for each county are state emergency management personnel
improvements, and water supply prioritized based on community input. Tactics participate in these table-top exercises to
planning; upgrade roads and bridges; will change with each shock, so there should be assess the strength and weaknesses of the
restore school facilities; and watershed in place a system for assessing and prioritizing resiliency plan. Following the exercise, officials
planning.
recovery efforts in order to ensure that the should correct the plan where possible and
Sampson County
Infrastructure—Relocate County
most pressing issues are addressed first. acknowledge any potential shortcomings.
Emergency Services office
Housing—Acquire land through public/ There should be a detailed procurement plan Assessments should occur during and after a
private partnership to create a land in place that sources local suppliers and shock. What parts of the plan were helpful for
bank for relocation and redevelopment providers in the immediate aftermath of a this shock? What parts of the plan were not
Economic Development—Establish Small shock, but especially a natural/manmade helpful? How can the plan be improved based
Farm Development Fund disaster. Supply routes, highways, and upon the region’s ability to withstand or avoid
Economic Development—Develop a airports could be shut down, so there should the shock? With a constructive critical analysis
local Small Business Grant/Revolving be local supplier identified prior to a disaster of lessons learned, the plan can be improved
Loan Program for low-income business occurring. In addition, procurement of goods after every table-top exercise and every shock.
owners and services should be conducted in
Scotland County accordance with standards that allow for New Normal
Economic Development—Identify FEMA reimbursement; therefore, the Following the immediate recovery period, the
leading causes and development of procurement team should have a working regional partners should return to steady-state
outreach campaign to address “brain
drain” in Scotland County
knowledge and understanding of FEMA initiatives in order to resume the long-term
Infrastructure—Fund an additional
procurement standards. There should also be efforts to diversify, strengthen, and develop a
power substation and study for the a list of resources prepared and made more adaptable economy. Efforts should be
implementation of a micro-grid generally available to the public that outlines prioritized based on the shock, but should
Infrastructure—Assess the County’s who to call for support during times of include local business outreach to update the
overall infrastructure disaster. local business inventory. More than 50% of
businesses do not reopen after a disaster.
Assess Regional, national and global economic shifts
A vital component to any action plan is to can have devastating effects on local
assess the effectiveness of a plan. Economic economies. The region’s ability to work toward
Resiliency is an ongoing effort. While shocks an agile steady-state will be measured by the
occur infrequently and are almost always economy and amount of businesses that survive
unexpected, there are ways to assess a shock, as well as the ability to adapt to the
resiliency plans in the absence of an actual new normal following a shock with a rebuilt
shock. One way to assess the plan absent an economy. The more effort put into the steady-
actual shock is to conduct table-top exercises. state, the more resilient the regional economy is
The goal would be to have business and likely to be.
23You can also read