Financial Performance - for the Quarter ended September 30, 2021 Jatin Dalal - Wipro
←
→
Page content transcription
If your browser does not render page correctly, please read the page content below

Financial Performance
         for the Quarter ended September 30,
         2021

                Jatin Dalal
                Chief Financial Officer
                Wipro Limited

Public
Revenue
         for the Quarter

                                                          $ Mn
         $ 2.58 Bn
         IT Services Revenue | USD
                                         IT services
                                     Growth on Constant
                                      Currency Basis:

         ₹ 196.7 Bn                   QoQ: 8.1%

                                                          INR Mn
                                      YoY: 28.8%
         Gross Revenue | INR

Public                                                             ©   confidential   2
Operating Margin
         for the Quarter
         IT Services Operating Margin
         refers to our segment results

         17.8 %
         IT Services Operating Margin    Operating Profit growth
                                              (Wipro Ltd.)

                                            QoQ: 0.6%

                                                                   INR Mn
         ₹34.9 Bn                           YoY: 24.1%
         Operating Profit (Wipro Ltd.)
         in INR

Public                                                                      ©   confidential   3
Net Income
         for the Quarter

                                                                            INR Mn
         Net income refers to the profit attributable
         to equity share holders of the company

         ₹ 29.3 Bn
         Net Income | INR                                    YoY growth

                                                        Net Income: 18.9%
         ₹ 5.36                                             EPS: 23.8%

                                                                            INR
         Earnings Per Share | INR

Public                                                                               ©   confidential   4
Other highlights
         1.    Broad based growth across all markets, sectors and global
               business lines

         2.    Growth well ahead of the top-end of our guidance range of 7%

         3.    Annual revenue run-rate surpassed $10 billion mark

         4.    Customer count in >$100 Mn account moved from 13 to 15,
               >$75 Mn moved from 27 to 28 and > $50Mn account moved
               from 42 to 44 in Q2’22

         5.    Onboarded ~8,150 freshers in Q2’22

         6.    Operating cash flow to Net income for Q2’22 was at 81.5%

         7.    Net Cash* as of Q2’22 was at $2.7 billion

Public   *Non-GAAP measures walk has been provided in the annexure            ©   confidential   5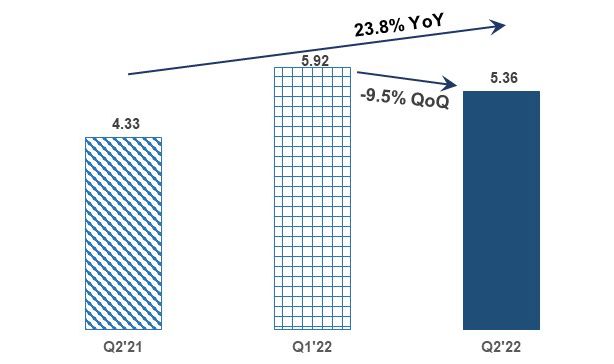
Outlook
           for quarter ending December 31, 2021

                             QoQ growth
                      2.0% to 4.0%
         We expect the revenue from our IT Services business to
           be in the range of $2,631 million to $2,683 million*

              •   Outlook is based on the following exchange rates: GBP/USD at 1.36, Euro/USD at 1.17, AUD/USD at 0.72, USD/INR at 74.13
                  and CAD/USD at 0.78
Public                                                                                                             ©         confidential   6
Thank You

Public
Reconciliation of selected GAAP measures to Non-GAAP measures (1/2)
    Reconciliation of Gross Cash and Net Cash as of September 30, 2021
                                                                Amount in INR Mn         Amount in $Mn1
    Computation of Gross Cash and Net Cash
    Cash & Cash Equivalents                                                 142,026                   1,915
    Investments - Current                                                   175,223                   2,363
                                                   Gross Cash               317,249                   4,278
    Less: Long term and short term borrowings                               114,229                   1,540
                                                     Net Cash               203,020                   2,738

    Reconciliation of Free Cash Flow for three months and six months ended September 30, 2021
                                                                            Amount in INR Mn
                                                                Three months ended       Six months ended
                                                                 September 30, 2021     September 30, 2021
                             Net Income for the period [A]                    29,307                 61,628
    Computation of Free Cash Flow
    Net cash generated from operating activities                              23,886                 57,416
    Add/ (deduct) cash inflow/ (outflow)on:
    Purchase of property, plant and equipment                                 (5,709)               (10,339)   Notes:
    Proceeds from sale of property, plant and equipment                         615                     667    1. For the convenience of the readers, the
                                                                                                                   amounts in Indian Rupees in this release have
                                   Free Cash Flow [B]                         18,792                 47,744        been translated into United States Dollars at
                                                                                                                   the certified foreign exchange rate of US$1 =
    Free Cash Flow as percentage of Net Income [B/A]                           64.1%                  77.5%
                                                                                                                   ₹74.16, as published by the Federal Reserve
                                                                                                                   Board of Governors on September 30, 2021.

Public                                                                                                                                    ©         confidential   8
Reconciliation of selected GAAP measures to Non-GAAP measures (2/2) Reconciliation of Non-GAAP Constant Currency IT Services Revenue to IT Services Revenue as per IFRS ($Mn): Three Months ended September 30, 2021 IT Services Revenue as per IFRS $ 2,580.0 Effect of Foreign currency exchange movement $ 31.0 Non-GAAP Constant Currency IT Services Revenue based on $ 2,611.0 previous quarter exchange rates Three Months ended September 30, 2021 IT Services Revenue as per IFRS $ 2,580.0 Effect of Foreign currency exchange movement $ (13.6) Non-GAAP Constant Currency IT Services Revenue based on $ 2,566.4 exchange rates of comparable period in previous year Public © confidential 9
Segment Information
As announced on November 12, 2020, in order to broad base our growth, effective January 1, 2021, the Company re-organized IT
Services segment to four Strategic Market Units (“SMUs”) - Americas 1, Americas 2, Europe and Asia Pacific Middle East Africa
(“APMEA”).

Americas 1 and Americas 2 are primarily organized by industry sector, while Europe and APMEA are organized by countries.

1. Americas 1 includes Healthcare and Medical Devices, Consumer Goods and Lifesciences, Retail, Transportation and Services,
   Communications, Media and Information services, Technology Products and Platforms, in the United States of America and
   entire business of Latin America (“LATAM")
2. Americas 2 includes Banking, Financial Services and Insurance, Manufacturing, Hi-tech, Energy and Utilities industry sectors in
   the United States of America and entire business of Canada
3. Europe consists of United Kingdom and Ireland, Switzerland, Germany, Benelux, Nordics and Southern Europe
4. APMEA consists of Australia and New Zealand, India, Middle East, South East Asia, Japan and Africa

The two Global Business Lines:

1. iDEAS (Integrated Digital, Engineering & Application Services) will include the following Service Lines - Domain and
   Consulting, Applications & Data, Engineering and R&D and Wipro Digital
2. iCORE (Cloud Infrastructure, Digital Operations, Risk & Enterprise Cyber Security Services) will include Integrated Cloud
   Infrastructure (CIS),Digital Operations (DOP) and Risk and Enterprise Cybersecurity Services (CRS)

Public                                                                                                            ©      confidential   10
You can also read