FISCAL NOTES Texas' International Trade By David Green and Shannon Halbrook - Texas Comptroller
←
→
Page content transcription
If your browser does not render page correctly, please read the page content below
A REVIEW OF THE TEX AS ECONOMY FROM THE OFFICE OF GLENN HEGAR, TEX AS COMPTROLLER OF PUBLIC ACCOUNTS
FISCAL NOTES
J U N E /J U LY 2 0 2 0
THE ECONOMIC IMPACT OF
TEXAS COMMUNITY COLLEGES 7
STATE REVENUE WATCH 11
Texas’ International Trade By David Green and Shannon Halbrook
VITAL COMMERCE IN UNCERTAIN TIMES
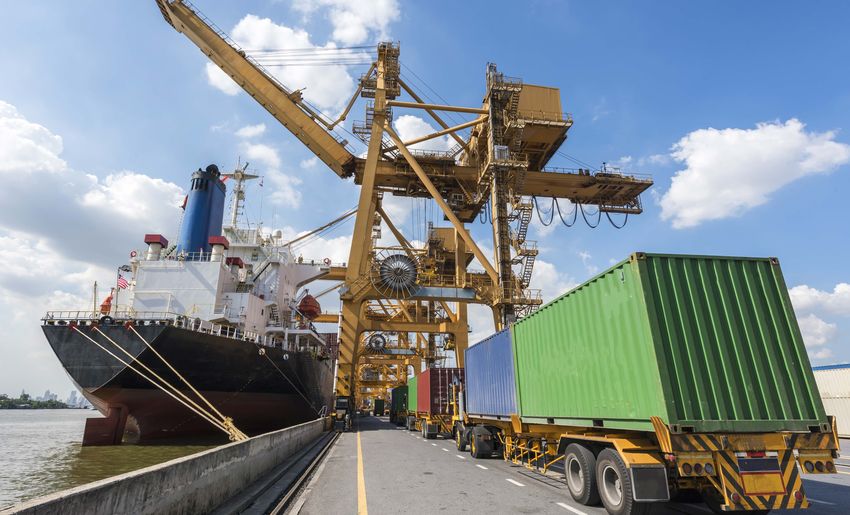
With the nation’s longest stretch of international border All this trade is facilitated by a complex web of
and some of its busiest ports, Texas benefits enormously supply chains. According to the Peterson Institute for
from global trade. International Economics, the economic contribution
Our state has led the nation in exports for of the world’s trade in intermediate parts — the
17 consecutive years. In 2019, Texas exported products components needed to produce finished goods —
worth $328.9 billion, according to the International is nearly twice that of trade in finished products. It’s
Trade Administration (ITA). Exports represent about particularly important to the auto industry. Trade in
17.4 percent of Texas’ gross state product (GSP) — the intermediate parts is a key feature of Texas’ relationship
second-highest share of any state and more than double with Mexico, its largest trading partner.
the U.S. average. International trade expands markets for businesses
Texas also is a major importing state, relying on and promotes competition, higher productivity and
foreign makers for products, parts and commodities to innovation while reducing consumer costs. But it’s
feed its manufacturing and trade sectors. In calendar often blamed for stagnant wages, rising inequality and
2019, Texas was the nation’s second-largest importing job losses, particularly in manufacturing.
state behind California, bringing in nearly $294.9 billion To protect domestic industries, the federal
in goods. government can impose trade tariffs — essentially
taxes on imports. The current administration has used
CO NTI N U E D O N PAG E 3
GLENN HEGAR, TEX AS COMPTROLLER OF PUBLIC ACCOUNTS F I S C A L N O T E S J U N E / J U LY 2 0 2 0 | 1
A Message from the Comptroller
Texas is reopening — slowly and
carefully, with some retreats, after
TEXAS MILITARY SNAPSHOT
Texas military installations play a vital role in our
strategic national defense and provide significant
months of unprecedented benefits to the entire state economy. In many cases,
disruption and heartbreak for these bases are the lifeblood of their communities,
thousands of Texas families. Our supporting local businesses and spurring home sales.
economy and our lives are vastly But their economic impact reaches throughout the
different than they were just a few state, creating jobs in a wide variety of industries.
months ago.
As always, we’re following
events closely. We’re preparing
for our July update to the Certification Revenue Estimate, 2019 ESTIMATED CONTRIBUTIONS TO THE TEXAS ECONOMY
$123.7
our formal assessment of where we see state revenues DIRECT EMPLOYMENT
headed in this truly unexpected recession. It will help set the
226,555
OUTPUT
stage for what’s likely to be one of the most important and
difficult sessions the Texas Legislature has ever seen.
In this issue of Fiscal Notes, we examine a crucial facet
of the Texas economy, our trade with other nations. Texas is
DIRECT AND INDIRECT EMPLOYMENT Billion
the nation’s largest exporter and second-largest importer,
and nearly every person in our state benefits directly or
indirectly from foreign trade, particularly that with our
largest trading partners, Mexico and Canada. This trade
is vital but can be volatile. In the last few years, we’ve
633,892 GROSS DOMESTIC PRODUCT
$75.3
experienced a trade war with China and a revision to the
North American Free Trade Agreement, which is hugely
important to Texas businesses.
And then came COVID-19. Texas imports and exports
DISPOSABLE
PERSONAL INCOME
$39.2
Billion
Billion
plunged and may not recover this year. But the long-term DIRECT TOTAL OUTPUT
outlook remains positive and the realignment of supply EMPLOYMENT EMPLOYMENT (IN BILLIONS)
Army Futures Command 586 2,342 $0.36
chains and business relationships caused by the pandemic
Corpus Christi Army Depot 3,658 10,887 $1.78
ultimately may benefit our state.
Dyess AFB 6,005 19,200 $3.84
In this issue, we also look at the economic contributions
Ellington Field JRB 753 2,323 $0.47
of Texas’ 50 public community college districts. These
Fort Bliss 47,045 130,943 $25.67
institutions play an important dual role in our state; they
Fort Hood 56,023 152,701 $29.86
provide thousands of Texans with a low-cost way to begin
Goodfellow AFB 8,309 21,410 $4.54
their academic careers while giving others the professional
Joint Base San Antonio 73,707 210,998 $41.33
training and credentials needed for a wide variety of high-
Laughlin AFB 3,961 10,201 $2.03
demand jobs. Many community colleges work closely with
NAS Corpus Christi 4,782 15,261 $2.80
employers in their areas to fill high-demand, well-paid
NAS Fort Worth JRB 6,616 20,042 $3.79
positions.
NAS Kingsville 1,647 4,695 $0.85
A recent study by our office put their economic
Red River Army Depot 3,887 10,566 $1.72
impact at nearly $10 billion annually, with support for
Sheppard AFB 9,576 22,323 $4.63
almost 78,000 Texas jobs. We also estimated that the
wage increase enjoyed by community college graduates
CONCLUSION
Sources: Texas Comptroller
puts an additional $27.2 billion a year in the state of Public Accounts, Texas
economy. While these estimates preceded the pandemic, Military bases make significant
Military Preparedness
Commission and Regional
community colleges continue to offer major benefits and contributions to our state. They Economic Models, Inc.
will contribute to the recovery when it comes. generate at least $123.7 BILLION
As always, I hope you enjoy this issue! in economic activity each year
and support and strengthen
communities throughout Texas.
To see more detailed information on each of these installations, visit:
COMPTROLLER.TEXAS.GOV/ECONOMY/ECONOMIC-DATA/MILITARY/
GLENN HEGAR If you would like to receive paper copies of Fiscal Notes, contact us at
Texas Comptroller of Public Accounts fiscal.notes@cpa.texas.gov
2 | GLENN HEGAR, TEX AS COMPTROLLER OF PUBLIC ACCOUNTS
Texas’ International Trade                         CO NTI N U E D F R O M PAG E 1

                    tariffs and renegotiated long-term trade deals inEXPORTS
                                                                       its      AS A SHARE  OF GSP
                                                                                       removal    of a 1975 ban on most oil and gas exports. In
                    effort to protect domestic industries, but protectionist           2016, oil and gas represented just 6 percent of Texas’
                    moves often invite retaliatory responses that ultimately           total exports; by 2019 its share had risen to nearly
                    can increase costs for consumers. Today, U.S. tariff rates         23 percent (Exhibit 2), displacing computers and
                    are at their highest levels since 1993.
                         These rising trade tensions already presented                                            EXHIBIT 2
                    Texas with potential economic challenges,
                    but their effects on global commerce will pale                           TEXAS EXPORTS BY INDUSTRY AND SHARE OF
                    in comparison to those caused by COVID-19.                                           TOTAL STATE EXPORTS, 2019
                    Lockdowns across the globe significantly
                    disrupted supply chains and exposed their                                                       SHARE OF TOTAL EXPORTS 2016
                                                                                                                                            2019
                    vulnerability. Multinational companies and
                    governments are reassessing their supply                                Oil and Gas
                    chains to mitigate risks. And global trade —
                                                                           Petroleum and Coal Products
                    often viewed as a pillar of global cooperation
                    and economic growth — is increasingly a                              Computer and
                                                                                    Electronic Products
                    source of mistrust and hostility.
                                                                                             Chemicals
                    TEX AS TRENDS:
                    THE ROLE OF ENERGY                                                   Transportation Equipment

                    Texas exports tend to rise and fall in response                                       Machinery
                    to general economic conditions and volatility
                    in energy prices. As Exhibit 1 illustrates,                                Electrical Equipment
                    recent dips in the value of Texas exports                            Fabricated Metal Products
                    coincided with the Great Recession of 2007-09
                    and the 2015-16 downturn in energy prices. A                      Miscellaneous Manufactured
                                                                                                     Commodities
                    recovery in oil prices helped boost the value of
                    Texas exports by 42 percent between 2016 and                               Agricultural Products
                    2019; in this period, Texas’ share of total U.S.                                            Other
                    exports rose from 16 percent to 20 percent.
                        Another factor, spurred by greatly                                                              0% 2% 4% 6% 8% 10% 12% 14% 16% 18% 20% 22%
                    increased production from shale formations,                       Figures reflect rounding.
                    was the federal government’s December 2015                        Source: U.S. International Trade Administration

                                                                                         EXHIBIT 1

                            TEXAS EXPORT VALUES AND EXPORTS AS A SHARE OF TEXAS GROSS STATE PRODUCT, 1999-2019

                                                                                 (AMOUNTS IN MILLIONS)
       $2,000
       $1,800               TEXAS GSP TEXAS EXPORTS
       $1,600
       $1,400
       $1,200
       $1,000
         $800
         $600                                                                                                 EXPORTS AS A SHARE OF GSP
         $400 12.2% 14.1% 12.3% 12.1% 11.9% 13.0% 13.1% 13.9% 14.3% 15.5% 14.0% 16.7% 18.9% 18.8% 18.5% 18.2% 15.9% 14.8% 15.9% 17.5% 17.4%
         $200
            $0
                 1999 2000 2001 2002 2003 2004 2005 2006 2007 2008 2009 2010 2011 2012 2013 2014 2015 2016 2017 2018 2019
Note: Export values in nominal dollars (not adjusted for inflation).
Source: U.S. International Trade Administration

                                                                                                                                        F I S C A L N O T E S J U N E / J U LY 2 0 2 0   | 3
Texas’ International Trade
                                                                                                (Exhibit 4). Destinations outside North
                                                                                                America have led Texas export growth in
                                                                                                recent years, however — most notably South
                                                                                                Korea, the United Kingdom and India.

                                                                                                TARIFFS AND TRADE DEALS
                                                                                                 According to the ITA, Texas’ exports to China
                                                                                                 fell by 34 percent between 2018 and 2019,
                                                                                                 while total U.S. exports to China fell by nearly
                                                                                                 12 percent, reflecting an ongoing trade war.
                                                                                                 At the trade war’s peak in mid-2019, the
                                                                                                 federal government was enforcing 25 percent
                                                                                                 tariffs on about $200 billion worth of Chinese
                                                                                                 products. China responded with tariffs on
                                                                                                 about $75 billion worth of American goods.
                                                                                                 The average U.S. tariff on Chinese goods rose
                       electronic products as the state’s top export product.        from 3 percent in January 2018 to more than 20 percent
                             Exhibit 3 further demonstrates the recent               by April 2020.
                       importance of Texas oil and gas exports. The state’s               The current administration also has been critical
                       exports of oil and gas rose by 439 percent between 2016       of the  North American Free Trade Agreement (NAFTA).
                       and 2019, from $13.9 billion to $74.9 billion.                Reforms   to the agreement came in the form of the
                                                                                     United States-Mexico-Canada Agreement (USMCA),
                       TOP TRADE PARTNERS                                            signed into law on Jan. 29, 2020, and effective on
EXPORTS AS A SHAREMexicoOF GSP is Texas’ largest export destination by far,          July 1, 2020.
                       followed by Canada; together, these nations accounted              “The USMCA is not fundamentally different from
                       for nearly 42 percent of Texas exports in 2019                NAFTA,” says Karl Kuykendall, an associate director with
                                                                                                  information services company IHS Markit.
                                                    EXHIBIT 3                                     “It does more to solidify the North American
                                                                                                  trading relationship than to change existing
           VALUE OF TEXAS EXPORTS BY INDUSTRY SECTOR, 2016 VS. 2019                               trade flows.”
                                            (AMOUNTS IN BILLIONS)                                      The USMCA incentivizes more
                                                                                                  automotive production in North America,
                                          PERCENT CHANGE
                                               IN VALUE,                                          requiring that at least 75 percent of the
                                                                        2016
                                              2016-2019                 2019                      components of any vehicle assembled in
                                             439.4%                                               the partner nations must be sourced from
                        Oil and Gas                                                               them — up from NAFTA’s 62.5 percent
    Petroleum and Coal Products
                                                38.5%                                             requirement. It also adds a new requirement
                                                                                                  that 30 percent of auto content produced
                    Computer and                 4.7%                                             in the partner nations must be made by
               Electronic Products
                                                22.0%                                             workers earning at least $16 per hour,
                         Chemicals                                                                increasing to 40 percent of content in
      Transportation Equipment
                                                20.8%                                             three years. This provision puts pressure
                                                                                                  on Mexican factories, where average
                         Machinery
                                                16.7%                                             wages are about a third of the $16 per hour
                                                 2.0%                                             requirement.
             Electrical Equipment                                                                      USMCA also modernizes the trade pact
      Fabricated Metal Products
                                                 8.1%                                             by  adding  provisions on e-commerce and
                                                                                                  digital trade, industries that didn’t exist
   Miscellaneous Manufactured                   15.6%
                      Commodities                                                                 when NAFTA was implemented in 1994.
                                                18.4%                                             It also expands labor and environmental
            Agricultural Products
                                                                                                  protections and increases protections for
                              Other
                                                 7.8%                                             intellectual property rights. Finally, the
                                                                                                  USMCA increases U.S. access to the Canadian
                                     $0      $10      $20 $30  $40    $50    $60 $70     $80      dairy market, a key priority of the federal
   Source: U.S. International Trade Administration                                                administration.

   4 |   GLENN HEGAR, TEX AS COMPTROLLER OF PUBLIC ACCOUNTS
STEEL AND ALUMINUM                                                          increased metal prices for buyer industries.
                   Steel and aluminum are vital inputs for a wide variety                           Texas imports more steel and aluminum than any
                   of manufactured products, from autos to modern office                       other state, largely to make pipelines and drilling
                   buildings. In 2019 alone, the U.S. imported about                           equipment for the energy industry. A 2017 study
                   25.3 million metric tons of steel, nearly half of it from                   commissioned by the American Petroleum Institute
                   Canada, Mexico and Brazil, as well as about 3.7 million                     estimated that about 77 percent of the steel used in
                   metric tons of aluminum.                                                    new pipelines is imported. The 2018 tariffs took effect
                        In 2018, the federal government imposed 25 percent                     at a time when Texas energy producers were dealing
                   tariffs on imported steel and 10 percent on imported                        with a glut of oil and gas and were desperate to build
                   aluminum. The goal was to reduce reliance on                                more pipelines and storage facilities. According to one
                   imported metals while revitalizing activity at shuttered                    study, Texas’ imports of steel and aluminum rose by
                   metalworks plants across the U.S. The tariffs, however,                     22 percent from 2017 to 2019.

                                                                                       EXHIBIT 4

                                   TOP EXPORTING DESTINATIONS, TEXAS AND U.S., 2019; PERCENT CHANGE, 2016-2019

        TEXAS EXPORT
        DESTINATIONS            2019 EXPORT VALUE (IN BILLIONS)                           2019 SHARE                       PERCENT CHANGE, 2016-2019
                                                                                           OF TOTAL
                           $0        $20           $40     $60         $80      $100                       0%      50%        100%      150%         200%         250%         300%
               Mexico                                                                       32.9%
               Canada                                                                        8.6%
          South Korea                                                                        5.1%
                 Brazil                                                                      4.1%
          Netherlands                                                                        3.5%
                Japan                                                                        3.4%
                 China                                                                       3.3%
      United Kingdom                                                                         2.9%
                 India                                                                       2.6%
               Taiwan                                                                        2.6%
            All others                                                                      30.9%
            THE WORLD      $328.9 BILLION                                                                    42.0%

        U.S. EXPORT
        DESTINATIONS             2019 EXPORT VALUES (IN BILLIONS)                         2019 SHARE                 PERCENT CHANGE, 2016-2019
                                                                                            OF TOTAL
                           $0      $100           $200   $300       $400     $500      $600                 0%       50%       100%     150%         200%         250%         300%
                Canada                                                                       17.8%
                Mexico                                                                       15.6%
                  China                                                                       6.5%
                  Japan                                                                       4.5%
       United Kingdom                                                                         4.2%
              Germany                                                                         3.7%
           South Korea                                                                        3.4%
           Netherlands                                                                        3.1%
                  Brazil                                                                      2.6%
                 France                                                                       2.3%
             All others                                                                      36.3%
            THE WORLD      $1.6 TRILLION                                                                     12.9%

Figures reflect rounding.
Source: U.S. International Trade Administration

                                                                                                                                      F I S C A L N O T E S J U N E / J U LY 2 0 2 0   | 5
Texas’ International Trade
                                                                               To further bolster those industries, the
                                                                          U.S. introduced additional tariffs in January
                                                                          2020 on imports of steel and aluminum
                                                                          articles such as nails, auto bumpers and
                                                                          wires. Those tariffs are levied at the same
                                                                          rate as the 2018 tariffs on imported metals:
                                                                          25 percent on steel products and 10 percent
                                                                          on aluminum products. The USMCA,
                                                                          however, exempts imports of these metals
                                                                          and products from Mexico and Canada from
                                                                          all tariffs.                                       KARL KUYKENDALL
                                                                          TRADE IN UNCERTAIN TIMES                            ASSOCIATE DIRECTOR
                                                                                                                                  IHS MARKIT
                                                                          Trade tensions showed signs of cooling in
                                                                          early 2020. The USMCA agreement restored
                            NAFTA AND TEXAS                               business and investment certainty in North America,
                                                                          and in late 2019 the U.S. and China signed an agreement
 NAFTA, established in January 1994, was a groundbreaking trade           that would cut tariffs and increase trade between the
 deal between the U.S., Mexico and Canada that largely eliminated         world’s largest economies, a positive development after
 tariffs on goods traded among the three nations. It included labor,      years of trade war escalation.
                                                                               But then came the pandemic. COVID-19 is upending
 environmental and intellectual property provisions that would
                                                                          trade flows around the world and causing an abrupt
 influence successive trade deals across the globe. NAFTA quickly
                                                                          global recession expected to be worse than the Great
 became embedded in the fabric of the Texas economy:                      Recession of 2008-09.
                                                                               The Census Bureau reports that, between March
      •   Mexico and Canada are responsible for 40 percent of Texas’
                                                                          and April 2020, U.S. exports and imports of goods fell
          imports of intermediate goods used in manufacturing.
                                                                          by 29 percent and 15 percent, respectively. In Texas,
      •   Much of the Permian Basin’s oil and gas is exported for use     exports fell by 30 percent and imports dropped by
                                                                          23 percent. Yet while it appears trade will continue to
          in Mexican oil refineries and gas-fired power plants. Texas
                                                                          suffer this year, an IHS Markit analysis suggests the
          natural gas produces about a quarter of Mexico’s electricity.
                                                                          long-term outlook for the Texas export industry
      •   U.S. natural gas exports to Mexico have nearly doubled since    remains positive.
                                                                               “COVID-19 will undoubtedly encourage companies
          2015 and are approaching 2 trillion cubic feet per year.
                                                                          to relook at where and how they source their inputs,”
      •   NAFTA partners also supply big markets for Texas agriculture;   says Kuykendall. “There’s a greater incentive now to
          more than 80 percent of Texas’ dairy and poultry exports go     simplify supply chains and mitigate risk related to future
                                                                          pandemics, trade tensions, natural disasters and other
          to Mexico.
                                                                          major events.”
 The U.S. Chamber of Commerce estimates that NAFTA-related trade               The pandemic could spur companies to source
 supports about 387,000 Texas jobs.                                       products closer to home, including in Mexico or
                                                                          low-cost U.S. states. “If reshoring occurred in Mexico,
                                                                          Texas has those business relationships already and the
                    Some Texas leaders, including Gov. Greg Abbott,       transportation infrastructure to move those goods
                have suggested that tariffs and protections for           across the U.S.,” says Kuykendall. “Texas benefits directly
                metalworks plants could harm important industries,        or indirectly from reshoring initiatives aimed for North
                noting that Texas’ oil and gas sector employs more        America, especially in the southern U.S. and Mexico.
                people than the entire nation’s steel and aluminum        Reshoring initiatives will be more long term. Companies
                makers.                                                   will want to see how this plays out before they make
                                                                          major investment decisions.” FN

6 |   GLENN HEGAR, TEX AS COMPTROLLER OF PUBLIC ACCOUNTS
The Economic Impact of Texas Community Colleges
By Patrick Graves, Jessica Donald, Shannon Halbrook and Spencer Grubbs

RECE NT COMPTROLLE R STUDY OUTLINE S BE NE FITS

Public community colleges play an important dual role                             STUDY FINDINGS
in the Texas economy by preparing students for further                            In early 2020, the Comptroller’s office requested financial
academic study and providing valuable workforce                                   data from Texas’ 50 community college districts to
training. These two-year schools have become the first                            determine their statewide and regional economic
educational option not just for technical and vocational                          impact. The analyses predated the COVID-19 crisis and
career-seekers but for many students pursuing                                     its adverse economic effects. Under normal economic
baccalaureate degrees.                                                            conditions, however, every dollar spent by community
     A recent study conducted by the Comptroller’s                                colleges produces an additional 86 cents’ worth of
office highlights the economic contributions of Texas’                            economic activity. Every dollar community colleges
community colleges. In fiscal 2018, community colleges                            spend on compensation produces an additional 38 cents
reported revenues totaling more than $5.3 billion,                                in total income to the state economy (Exhibit 1).
generating an additional $4.5 billion in economic                                      The economic contribution of community
activity by businesses and households, for a total                                colleges has been noted nationally as well. In a 2014
impact of more than $9.8 billion annually. This spending                          study performed in collaboration with the American
supports almost 78,000 Texas jobs.                                                Association of Community Colleges, the economic
     It’s an impact that will take on added significance as                       modeling firm Emsi estimated that two-year institutions
the state copes with the unprecedented disruptions of                             of higher education (IHEs) added $809 billion to the
the coronavirus pandemic.                                                         U.S. economy in 2012, primarily due to the economic

                                                                       EXHIBIT 1

                         ESTIMATED ECONOMIC IMPACT OF TEXAS’ COMMUNITY COLLEGES, 2019
                                                                                            EFFECTS

 ECONOMIC INDICATOR                           DIRECT                 INDIRECT                 INDUCED              TOTAL EFFECT             MULTIPLIER
 EMPLOYMENT                                       57,437                    7,355                  12,946                   77,738               1.35
 OUTPUT                                    $5.3 BILLION            $2.0 BILLION            $2.6 BILLION             $9.8 BILLION                 1.86

 COMPENSATION                              $3.4 BILLION           $491 MILLION            $796 MILLION              $4.7 BILLION                 1.38

Note: Output refers to the intermediate and final economic values of goods and services. Induced effects are the jobs, sales/output and compensation created
when new employees spend their wages at local business establishments. Multipliers indicate additional economic activity generated by one dollar of spending.

Sources: JobsEQ, Texas Higher Education Coordinating Board and Texas Comptroller survey of Texas community colleges

                                                                                                                                 F I S C A L N O T E S J U N E / J U LY 2 0 2 0   | 7
The Economic Impact of Texas Community Colleges
contributions of former students. It’s an amount higher education, usually in a setting close to home.
equivalent to about 5.4 percent of the nation’s gross That’s a winning combination.”
domestic product. Consequently, community colleges attract more
The Emsi study also found that U.S. community students than any other type of IHE in Texas. According
college students could expect to earn an additional to the Texas Association of Community Colleges (TACC),
$4.80 for every dollar spent on tuition during their in fall 2017 community colleges accounted for 46
work lives. The company estimated a public benefit of percent of the state’s higher education enrollment. In
$6.80 for every taxpayer dollar invested in community fall 2019, 748,399 students were taking courses at the
colleges. Emsi also put the present value of the added state’s public community college campuses.
income generated by community college graduates at
more than $1.1 trillion. ACCESS TO HIGHER ED
Texas currently ranks 36th in the nation in educational
GOOD RETURNS attainment, with slightly less than 39 percent of the
A community college education delivers good returns adult population holding an associate degree or higher.
on students’ commitments of time and tuition. In In 2018, just 43.5 percent of 25- to 34-year-old Texans
2019, Texas workers with associate degrees or some held a degree or certificate. Raising that share to at least
college credit and stable jobs (those employed by 60 percent by 2030 is among four goals set by the Texas
the same firm throughout a calendar quarter) earned Higher Education Coordinating Board (THECB) to ensure
an average $8,393 more annually than high school the state remains competitive in the global marketplace.
graduates. For those 3.2 million workers, the wage Community colleges will play a vital role in meeting
increase alone means an additional $27.2 billion a year this goal.
in direct compensation circulating in the state economy Originally called junior colleges, two-year IHEs were
– more than five times the total spending of the state’s created to expand access to higher education. TACC
community colleges (Exhibit 2).
EXHIBIT 2
This wage boost is notable
given the modest two-year time TEXAS EARNINGS BY EDUCATIONAL ATTAINMENT, 2019
commitment typically required for
an associate degree, as well as its NUMBER OF WORKERS (IN MILLIONS) AVERAGE ANNUAL EARNINGS
relatively low cost. In-state annual 0.0 0.5 1.0 1.5 2.0 2.5 3.0 3.5 $0 $50,000 $100,000
tuition and fees at Texas community
colleges averaged $2,209 in 2017-18, LESS THAN HIGH SCHOOL
fourth lowest among states (behind
HIGH SCHOOL OR
California, New Mexico and Arizona) EQUIVALENT, NO COLLEGE
and roughly two-thirds the national
average of $3,243, according to ASSOCIATE DEGREE
OR SOME COLLEGE
the National Center for Education
BACHELOR’S OR
Statistics. ADVANCED DEGREE
“Community colleges are a great
EDUCATIONAL ATTAINMENT
value, any way you look at it,” says UNAVAILABLE
Texas Comptroller Glenn Hegar, who
began his own higher education at a TOTAL 12,076,174 $58,787
TOTAL AVERAGE ANNUAL EARNINGS
community college. “They’re a low-
cost way for students to experience Sources: U.S. Census Bureau and JobsEQ
8 | GLENN HEGAR, TEX AS COMPTROLLER OF PUBLIC ACCOUNTS
NUMBER OF WORKERS (IN MILLIONS) AVERAGE ANNUAreports that more than half of all Texas undergraduates associate degrees that can lead directly to employment
attend community college at some point, and that 34 in high-demand fields ranging from welding to health
percent of four-year college students graduating in 2017 care. They often collaborate with regional employers
had transferred at least 30 of their credit hours from a to identify market trends and fill specific niches in their
community college. communities’ workforces.
In the 2017-18 school year,
liberal arts and sciences, general EXHIBIT 3
studies and humanities degrees and
COMMUNITY COLLEGE CERTIFICATES AND
certificates made up nearly 40 percent
DEGREES AWARDED BY TYPE, 2017-18 ACADEMIC YEAR
of all credentials awarded by Texas
community colleges (Exhibit 3).
LIBERAL ARTS AND SCIENCES,
In recognition of the growing GENERAL STUDIES AND HUMANITIES
importance of two-year IHEs, the Texas
Legislature has allowed some to offer HEALTH PROFESSIONS AND
RELATED CLINICAL SCIENCES
certain bachelor’s degrees and has
increased grants and other types of BUSINESS, MANAGEMENT, MARKETING
student financial aid for their students. AND RELATED SUPPORT SERVICES
PERSONAL AND CULINARY SERVICES
WORKFORCE NEEDS
A 2012 study by the international MECHANIC AND REPAIR
Organisation of Economic Co-operation TECHNOLOGIES/TECHNICIANS
and Development, noted in THECB’s 0 10,000 20,000 30,000 40,000 50,000
strategic plan for 2015 through 2030, Source: JobsEQ
identified Texas as one of several
states with significant worker skills EXHIBIT 4
deficits that hampered companies’
LARGEST DEGREE AND CERTIFICATE SHORTAGES IN TEXAS
ability to fill jobs. These shortages
BY INDUSTRY, 2017-18 ACADEMIC YEAR
have persisted in certain fields
and industries. During the 2017-18 LESS THAN TWO YEARS OF TRAINING ASSOCIATE DEGREES BACHELOR’S DEGREES
academic year, the number of degrees
and certificates awarded by Texas IHEs
EDUCATION
fell well short of market demand. The
health professions, for example, had BUSINESS, MANAGEMENT, MARKETING
nearly 20,000 fewer Texas workers AND RELATED SUPPORT SERVICES
with two-year degrees and certificates
HEALTH PROFESSIONS AND
than needed (Exhibit 4). RELATED CLINICAL SCIENCES
Community colleges help close
these gaps by responding to changes CONSTRUCTION TRADES
in the economy and job markets.
They focus on job training and the COMPUTER AND INFORMATION SCIENCES
AND SUPPORT SERVICES
employment needs of businesses in
their areas, awarding certificates and 0 20,000 40,000 60,000 80,000
Sources: JobsEQ
F I S C A L N O T E S J U N E / J U LY 2 0 2 0 | 9The Economic Impact of Texas Community Colleges
And these trained workers tend to stay in the area, COMMUNITY COLLEGES
increasing the local benefits. A 2018 Emsi study found IN THE RECESSION
that, on average, community college graduates stay In response to the current recession, the Texas
within 300 miles of their colleges and 61 percent live Workforce Commission (TWC) has created a $10 million
within 50 miles. program within its Skills Development Fund to train
displaced workers and new and existing employees of
DUAL CREDIT
businesses affected by COVID-19 through community
Dual credit courses, by which high school students earn colleges and workforce development boards. As of
credit toward both graduation and college degrees, are mid-June 2020, TWC had approved $6.7 million in grant
a common feature at Texas community colleges. Dual funding to 39 applicants, 31 of them public community
credit enrollment rose by 34 percent from fall 2008 to and technical colleges. More than 4,500 trainees are
fall 2018; dual credit courses comprised almost a fourth anticipated for industries ranging from health care to
of all two-year IHE enrollment in fall 2018, according to hospitality and in fields as diverse as cybersecurity and
THECB. phlebotomy. Training through the program began on
COLLEGE READINESS June 1.
TACC officials expect dual credit enrollment
Community colleges often help students become
increases to continue this fall. Dual credit courses often
prepared for college-level work. According to a July
are offered free or at a discount, but college officials say
2019 THECB report, nearly 58 percent of students
revenue declines and higher delivery costs could hinder
entering public community and technical colleges
their availability.
are underprepared for freshman-level coursework,
TACC anticipates further community college
compared to 16 percent of those entering public
enrollment increases, either this fall — depending on
universities. Rather than enrolling them in non-credit
the level of concern over COVID-19 — or next year. Either
developmental education courses that often prove
way, community colleges are well positioned to support
counterproductive, THECB is promoting a two-pronged
those seeking to upskill or reskill as Texas restarts its
approach: support and intervention courses coupled
economy. FN
with for-credit courses in the same subject matter.
Since 2017, most Texas IHEs have implemented this For more information on the economic impact of the
“co-requisite remediation” for at least 25 percent of their state’s community colleges, view our report at comptroller.
developmental education students. THECB has awarded texas.gov/economy/economic-data/colleges.
$2.74 million to 18 community colleges and universities The COVID-19 pandemic is having a profound impact
to support the development and implementation of on Texas community colleges. Learn how these institutions
co-requisite models. Officials say student outcomes are responding to the crisis in our exclusive Q&A with
are improving and should continue to do so with full Deputy Higher Education Commissioner Ray Martinez III at
implementation. FiscalNotes.org.
10 | GLENN HEGAR, TEX AS COMPTROLLER OF PUBLIC ACCOUNTSState Revenue Watch
NET STATE REVENUE — All Funds Excluding Trust
(AMOUNTS IN THOUSANDS)
This table presents data on net Monthly and Year-to-Date Collections: Percent Change From Previous Year
state revenue collections by
YEAR TO DATE:
source. It includes most recent YEAR TO DATE: CHANGE FROM
monthly collections, year-to-date Tax Collections by Major Tax JUNE 2020 TOTAL PREVIOUS YEAR
(YTD) totals for the current fiscal SALES TAX $2,674,137 $28,295,466 0.42%
year and a comparison of current PERCENT CHANGE FROM JUNE 2019 -6.51%
YTD totals with those in the MOTOR VEHICLE SALES AND RENTAL TAXES 394,204 3,881,437 -3.89%
equivalent period of the previous PERCENT CHANGE FROM JUNE 2019 -7.59%
fiscal year. MOTOR FUEL TAXES 250,041 2,933,524 -5.52%
PERCENT CHANGE FROM JUNE 2019 -23.80%
These numbers were current at FRANCHISE TAX 200,905 1,101,878 -72.07%
press time. For the most current PERCENT CHANGE FROM JUNE 2019 238.61%
data as well as downloadable OIL PRODUCTION TAX 82,713 2,824,047 -12.27%
files, visit comptroller.texas.gov/ PERCENT CHANGE FROM JUNE 2019 -77.24%
transparency. INSURANCE TAXES 29,543 1,633,751 5.39%
PERCENT CHANGE FROM JUNE 2019 -18.22%
Note: Texas’ fiscal year begins
CIGARETTE AND TOBACCO TAXES 116,308 1,064,455 -4.05%
on Sept. 1 and ends on Aug. 31.
PERCENT CHANGE FROM JUNE 2019 0.54%
NATURAL GAS PRODUCTION TAX 20,203 903,581 -37.87%
PERCENT CHANGE FROM JUNE 2019 -83.77%
ALCOHOLIC BEVERAGES TAXES 64,982 946,141 -16.95%
PERCENT CHANGE FROM JUNE 2019 -46.92%
HOTEL OCCUPANCY TAX 22,749 406,130 -21.58%
PERCENT CHANGE FROM JUNE 2019 -60.58%
UTILITY TAXES1 6,220 333,290 1.59%
PERCENT CHANGE FROM JUNE 2019 82.28%
OTHER TAXES 2 5,252 228,987 -16.22%
PERCENT CHANGE FROM JUNE 2019 -71.76%
TOTAL TAX COLLECTIONS $3,867,258 $44,552,686 -8.81%
PERCENT CHANGE FROM JUNE 2019 -14.37%
YEAR TO DATE:
YEAR TO DATE: CHANGE FROM
Revenue By Source JUNE 2020 TOTAL PREVIOUS YEAR
TOTAL TAX COLLECTIONS $3,867,258 $44,552,686 -8.81%
PERCENT CHANGE FROM JUNE 2019 -14.37%
FEDERAL INCOME 5,421,679 48,159,181 36.52%
PERCENT CHANGE FROM JUNE 2019 30.57%
LICENSES, FEES, FINES AND PENALTIES 460,030 5,063,410 -4.97%
PERCENT CHANGE FROM JUNE 2019 7.91%
STATE HEALTH SERVICE FEES AND REBATES3 1,224,464 5,939,714 -0.81%
PERCENT CHANGE FROM JUNE 2019 41.13%
NET LOTTERY PROCEEDS 4 209,693 1,951,318 -8.77%
1
Includes public utility gross receipts PERCENT CHANGE FROM JUNE 2019 13.90%
assessment, gas, electric and water LAND INCOME 51,443 1,639,819 -14.01%
utility tax and gas utility pipeline tax.
2
Includes taxes not separately listed, such PERCENT CHANGE FROM JUNE 2019 -72.12%
as taxes on oil well services, coin-operated INTEREST AND INVESTMENT INCOME 49,351 2,041,518 -5.39%
amusement machines, cement and combative
sports admissions as well as refunds to PERCENT CHANGE FROM JUNE 2019 -89.04%
employers of certain welfare recipients.
SETTLEMENTS OF CLAIMS 3,284 617,646 13.98%
3
Includes various health-related service fees
and rebates that were previously in “license, PERCENT CHANGE FROM JUNE 2019 -21.42%
fees, fines and penalties” or in other non-tax
revenue categories. ESCHEATED ESTATES 276,865 409,966 -11.65%
4
Gross sales less retailer commission and the PERCENT CHANGE FROM JUNE 2019 -13.21%
smaller prizes paid by retailers.
SALES OF GOODS AND SERVICES 16,134 201,663 -15.29%
Notes: Totals may not add due to rounding. PERCENT CHANGE FROM JUNE 2019 -35.10%
Excludes local funds and deposits by certain OTHER REVENUE 262,480 1,427,803 -51.82%
semi-independent agencies.
Includes certain state revenues that are deposited PERCENT CHANGE FROM JUNE 2019 -46.09%
in the State Treasury but not appropriated. TOTAL NET REVENUE $11,842,680 $112,004,723 5.80%
PERCENT CHANGE FROM JUNE 2019 1.95%
F I S C A L N O T E S J U N E / J U LY 2 0 2 0 | 11FIRST-CLASS MAIL
FISCAL NOTES PRESORTED
US POSTAGE PAID
AUSTIN TX
Te x a s C o m p t r o l l e r o f P u b l i c A c c o u n t s PERMIT NO. 1411
Communications and Information Ser vices Division
1 1 1 E . 1 7 t h S t . , S u i t e 3 0 1 , A u s t i n , T X 7 8 7 74 - 0 1 0 0
GLENN HEGAR
Texas Comptroller of Public Accounts
Fiscal Notes is one of the ways the Comptroller’s office strives FIELD OFFICES In compliance with the Americans with Disabilities Act,
to assist taxpayers and the people of Texas. The newsletter is a by-product of Find a list of all Comptroller field offices at this document is available in a reader-friendly format at
the Comptroller’s constitutional responsibilities to monitor the state’s comptroller.texas.gov/about/contact/locations.php. comptroller.texas.gov/economy/fiscal-notes.
economy and to estimate state government revenues.
ONLINE SUBSCRIPTIONS, RENEWALS OR CANCELLATIONS
Fiscal Notes also provides a periodic summary of the financial statements of Fiscal Notes may be entered at Texas Comptroller of Public Accounts
for the state of Texas. comptroller.texas.gov/economy/fiscal-notes Publication #96-369,
Send questions or comments to fiscal.notes@cpa.texas.gov June/July 2020
Articles and analysis appearing in Fiscal Notes do not necessarily represent
the policy or endorsement of the Texas Comptroller of Public Accounts.
Space is devoted to a wide variety of topics of Texas interest and HOW TO REACH US
general government concern. Contact the Communications and Information Services Division at
800-252-5555 (VOICE),
Fiscal Notes is not copyrighted and may be reproduced. 512-463-4226 (FAX).
The Texas Comptroller of Public Accounts would appreciate credit OR WRITE Fiscal Notes, Texas Comptroller of Public Accounts
for material used and a copy of the reprint. Communications and Information Services Division
111 E. 17th St., Suite 301, Austin, TX 78774-0100
12 | GLENN HEGAR, TEX AS COMPTROLLER OF PUBLIC ACCOUNTSYou can also read