Fitness and microbial networks of the common wasp, Vespula vulgaris (Hymenoptera: Vespidae), in its native and introduced ranges - Lirias
←
→
Page content transcription
If your browser does not render page correctly, please read the page content below
Ecological Entomology (2019), 44, 512–523 DOI: 10.1111/een.12732

Fitness and microbial networks of the common wasp,
Vespula vulgaris (Hymenoptera: Vespidae), in its native
and introduced ranges
M O N I C A A . M . G R U B E R, 1,2∗ O L I V E R Q U I N N, 1∗
J A M E S W . B A T Y, 1 J A N A D O B E L M A N N, 1 J O H N H A Y W O O D, 3
T O M W E N S E L E E R S 4 and P H I L I P J . L E S T E R 1,2∗ 1 Centre for Biodiversity and
Restoration Ecology, School of Biological Sciences, Victoria University of Wellington, Wellington, New Zealand, 2 Pacific
Biosecurity, Victoria Link Limited, Victoria University of Wellington, Wellington, New Zealand, 3 School of Mathematics and
Statistics, Victoria University of Wellington, Wellington, New Zealand and 4 Department of Biology, Laboratory of Socioecology and
Social Evolution, Leuven, Belgium

 Abstract. 1. Variation in microbial communities between populations is increasingly
 hypothesised to affect animal fitness and performance, including for invasive species.
 Pathogenic species may be lost during the introduction process, enhancing invader
 fitness and abundance.
 2. This study assessed fitness, immune gene expression, and microbial network
 complexity of invasive common wasps, Vespula vulgaris. Microbial networks were
 assayed using 16S and 18S sequencing and gene expression arrays in the native
 (Belgium) and introduced range (New Zealand). The immune gene expression of the
 wasp Down syndrome cell adhesion molecule (Dscam) gene homologue was examined.
 Dscam expression can be induced by viruses, Gram-positive and Gram-negative
 bacteria, and parasites.
 3. Individual nest fitness was higher in the native range of Belgium than in the
 introduced New Zealand range. Microbial communities of wasps in the introduced range
 were more diverse with more complex networks, although some microorganisms were
 range-specific. Microbial networks in the introduced range showed higher clustering
 coefficients, number of connected paths, network centralisation, number of neighbours
 and network density.
 4. Larvae, workers, virgin and foundress queens had higher expression of Dscam in
 the New Zealand samples. These immune gene expression patterns were associated with
 higher pathogen pressure and lower relative fitness.
 5. Epidemiological theory predicts that a high density of pathogen and microbial
 hosts should result in a high rate of disease infection, prevalence, and highly connected
 microbial networks. The results of this study support these predictions. Wasps displayed
 lower relative fitness and more highly connected microbial networks in New Zealand
 than in Belgium.
 Key words. Bacteria, fungi, invasive species, pathogens, social wasps, viruses.

 Correspondence: Philip J. Lester, School of Biological Sciences, Victoria University of Wellington, P.O. Box 600, Wellington 6140, New Zealand.
E-mail: Phil.Lester@vuw.ac.nz
 ∗ These authors contributed equally to this study.

512 © 2019 The Royal Entomological Society
Invasive wasp fitness and networks 513

Introduction diversity. Finally, we examined the relative expression of the
 wasp Down syndrome cell adhesion molecule (Dscam) gene
There is an increasing awareness that microbial communities homologue. Splicing of this gene results in thousands of iso-
can affect animal fitness and performance. Microbial commu- forms (Schmucker et al., 2000; Armitage et al., 2015). Ng et al.
nities in the gut, for example, are involved in much more than (2014) reviewed the role of Dscam in both the general innate
just nutrition. These communities can be vital for host immunity immunity and the pathogen-specific immune response of inver-
and shape life-history traits or animal behaviour (Shapira, 2016). tebrates. They found evidence that Dscam expression can be
A developing paradigm suggests that individuals cannot be con- modified by viruses, Gram-positive and Gram-negative bacteria,
sidered truly independent of the microbial communities they pathogen association molecular patterns, and parasites. Dscam
host, with even minor perturbations to hosts and their micro- has previously been shown to be significantly up-regulated in
bial communities having long-term health and fitness impacts virus- and microsporidian-infected honey bees (Flenniken &
(McFall-Ngai et al., 2013). A substantial perturbation is a bio- Andino, 2013; Schwarz & Evans, 2013; Brutscher et al., 2015).
logical introduction event, wherein a population is moved to a Under a scenario of enemy release (Keane & Crawley, 2002;
new area, leading to the formation of new microbial communi- Torchin et al., 2003), we would expect to see lower Dscam
ties in the host (e.g. Lester et al., 2017b). expression in the introduced range of New Zealand.
 The common wasp, Vespula vulgaris, is listed in a selection
of the world’s worst invasive species (Lowe et al., 2000). This
omnivorous wasp is native to Eurasia and has had multiple Materials and methods
introductions to countries such as Argentina, Australia and New
 Fitness of wasps in the native and introduced ranges
Zealand (Lester et al., 2014). In their introduced range, the
ecological impacts of common wasps are density-dependent. For Common wasps were introduced and became abundant in New
example, in beech forests of New Zealand, large populations of Zealand in the 1970s, and appear genetically similar to those
common wasps are predators that decimate insect communities in Belgium, the U.K. or other areas of western Europe, which
and compete with forest birds (Lester & Beggs, 2019). In these are all probable source populations (Lester et al., 2014). We
forests they reach the highest known nest densities, with up to 40 collected wasp nests in late autumn for 3 years between 2014
nests ha−1 (Lester et al., 2017a). In comparison, a 32-year annual and 2016 in part of both the native range (Belgium) and an
survey from the native range of England showed an average of introduced country (New Zealand) (Appendix S1) in the period
just 0.45 common wasp nests ha−1 (range = 0.35–1.78) (Archer they were producing new sexuals. We attempted to sample
& Halstead, 2014). These wasps thus appear to ‘perform better’ additional sites in the native range of England and the introduced
in their introduced range (Parker et al., 2013). a range from Argentina, but a lack of available wasp nests
 The search for biological control agents for introduced popu- in England in the year of sampling and volcanic activity in
lations of this wasp has detected a number of potential pathogens Argentina restricted our sampling in these locations.
commonly found in honey bees. These include Deformed wing The annual cycle of a common wasp nest begins with a single
virus, Kashmir bee virus, Nosema, Aspergillus, as well as poten- inseminated queen initiating a new nest in spring. She produces
tial commensals, such as Bifidobacterium, Vagococcus, and sterile worker wasps from spring until autumn. New virgin
Streptococcus (Glare et al., 1996; Rose et al., 1999; Evison queens (gynes) and males are produced in autumn. The number
et al., 2012). These microbial pathogens have been hypothesised of these new queens produced is correlated with worker num-
to play a substantial role in honey bee health and to contribute bers (Spradbery, 1971), which have the role of provisioning and
to their population collapse (Bromenshenk et al., 2010; Evans & tending the virgin queens. The autumn nests were located by
Schwarz, 2011; Cornman et al., 2012). Mutualistic or commen- observing foraging workers. Each nest was excavated and trans-
sal microbial symbionts can also enhance nutrition and immune ferred into a sealed bucket, which was then chilled at −20 ∘ C
defence of their social insect hosts, either facultatively or obli- for c. 2 h. After chilling, all wasps were alive but able to be
gately (Kaltenpoth & Engl, 2014). Differences in the abundance handled. A sample of c. 30 individuals of each life stage of live
and diversity of pathogens and perhaps entire microbial commu- fourth- or fifth-instar larvae, adult workers, and virgin queens
nities within wasps might play a part in the variation in perfor- was randomly collected from every nest and snap-frozen in liq-
mance and abundance of common wasps. uid nitrogen. Samples were then stored at −80 ∘ C before RNA
 Here, we first examine the hypothesis that the relative fit- extraction. For the 16S and 18S amplicon sequencing, a single
ness of wasps will be higher in their introduced range in New nest was sampled from three sites in Belgium and three in New
Zealand compared with that in their native Belgium. We then Zealand, all of which were separated by > 20 km. We randomly
examine the microbial communities in the two regions. Due to sampled and combined five individuals of fourth- or fifth-instar
the introduction bottleneck (Lester et al., 2014) and perhaps an larvae, five workers, and five virgin queens from each of these
escape from natural enemies (Torchin et al., 2003), we expected nests for nucleic acid extraction. When identifiable and avail-
that the microbial interaction network associated with wasps able, we also sampled the ‘foundress queen’ (the wasp queen
would be considerably more complex in native Belgium than that founded and initiated the colony the previous spring), which
in the examined introduced populations in New Zealand. We were identified from their characteristically torn wings. Each
hypothesised that the variation in wasp fitness, and the higher foundress queen was homogenised for nucleic acid extraction
performance of wasps in the introduced range of New Zealand, individually. We collected a total of 26 nests from Belgium and
would be associated with differences in microbial community 61 from New Zealand over the period 2014–2016 (Appendix

© 2019 The Royal Entomological Society, Ecological Entomology, 44, 512–523
514 Monica A. M. Gruber et al.

S1). These samples provided microbial community data and extracted from wasp samples using the PureLink® RNA Mini
were used in the TaqMan Array Cards (Applied Biosystems, Kit and the TruSeq libraries (Thermo Fisher Scientific, Waltham,
Foster City, California; hereafter referred to as the array). Massachusetts). RNA was extracted using the methods of Quinn
 To assess colony productivity or fitness from each collected (2017). Viruses were selected based on the methods of Gruber
nest, the outer nest paper was removed and the combs were et al. (2017) and Quinn (2017).
laid flat. An image was then captured to estimate the number of After detection and identification of prokaryote, eukaryote
worker and queen cells. Worker cells are used to rear workers and viral candidates, specific array targets were selected in
and the majority of males, whereas the large cells are used for the addition to an assay created for the putative immune gene Dscam
new queens (Spradbery, 1973). We used imagej2 software (Rue- (Appendix S1). Array assays were designed by the authors
den et al., 2017) to measure the size of a minimum of 10 large and Thermo Fisher Scientific. Samples of individual foundress
queen cells and 10 small worker cells from photographs of each queens, workers, and gynes from the native and introduced
nest. Then total areas of worker and queen cells were divided by ranges (Belgium, n = 77, and New Zealand, n = 162; Appendix
the mean cell size to calculate cell number for each nest. Direct S1) were analysed for prevalence of the selected microbial
counts of wasps were impossible due to workers foraging and taxa. For each sample, 200 ng cDNA was mixed with TaqMan
actively defending the nest during the collection process. Fast Advanced Master Mix (Applied Biosystems), and then
 We used a permutational manova analysis with 9999 permu- added to the array cards. The cards were processed as per the
tations in the adonis package (Oksanen et al., 2016) in r (R manufacturer’s instructions and analysed with a QuantStudio
Core Team, 2018) to examine the hypothesis that the relative 7 Flex Real-Time PCR System (Applied Biosystems; Thermo
fitness of wasps was higher in the introduced range. The primary Fisher Scientific) using recommended PCR conditions. Cycle
fitness estimator used was the number of queen cells produced threshold (Ct) values were used to calculate target levels relative
per nest, estimated from the number of queen cells in autumn to the reference genes using the equation 2(−Cttarget ) ∕2(−Ctreference ) .
for each nest. Our permutational manova also included the total Relevance networks were derived from Spearman’s rank
number of worker cells and the ratio of queen cells to worker correlations for the 16S, 18S, and array datasets, split by
cells for each nest. country and extracted using the tidyverse (Wickham, 2017),
 corrr (Jackson, 2016), and igraph (Csardi & Nepusz, 2006)
 packages in r. Relevance networks are bipartite graphs where
Network complexity in the introduced and native ranges nodes represent variables and edge colour represents the asso-
 ciation strength. Only associations exceeding a user-specified
 We assessed microbial diversity using nest samples from threshold are shown in the resulting networks (see Fig. 2 later).
2014 in both ranges. We then selected representative prokaryote Undirected network interactions were visualised in cytoscape
and eukaryote symbiont/pathogen candidates and mutualists (Shannon et al., 2003), with network statistics collected using
for the array to assess prevalence of selected taxa in individual networkanalyzer (Assenov et al., 2007).
wasps. The taxa selected for the array included important social
insect pathogens and mutualists that are known to be shared Is wasp fitness associated with differences in microbial
among Hymenoptera. For the array we sampled all the nests community diversity?
collected from 2014 to 2016. Codes for the taxa used in the array
are in Appendix S1. We hypothesised that the variation in wasp fitness would
 Prokaryote microbial diversity was assessed and array targets be associated with differences in the microbial communities.
were chosen based on 16S amplicon sequencing (Quinn, 2017). For this analysis we categorised all nests according to five
DNA was extracted using the DNeasy Blood & Tissue Kit; levels of fitness based on the number of queen cells observed
Qiagen, Hilden, Germany. Amplicons of 16S ribosomal RNA in autumn: < 100, very low; 100–500, low; 500–1000, medium;
genes were prepared following the Illumina 16S Metagenomic 1000–1500, high; >1500, very high). We fitted permutational
Sequencing Library Preparation Protocol, targeting the V3–V4 manova models with 9999 permutations in the adonis package
region of the 16S rRNA gene using Nextera adapter primers (Oksanen et al., 2016) in r (R Core Team, 2018). The models
and dual-index barcodes (Illumina, San Diego, California) used Jaccard dissimilarity measures, and initially included
(Illumina, 2013). Prokaryotes were identified using the qiime interactions between fitness and country, and life stage and
v.1.9.1 pipeline (Caporaso et al., 2010), including pandaseq country. We then fitted simpler models and chose the best-fitting
v.2.8 (Masella et al., 2012), the SILVA 128 database (Quast option using Akaike information criterion values. Separate
et al., 2013), the pynast alignment tool (Caporaso et al., 2010), models were fitted for the 16S, 18S, and array data. We did
and chimeraslayer (Haas et al., 2011). Eukaryote microbial not categorise the microbial taxa into mutualists, commensals
diversity and array targets were assessed using 18S amplicon or pathogens, because very little is known about their influence
sequencing. DNA was extracted using the same method as on wasp biology, and such a classification would be speculative.
prokaryote sequencing and amplicons were prepared according
to the protocols outlined in the Earth Microbiome Project Is the expression of the putative immune gene Dscam lower
(Thompson et al., 2017). Eukaryote diversity was analysed in the introduced range?
using the silvangs v.1.3 pipeline (Quast et al., 2013). Viral
targets for the array were selected using an Illumina RNAseq We also included the putative immune gene Dscam in the
approach. The viral candidates were derived from total RNA array. The Dscam assay was designed based on the published

 © 2019 The Royal Entomological Society, Ecological Entomology, 44, 512–523
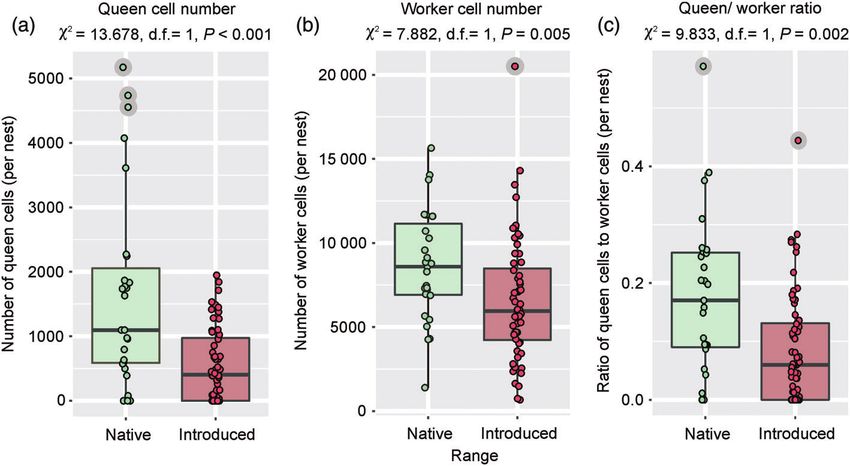
Invasive wasp fitness and networks 515

Fig. 1. All estimates of common wasp relative fitness on a per-nest basis were higher in the native (Belgium) than in the introduced (New Zealand)
range. P-values and 2 results are from univariate Kruskal–Wallis tests. Boxplots show the mean and the 25th and 75th percentiles, with whiskers
extending from the hinge to the highest or lowest value that is within 1.5 × the interquartile range of the hinge, with outliers in grey circles automatically
beyond this range. Outliers were not excluded from the associated permutational manova. [Colour figure can be viewed at wileyonlinelibrary.com].

Polistes, Bombus, and Apis mellifera genomes, as the Vespula for spatial autocorrelation between nests in fitness measures
genome was not available. In A. mellifera, the assay region is (Appendix S1).
within terminal exon 1 (GenBank accession AB273636.1). A
preliminary analysis indicated the expression patterns were not
normally distributed. Consequently, we analysed the data using Network complexity in the introduced and native ranges
the ‘aovp’ function for permutation testing of linear models in
the r package lmperm (Wheeler & Torchiano, 2016). We assessed microbial diversity using 16S sequencing
 to examine prokaryotes and 18S sequencing for eukaryotes,
 using nest samples from 2014. Full details of the number
Results of reads and other sequencing results and statistics can be
 found in Quinn (2017). Our amplicon sequencing identified
Fitness of wasps in the native and introduced ranges 467 prokaryote and 80 eukaryote taxa from common wasps.
 The native range included 358 prokaryote and 38 eukaryote
 The primary fitness estimator that we used was the number taxa, whereas the introduced range included 386 prokaryote
of new queen cells produced per nest, which was estimated from and 61 eukaryote taxa. Of the prokaryote taxa, 277 were present
the number of queen cells in autumn for each nest. Our permu- in both New Zealand and Belgium, 109 were absent in the
tational manova also included the number of worker cells and introduced range, and 81 were absent in the native range. Of
the ratio of queen cells to worker cells for each nest. All three the 80 eukaryote taxa, 17 were present in both ranges, 19 were
fitness measures were correlated (Appendix S1). For all three absent in the introduced range of New Zealand, and 44 were
estimators, fitness was higher in the native than in the introduced absent in the Belgian native range.
range of New Zealand (Fig. 1). The median number of queen We examined the hypothesis that the microbial interaction
cells produced per nest in New Zealand was less than 50% of the network would be considerably more complex in the native
Belgian median (Fig. 1a). This lower queen cell production was than in the introduced population. Based on the number of
correlated with smaller numbers of worker cells in New Zealand taxa and the complexity of each set of networks, we set the
nests (Fig. 1b). A permutational manova with the three estima- correlation threshold for network visualisation and analysis for
tors as response variables and factors of region and year plus the 16S data to 0.9, that for the 18S data to 0.3, and that
a region × year interaction confirmed significantly higher fit- for the array data to 0.15. Contrary to our expectations, the
ness in the native range (F = 6.745, d.f. = 1, 81, P = 0.009). Fit- networkanalyzer results revealed that interaction networks
ness also varied temporally (F = 4.829, d.f. = 2, 81, P = 0.008), were significantly more complex in the introduced range of New
which was expected due to factors that include interannual cli- Zealand than in the native range of Belgium for both the 16S
mate variability (Lester et al., 2017a). There was no significant and 18S datasets (Fig. 2). The 16S prokaryote network had the
interaction between region and year (F = 0.477, d.f. = 2, 81, most taxa and the highest level of differentiation (Fig. 2a,b).
P = 0.648). The median ratio of queen cells to worker cells per Comparatively, the New Zealand range 16S network showed
nest was nearly three-fold higher in the native range (0.170) than higher values for the clustering coefficient, number of connected
in the introduced range (0.059) (Fig. 1c). There was no evidence paths, network centralisation, number of shortest paths, mean

© 2019 The Royal Entomological Society, Ecological Entomology, 44, 512–523
516 Monica A. M. Gruber et al.

Fig. 2. Hierarchical layouts of undirected 16S prokaryote (a, b), 18S eukaryote (c, d), and array (e, f) networks of microbial taxa in Belgium and New
Zealand. Node properties shown include degree (number of linkages per node) and closeness centrality (average shortest path from one node to all
other nodes). Node size is mapped to closeness centrality (low values, smaller circles), and node colour is mapped to degree (low values, green; high
values, coral; intermediate values, blue). Edge betweenness (the number of number of shortest paths that pass through an edge) is mapped to edge size
and edge colour (low values, thinner lines in green; high values, thicker lines in coral; intermediate values, blue lines). The overall topology comparisons
between the networks of the different ranges is most relevant here, with taxa names able to be discerned in figures in the supporting information.

 © 2019 The Royal Entomological Society, Ecological Entomology, 44, 512–523
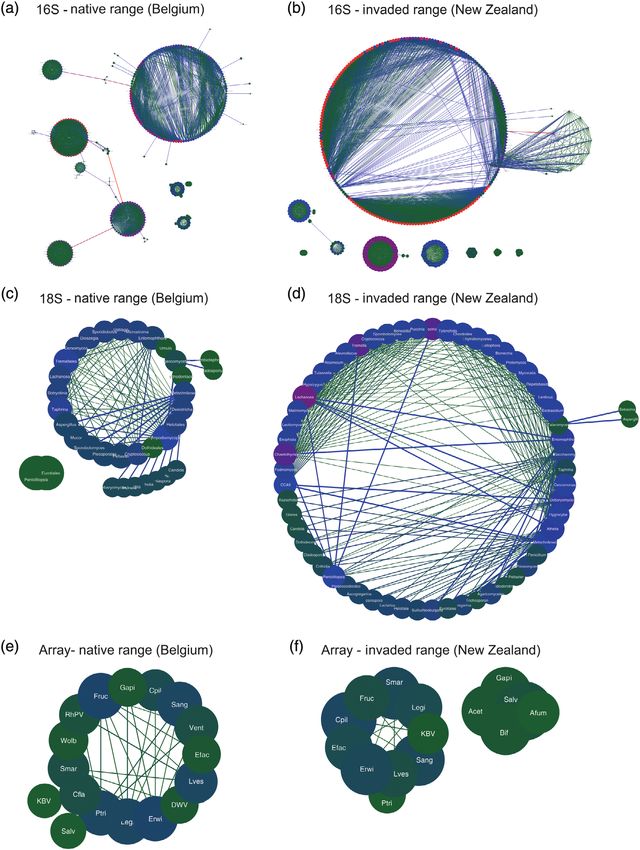
Invasive wasp fitness and networks 517

Table 1. Properties of the microbial networks derived from the 16S, 18S, and array data in the native (Belgium) and introduced (New Zealand) ranges,
derived from networkanalyzer (Assenov et al., 2007) and cytoscape (Shannon et al., 2003).

 16S (prokaryotes) 18S (eukaryotes) Array
 Native Introduced Native Introduced Native Introduced

Correlation cut-off 0.90 0.90 0.30 0.30 0.15 0.15
Clustering coefficient 0.775 0.821 0.813 0.800 0.503 0.723
Connected components 5 8 2 1 1 2
Network diameter 17 15 5 4 4 3
Network radius 1 1 1 2 2 1
Network centralisation 0.065 0.107 0.318 0.296 0.263 0.286
Shortest paths 49 786 57 844 1058 3540 272 110
Characteristic path length 5.585 4.595 2.355 2.107 1.882 1.455
Mean number of neighbours 20.36 27.93 8.80 14.13 5.29 4.53
Number of nodes 349 349 35 60 17 15
Network density 0.059 0.080 0.259 0.240 0.331 0.324
Network heterogeneity 0.629 0.626 0.507 0.498 0.479 0.489
Multi-edge node pairs 3553 4874 154 424 45 34

The correlation cut-off was chosen for the purpose of meaningful visualisation, based on the size of the network.

Table 2. Results of permutational manova analysis of 16S, 18S, and array microbial taxa in the native (Belgium) or introduced (New Zealand) range.

 16S (Prokaryotes) 18S (Eukaryotes) Array
Predictor term F-perm P-value F-perm P-value F-perm P-value

Range (introduced or native) 4.980 0.001∗∗∗ 1.428 0.015∗ 4.297 0.003∗∗
Fitness 1.596 0.047∗ 0.964 0.605 1.166 0.258
Life stage 1.136 0.304 1.315 0.024∗ 2.105 0.005∗∗
Year N/A N/A N/A N/A 8.227 0.001∗∗∗
Range × fitness 1.404 0.099 0.976 0.548 1.181 0.226
Range × life stage 1.111 0.285 1.313 0.019∗ 2.256 0.015∗
Range × year N/A N/A N/A N/A 2.247 0.013∗

∗P < 0.05;
∗∗P < 0.01;
∗∗∗P < 0.001.
The life stages analysed were larvae, adult workers and new queens from each nest. The 16S and 18S data were only for 2014, whereas the array used
a larger number of nests (but fewer microbial taxa) from 2014, 2015 and 2016. N/A, not applicable.
number of neighbours, network density and multi-edge node significantly between Belgium and New Zealand for all three
pairs than were seen in the Belgian native range network datasets (16S, 18S, and array). Other factors affected the 16S,
(Table 1). The network centralisation parameter is especially 18S, and array microbial communities differently (Table 2). Dif-
informative, as it is frequently interpreted as the risk of a ferent microbial communities were significantly associated with
node being influenced (or infected in this case) by whatever variation in wasp fitness only for the 16S data. Fitness was
is flowing through the network (e.g. one pathogen influencing not significant (P ≥ 0.258) for the 18S or array data. We also
another). Network complexity was not as well differentiated for observed statistically significant range × life stage interactions
the 18S eukaryote networks, which naturally had fewer taxa than (18S, P = 0.019; array, P = 0.015; Table 2), and range × year
the 16S networks (Fig. 2c,d). However, like the 16S network, interactions (array, P = 0.013).
the 18S introduced network had a substantially higher number Of the 21 microbial taxa screened in the array (Appendix S1),
of shortest paths, mean number of neighbours and multi-edge 18 were shared between the ranges, one was absent in New
pairs (Table 1). The array showed less differentiation between Zealand (Vagococcus entomophilus, a putative commensal), and
the Belgian and New Zealand ranges (Fig. 2e,f), which was two were absent in Belgium (Acetobacter and Bifidobacterium,
expected as there were many fewer taxa in the array. cytoscape both putative commensals). Differences in the microbiome
session files for more detail and interactive network visualisation between countries and life stages were highlighted by viral
are provided as supporting information (Appendices S2–S8). infection results from the array data (Fig. 3). The three viruses
 examined on the array were found in both ranges. The Kashmir
Is wasp fitness associated with differences in microbial bee virus (KBV) was the most commonly observed virus, in
community diversity? 147 of the 278 samples analysed, and in larvae, worker, and
 queens from both the native and introduced ranges. The KBV
 The permutational manova analysis of fitness and micro- infection rate of 65% of all samples observed in New Zealand
bial diversity revealed that microbial communities differed was nearly three-fold and significantly higher than the 23% in

© 2019 The Royal Entomological Society, Ecological Entomology, 44, 512–523
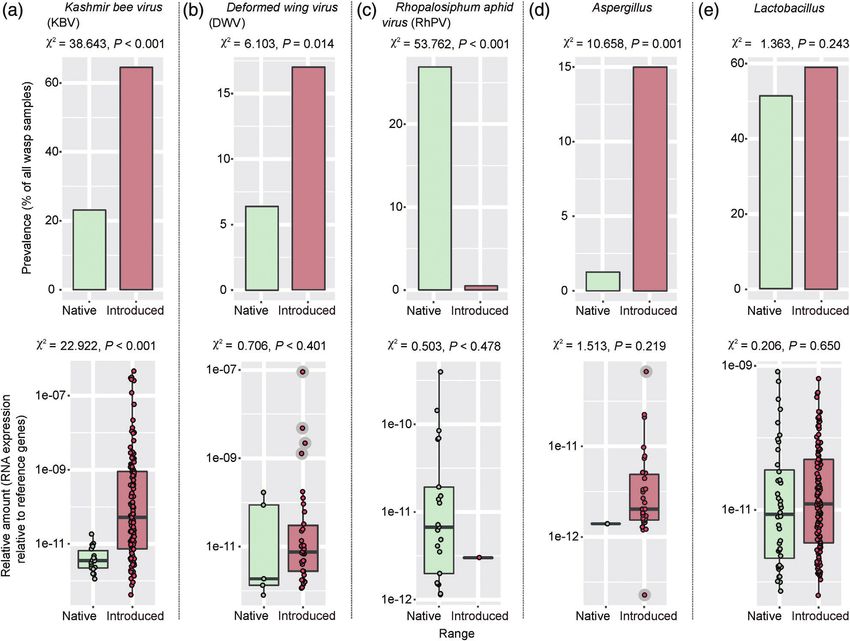
518 Monica A. M. Gruber et al.

Fig. 3. The prevalence (upper graphs) and relative abundance (lower graphs) of five microbial taxa from the TaqMan array analysis. The prevalence
was based on the total number of wasp samples, from all life stages, in which the microbe was observed in each range. P-values and 2 results at the
top of prevalence graphs are from two-sample tests for independent proportions. The relative abundance is based on the RNA expression for each target
relative to the reference gene. P-values and 2 results are from univariate Kruskal–Wallis tests. [Colour figure can be viewed at wileyonlinelibrary.com].

Belgium. KBV was also present in significantly higher titres in and other mammals) showed a remarkably similar prevalence
the introduced range (Fig. 3a). The Deformed wing virus (DWV) between ranges, at 64% and 65% of samples in the introduced
was also nearly three-fold and significantly more prevalent in and native range, respectively, with a median abundance almost
the introduced range of New Zealand than in the Belgian native exactly the same in the two ranges. The likely mutualistic bacte-
range (Fig. 3b). The DWV was not observed in queens from rial genus Lactobacillus also showed similar rates of prevalence
either range, often despite workers in the same nest being and abundance in both ranges (Fig. 3e).
infected. The Rhopalosiphum padi virus (RhPV) was observed
in 27% of samples from the native range and in all life stages
there (Fig. 3c). However, RhPV was found at extremely low Is the expression of the putative immune gene Dscam lower
titres from only one sample in New Zealand, which could have in the introduced range?
been a false-positive.
 Of the prokaryote taxa on the array, like the viruses, some Wasps in the introduced range of New Zealand always showed
putative pathogens such as Aspergillus were more prevalent in higher median expression of the putative immune gene Dscam
the introduced range (15% vs. 1%; Fig. 3d). Others, such as than in the Belgian native range (P = 0.002; Fig. 4; Appendix
the Lotmaria/Crithidia target, had a similar rate of infection S1). Different wasp life stages also showed varying expression
between ranges (12% in the introduced vs. 10% in the native; patterns (P < 0.001; Appendix S1), with the lowest median
 2 = 0.088, d.f. = 1, P = 0.767). Our assay for the putative tar- values for larvae in the native range and the highest for adult
get Enterococcus faecalis (a Gram-positive, commensal bac- worker wasps in the introduced range. The variation between
terium previously found in the gastrointestinal tracts of humans sampling years in Dscam expression (P < 0.001; Appendix S1)

 © 2019 The Royal Entomological Society, Ecological Entomology, 44, 512–523
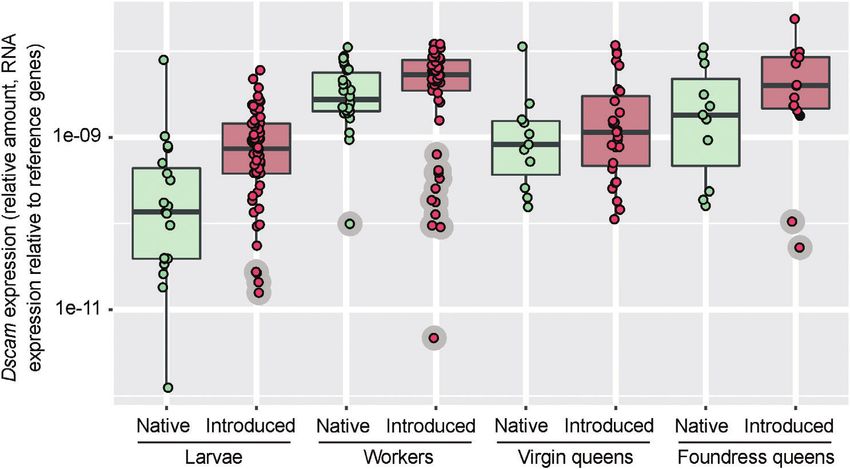
Invasive wasp fitness and networks 519

Fig. 4. The relative expression of the immune gene Down syndrome cell adhesion molecule (Dscam) from life stages of wasps in both the native
(Belgium) and introduced (New Zealand) ranges, from the TaqMan array analysis. Foundress queens refer to the queen wasp that had been present
in the nest and produced all the larvae, workers, and virgin queens in autumn. Median expression levels of Dscam within each life stage were always
higher in the introduced range, relative to the native. The relative expression is based on the mRNA quantification for Dscam relative to the reference
gene. [Colour figure can be viewed at wileyonlinelibrary.com].

is consistent with the significant variation between years in of median queen cells per nest and nest density indicates that
the relative abundance of microbial taxa from the array data at a landscape-scale queen production in the introduced range
(Table 2). is approximately 10-fold higher each year than in the native
 range, which is the opposite of our finding for individual nests.
 The relatively high landscape-level nest density is likely to be a
Discussion combination of many factors, including food and resource avail-
 ability, as well as a lack of any other competing Vespula or social
Wasp nest fitness in the introduced range was approximately wasp species (Lester & Beggs, 2019). There is likely to be much
half that of the native range. The median number of queen cells more intraspecific competition in New Zealand than in Belgium.
per nest in the native range in Belgium (1097) was over twice This high landscape-level nest density and wasp abundance have
as high as in the introduced range in New Zealand (404). Fur- implications for the spillover and spillback of pathogens and par-
ther, these results are likely to be compounded by the previously asites, and the enemy release hypothesis.
observed relationship between nest size and queen quality. Har- Different microbial communities formed in each of the host
ris and Beggs (1995) found that smaller nests typically produce ranges. The enemy release hypothesis is one of the most fre-
smaller queens, and smaller queens are under-represented in the quently cited explanations for invasion success, which relies on
reproductive population of the following year. Our results also the key condition that ‘enemy loss’ occurs, and the assump-
indicate that it takes c. 16.9 workers to rear a queen in the intro- tion that these enemies have substantial negative effects on the
duced range, which is nearly three-fold higher than in the native invasive species’ performance in their native range (Prior et al.,
range (5.9 workers). This result contrasts with conclusions from 2014). In the native range, our analysis found 358 prokary-
a meta-analysis of 53 species by Parker et al. (2013), who found ote and 38 eukaryote taxa, and the introduced range included
strong evidence for a typically enhanced reproductive output and 386 prokaryote and 61 eukaryote taxa. These richness esti-
organism size in the introduced relative to the native range. Only mates fall between estimates for the microbial diversity in bees
a single species had a relatively reduced reproductive output in and invasive ants using similar methods (Hubert et al., 2015;
the introduced range (an amphipod shrimp, Crangonyx pseudo- Lester et al., 2017b). Our permutational manova used a pres-
gracilis) (Parker et al., 2013). Our study organism, the common ence or absence matrix and indicated significant effects of the
wasp, was cited in this review as having higher abundance in prokaryote community on wasp fitness (Table 2). This analysis
the introduced range, but no data for reproductive output were is suggestive that variation in microbial communities is asso-
presented (Parker et al., 2013). Indeed, on a landscape scale, ciated with the relative fitness of these invasive wasps, as has
these wasps show a contrasting pattern of abundance and rel- been shown in honey bees (Bromenshenk et al., 2010; Evans
ative fitness to our finer-scale analysis. The median number of & Schwarz, 2011; Cornman et al., 2012). There is evidence for
nests from long-term surveys in this area of New Zealand is 11.8 the hologenome paradigm in honey bees, which suggests that
nests ha−1 (Lester et al., 2017a) compared with 0.45 nests ha−1 their fitness is determined by a composite of bee and micro-
in England (Archer & Halstead, 2014). Simple multiplication biota genomes (Schwarz et al., 2015), which appears also to

© 2019 The Royal Entomological Society, Ecological Entomology, 44, 512–523
520 Monica A. M. Gruber et al.

be likely for the common wasp. We have previously found fit- (Parker et al., 2015). Consequently, although a small number
ness effects of viruses on wasps in New Zealand (Dobelmann of introduction events might limit the pathogens brought by
et al., 2017). Our current study is the first to find an effect any one introduced population into a new community and
on fitness of prokaryote communities. It is possible that the range, prior introductions from a wide variety of related exotic
bacteria we detected are candidates for biological control of species might have already populated the landscape with a rich
wasps, although our results could also be associated with micro- and diverse microbial community containing many generalist
bial species that are missing from the introduced range of New pathogens.
Zealand. Prokaryote communities were also significantly dif- Epidemiological theory predicts that a high density of
ferent between ranges. This result could indicate a degree of pathogen and microbial hosts would result in a high rate of
enemy or mutualist loss, although the description and role of disease infection and prevalence, and highly connected micro-
many of the taxa involved here are lacking, because of the bial networks. Within social insect nests, increasing colony size
paucity of research on the function of the microbial fauna of and complex interaction networks are predicted to facilitate
wasps. pathogen transmission and spread (Naug & Camazine, 2002).
 Many of the microbial taxa were observed in both the intro- Importantly, intercolony exchange of workers has frequently
duced and native ranges. Our previous work has similarly found been observed in wasps, with estimates ranging from 1–2% of
no evidence of microbial enemy loss for common wasp popu- workers in Vespula maculifrons (Lord et al., 1977) to 56% of
lations in New Zealand or elsewhere in their introduced range workers in Polistes canadensis moving among nests situated
(Lester et al., 2015), despite evidence of as few as six suc- within overlapping foraging ranges (Sumner et al., 2007). This
cessful introductions for the New Zealand populations (Lester exchange of workers between nests combined with the potential
et al., 2014). Putative pathogens such as Nosema spp. and Acti- acquisition of pathogens via foraging in a common environ-
nobacteria are present throughout the wasps’ distribution (Lester ment (Singh et al., 2010) would facilitate a highly connected
et al., 2015). Similar results showing a lack of enemy release pathogen and microbial network. Pathogen infection risk is
despite a genetic bottleneck have been shown for several intro- typically associated with high connectivity via individuals or
duced species, including the German wasp Vespula germanica the common use of habitat (Godfrey, 2013; White et al., 2017).
(Brenton-Rule et al., 2018), starlings (Colautti et al., 2005) and Consequently, it was not surprising that the high nest densities
freshwater amphipods (Slothouber Galbreath et al., 2009). Lack observed in the introduced range (Lester et al., 2017a) have
of enemy release for starlings is thought to be due to a combina- led to relatively dense, centralised microbial networks. The
tion of the birds bringing parasites with them, acquiring parasites prokaryote interaction network in the introduced range was
from their native range through alternative hosts, and acquir- especially complex, showing higher values for the clustering
ing parasites from birds in the introduced range (Colautti et al., coefficient, network centralisation, number of shortest paths,
2005). This pattern has probably been repeated with common mean number of neighbours, and network density. It was not
wasps. surprising either that the lower nest densities and likely low rate
 Our analysis also indicated differences between ranges that of contact and exchange of worker wasps in the native range
included the apparent loss of some taxa and acquisition of could have the opposite effect.
others that are likely to be pathogens. The array analysis The expression of the putative immune gene Dscam was
comprised the greatest number of samples and provided the significantly higher in the introduced range, which was another
highest confidence for the probable absence of species such result that was inconsistent with our predictions. The median
as RhPV from wasps in New Zealand. The RhPV virus was Dscam expression in worker wasps from the native range was
initially described from aphids but has since been observed in only 52% of that in the introduced range. Although Dscam is
honey bees and a parasitic wasp (Oliveira et al., 2010; Roberts known to be up-regulated by viral challenges in honey bees
et al., 2018). Common wasps in the introduced range appear (Brutscher et al., 2015) and is thought to have a broad role
to have acquired Aspergillus, which is a pathogen known from in invertebrate immune systems (Ng et al., 2014), its precise
honey bees (Foley et al., 2014) and previously from wasps in function in wasps is unknown. The patterns of Dscam expression
New Zealand (Glare et al., 1996). Many of the viruses, bacterial might instead suggest that wasps face a greater challenge from
and fungal pathogens identified in our work are generalist taxa pathogens and parasites in the introduced range of New Zealand
that have been observed in a range of arthropod hosts (e.g. than in the Belgium native range. That result is consistent
Levitt et al., 2013; Gruber et al., 2017; Loope et al., 2019). Like with our array data and the network analyses, as well as the
most other countries, New Zealand has had a range of exotic observation that it takes approximately three-fold more workers
insect introductions, including honey bees, 12 other bee species, to produce each queen in the introduced than it does in the native
paper and German wasps, and many parasitoids introduced for range. Little is known, however, about Dscam in these wasps,
biological control purposes. Pathogen spillover and spillback and experimental manipulation would be needed to confirm this
from such species are considered likely in invasive species result for this species.
introductions and there is evidence of this in hymenopteran On an individual nest basis, our results do not support the
communities (Singh et al., 2010; Fürst et al., 2014; Faillace hypothesis that V. vulgaris performs better in their New Zealand
et al., 2017; Loope et al., 2019). Similarly, in other ecosystems introduced range (Parker et al., 2013). On a landscape scale
such as grasslands, the disease prevalence can be explained in this area of the introduced range, however, these wasps are
by the abundance of the focal host and the abundance of all managing to attain the world’s highest known densities for this
related species in the community that may share the disease species.

 © 2019 The Royal Entomological Society, Ecological Entomology, 44, 512–523
Invasive wasp fitness and networks 521

Acknowledgements analysis package (and can be imported in to cytoscape for
 visualisation).
We thank the many field assistants involved in wasp nest col-
lection. We thank two referees for comments that substantially
improved this manuscript. This work was supported by the Min- References
istry of Business, Innovation and Employment (New Zealand’s
 Archer, M.E. & Halstead, A. (2014) Population dynamics of social
Biological Heritage NSC, C09X1501. It was also supported wasps (Hymenoptera: Vespidae) in the Royal Horticultural Society’s
by a Royal Society Te Apārangi Marsden grant to PJL, MAMG, garden at Wisley, Surrey. Entomologist’s Monthly Magazine, 150,
and JH. 19–26.
 Armitage, S.A.O., Peuß, R. & Kurtz, J. (2015) Dscam and pancrustacean
 immune memory - a review of the evidence. Developmental and
Author contributions Comparative Immunology, 48, 315–323.
 Assenov, Y., Ramírez, F., Schelhorn, S.-E., Lengauer, T. & Albrecht,
PJL and MAMG conceived the study. PJL, MAMG, and OQ M. (2007) Computing topological parameters of biological networks.
designed the study. OQ collected the data with the support of Bioinformatics, 24, 282–284.
JWB, JD, and TW. OQ, MAMG, PJL, and JH analysed the Brenton-Rule, E.C., Dobelmann, J., Brown, B., Dvořák, L., Massiochi,
data. MAMG and PJL led the writing of the manuscript with M., Shortall, C.R. et al. (2018) The origins of global invasions of the
contributions from all authors. The authors declare that they German wasp (Vespula germanica) and its infection with two honey
have no conflicts of interest. bee viruses. Diversity and Distributions, 24, 1–1.
 Bromenshenk, J.J., Henderson, C.B., Wick, C.H., Stanford, M.F.,
 Zulich, A.W., Jabbour, R.E. et al. (2010) Iridovirus and microsporid-
 ian linked to honey bee colony decline. PLoS One, 5, e13181.
Supporting Information
 Brutscher, L.M., Daughenbaugh, K.F. & Flenniken, M.L. (2015) Antivi-
Additional supporting information may be found online in the ral defense mechanisms in honey bees. Current Opinion in Insect
Supporting Information section at the end of the article. Science, 10, 71–82.
 Caporaso, J.G., Kuczynski, J., Stombaugh, J., Bittinger, K., Bush-
Appendix S1. Supplementary methods showing sampling loca- man, F.D., Costello, E.K. et al. (2010) QIIME allows analysis of
tions and sample sizes, primers for microbial taxa, correlations high-throughput community sequencing data. Nature Methods, 7,
between nest productivity parameters, spatial autocorrelation 335–336.
analyses, a description of the cytoscape session files, and Colautti, R.I., Muirhead, J.R., Biswas, R.N. & MacIsaac, H.J. (2005)
the permutational anova on the putative immune gene Dscam Realized vs apparent reduction in enemies of the European starling.
 Biological Invasions, 7, 723–732.
expression data.
 Cornman, R.S., Tarpy, D.R., Chen, Y., Jeffreys, L., Lopez, D., Pettis, J.S.
Appendix S2. network.17052018.cys is the cytoscape session et al. (2012) Pathogen webs in collapsing honey bee colonies. PLoS
file with all six networks for visualisation. cytoscape should be One, 7, e43562.
installed, and then the file can be opened. Csardi, G. & Nepusz, T. (2006) The igraph software package for
 complex network research. InterJournal Complex Systems, 1695,
Appendix S3. network.16s.be.graphml is the graph file for the 1–9.
16S Belgium data. This can be opened with any graph analysis Dobelmann, J., Loope, K.J., Wilson-Rankin, E., Quinn, O., Baty, J.W.,
package (and can be imported into cytoscape for visualisation). Gruber, M.A.M. et al. (2017) Fitness in invasive social wasps: the role
 of variation in viral load, immune response and paternity in predicting
Appendix S4. network.16s.nz.graphml is the graph file for the nest size and reproductive output. Oikos, 126, 1208–1218.
16S New Zealand data. This can be opened with any graph Evans, J.D. & Schwarz, R.S. (2011) Bees brought to their knees:
analysis package (and can be imported into cytoscape for microbes affecting honey bee health. Trends in Microbiology, 19,
visualisation). 614–620.
 Evison, S.E.F., Roberts, K.E., Laurenson, L., Pietravalle, S., Hui, J.,
Appendix S5. network.18s.be.graphml is the graph file for Biesmeijer, J.C. et al. (2012) Pervasiveness of parasites in pollinators.
the 18S Belgium data. This can be opened with any graph PLoS One, 7, e30641.
analysis package (and can be imported in to cytoscape for Faillace, C.A., Lorusso, N.S. & Duffy, S. (2017) Overlooking the
visualisation). smallest matter: viruses impact biological invasions. Ecology Letters,
 20, 524–538.
Appendix S6. network.18s.nz.graphml is the graph file for the Flenniken, M.L. & Andino, R. (2013) Non-specific dsRNA-mediated
18S New Zealand data. This can be opened with any graph antiviral response in the honey bee. PLoS One, 8, e77263.
analysis package (and can be imported in to cytoscape for Foley, K., Fazio, G., Jensen, A.B. & Hughes, W.O.H. (2014) The
visualisation). distribution of Aspergillus spp. opportunistic parasites in hives and
 their pathogenicity to honey bees. Veterinary Microbiology, 169,
Appendix S7. network.array.be.graphml is the graph file for 203–210.
the Belgium array data. This can be opened with any graph Fürst, M.A., McMahon, D.P., Osborne, J.L., Paxton, R.J. & Brown,
analysis package (and can be imported in to cytoscape for M.J.F. (2014) Disease associations between honeybees and bumble-
visualisation). bees as a threat to wild pollinators. Nature, 506, 364–366.
 Glare, T.R., Harris, R.J. & Donovan, B.J. (1996) Aspergillus flavus as
Appendix S8. network.array.nz.graphml is the graph file for the a pathogen of wasps, Vespula spp., in New Zealand. New Zealand
New Zealand array data. This can be opened with any graph Journal of Zoology, 23, 339–344.

© 2019 The Royal Entomological Society, Ecological Entomology, 44, 512–523
522 Monica A. M. Gruber et al.

Godfrey, S.S. (2013) Networks and the ecology of parasite transmission: (ISSG) a Specialist Group of the Species Survival Commission (SSC)
 a framework for wildlife parasitology. International Journal for of the World Conservation Union. IUCN, Gland, Switzerland.
 Parasitology: Parasites and Wildlife, 2, 235–245. Masella, A.P., Bartram, A.K., Truszkowski, J.M., Brown, D.G. &
Gruber, M.A.M., Cooling, M., Baty, J.W., Buckley, K., Friedlander, Neufeld, J.D. (2012) PANDAseq: paired-end assembler for illumina
 A., Quinn, O. et al. (2017) Single-stranded RNA viruses infecting sequences. BMC Bioinformatics, 13, 31.
 the invasive Argentine ant, Linepithema humile. Scientific Reports, McFall-Ngai, M., Hadfield, M.G., Bosch, T.C.G., Carey, H.V.,
 7, 3304. Domazet-Lošo, T., Douglas, A.E. et al. (2013) Animals in a bacterial
Haas, B.J., Gevers, D., Earl, A.M., Feldgarden, M., Ward, D.V., Gian- world, a new imperative for the life sciences. Proceedings of the
 noukos, G. et al. (2011) Chimeric 16S rRNA sequence formation and National Academy of Sciences, 110, 3229–3236.
 detection in sanger and 454-pyrosequenced PCR amplicons. Genome Naug, D. & Camazine, S. (2002) The role of colony organization
 Research, 21, 494–504. on pathogen transmission in social insects. Journal of Theoretical
Harris, R.J. & Beggs, J.R. (1995) Variation in the quality of Vespula Biology, 215, 427–439.
 vulgaris (L.) queens (Hymenoptera: Vespidae) and its significance Ng, T.H., Chiang, Y.-A., Yeh, Y.-C. & Wang, H.-C. (2014) Review of
 in wasp population dynamics. New Zealand Journal of Zoology, 22, Dscam-mediated immunity in shrimp and other arthropods. Develop-
 131–142. mental and Comparative Immunology, 46, 129–138.
Hubert, J., Erban, T., Kamler, M., Kopecky, J., Nesvorna, M., Oksanen, J., Blanchet, F.G., Friendly, M., Kindt, R., Legendre, P. &
 Hejdankova, S. et al. (2015) Bacteria detected in the honeybee McGlinn, D., et al. (2016) vegan: Community Ecology Package. R
 parasitic mite Varroa destructor collected from beehive winter debris. package version 2.4-0. https://CRAN.R-project.org/package=vegan.
 Journal of Applied Microbiology, 119, 640–654. Oliveira, D.C.S.G., Hunter, W.B., Ng, J., Desjardins, C.A., Dang, P.M.
Illumina. (2013) 16S Metagenomic sequencing library preparation. & Werren, J.H. (2010) Data mining cDNAs reveals three new single
 [WWW document]. URL https://support.illumina.com/documents/ stranded RNA viruses in Nasonia (hymenoptera: Pteromalidae).
 documentation/chemistry_documentation/16s/16s-metagenomic- Insect Molecular Biology, 19, 99–107.
 library-prep-guide-15044223-b.pdf [accessed on 1 March 2019]. Parker, I.M., Saunders, M., Bontrager, M., Weitz, A.P., Hendricks, R.,
Jackson, S. (2016) corrr: Correlations in R. R package version 0.2.1. Magarey, R. et al. (2015) Phylogenetic structure and host abundance
 https://CRAN.R-project.org/package=corrr. drive disease pressure in communities. Nature, 520, 542–544.
Kaltenpoth, M. & Engl, T. (2014) Defensive microbial symbionts in Parker, J.D., Torchin, M.E., Hufbauer, R.A., Lemoine, N.P., Alba, C.,
 Hymenoptera. Functional Ecology, 28, 315–327. Blumenthal, D.M. et al. (2013) Do invasive species perform better in
Keane, R.M. & Crawley, M.J. (2002) Exotic plant invasions and their new ranges? Ecology, 94, 985–994.
 the enemy release hypothesis. Trends in Ecology & Evolution, 17, Prior, K.M., Powell, T.H.Q., Joseph, A.L. & Hellmann, J.J. (2014)
 164–170. Insights from community ecology into the role of enemy release in
Lester, P.J. & Beggs, J.R. (2019) Invasion success and management causing invasion success: the importance of native enemy effects.
 strategies for social Vespula wasps. Annual Review of Entomology, Biological Invasions, 17, 1283–1297.
 64, 51–71. Quast, C., Pruesse, E., Yilmaz, P., Gerken, J., Schweer, T., Yarza, P. et al.
Lester, P.J., Bosch, P.J., Gruber, M.A.M., Kapp, E.A., Peng, L., (2013) The SILVA ribosomal RNA gene database project: improved
 Brenton-Rule, E.C. et al. (2015) No evidence of enemy release in data processing and web-based tools. Nucleic Acids Research, 41,
 pathogen and microbial communities of common wasps (Vespula D590–D596.
 vulgaris) in their native and introduced range. PLoS One, 10, Quinn, O. (2017) Microbiota of an invasive wasp Vespula vulgaris and
 e0121358. Hymenopteran relatives. Unpublished PhD thesis, Victoria University
Lester, P.J., Gruber, M.A.M., Brenton-Rule, E.C., Archer, M.E., Corley, of Wellington.
 J.C., Dvorak, L. et al. (2014) Determining the origin of invasions and R Core Team (2018) R: a language and environment for statistical
 demonstrating a lack of enemy release from microsporidian pathogens computing. R Foundation for Statistical Computing, Vienna. https://
 in common wasps (Vespula vulgaris). Diversity and Distributions, 20, www.R-project.org/. https://www.R-project.org.
 964–974. Roberts, J.M.K., Anderson, D.L. & Durr, P.A. (2018) Metagenomic
Lester, P.J., Haywood, J., Archer, M.E. & Shortall, C.R. (2017a) The analysis of Varroa-free Australian honey bees (Apis mellifera) shows
 long-term population dynamics of common wasps in their native and a diverse Picornavirales virome. Journal of General Virology, 336,
 invaded range. Journal of Animal Ecology, 86, 337–347. 1304–1309.
Lester, P.J., Sebastien, A., Suarez, A.V., Barbieri, R.F. & Gruber, Rose, E.A.F., Harris, R.J. & Glare, T.R. (1999) Possible pathogens
 M.A.M. (2017b) Symbiotic bacterial communities in ants are modi- of social wasps (Hymenoptera: Vespidae) and their potential as
 fied by invasion pathway bottlenecks and alter host behavior. Ecology, biological control agents. New Zealand Journal of Zoology, 26,
 98, 861–874. 179–190.
Levitt, A.L., Singh, R., Cox-Foster, D.L., Rajotte, E., Hoover, K., Rueden, C.T., Schindelin, J., Hiner, M.C., DeZonia, B.E., Walter, A.E.,
 Ostiguy, N. et al. (2013) Cross-species transmission of honey bee Arena, E.T. et al. (2017) ImageJ2: ImageJ for the next generation of
 viruses in associated arthropods. Virus Research, 176, 232–240. scientific image data. BMC Bioinformatics, 18, 529.
Loope, K.J., Baty, J.W., Lester, P.J. & Wilson Rankin, E.E. (2019) Schmucker, D., Clemens, J.C., Shu, H., Worby, C.A., Xiao, J., Muda,
 Pathogen shifts in a honeybee predator following the arrival of M. et al. (2000) Drosophila Dscam is an axon guidance receptor
 the Varroa mite. Proceedings of the Royal Society Series B, 286, exhibiting extraordinary molecular diversity. Cell, 101, 671–684.
 20182499. Schwarz, R.S. & Evans, J.D. (2013) Single and mixed-species try-
Lord, W.D., Nicolson, D.A. & Roth, R.R. (1977) Foraging behavior panosome and microsporidia infections elicit distinct, ephemeral cel-
 and colony drift in Vespula maculifrons (Buysson) (Hymenoptera: lular and humoral immune responses in honey bees. Developmental
 Vespidae). Journal of the New York Entomological Society, 85, 186. and Comparative Immunology, 40, 300–310.
Lowe, S., Browne, M., Boudjelas, S. & De Poorter, M. (2000) 100 of Schwarz, R.S., Huang, Q. & Evans, J.D. (2015) Hologenome theory and
 the World’s Worst Invasive Alien Species. A Selection from the Global the honey bee pathosphere. Current Opinion in Insect Science, 10,
 Invasive Species Database. The Invasive Species Specialist Group 1–7.

 © 2019 The Royal Entomological Society, Ecological Entomology, 44, 512–523
Invasive wasp fitness and networks 523

Shannon, P., Markiel, A., Ozier, O., Baliga, N.S., Wang, J.T., Ramage, Sumner, S., Lucas, E., Barker, J. & Isaac, N. (2007) Radio-tagging
 D. et al. (2003) Cytoscape: a software environment for integrated technology reveals extreme nest-drifting behavior in a eusocial insect.
 models of biomolecular interaction networks. Genome Research, 13, Current Biology, 17, 140–145.
 2498–2504. Thompson, L.R., Sanders, J.G., McDonald, D., Amir, A., Ladau, J.,
Shapira, M. (2016) Gut microbiotas and host evolution: scaling up Locey, K.J. et al. (2017) A communal catalogue reveals Earth’s
 symbiosis. Trends in Ecology & Evolution, 31, 539–549. multiscale microbial diversity. Nature, 551, 457–463.
Singh, R., Levitt, A.L., Rajotte, E., Holmes, E.C., Ostiguy, N., Torchin, M.E., Lafferty, K.D., Dobson, A.P., McKenzie, V.J. & Kuris,
 vanEngelsdorp, D. et al. (2010) RNA viruses in hymenopteran A.M. (2003) Introduced species and their missing parasites. Nature,
 pollinators: evidence of inter-taxa virus transmission via pollen and 421, 628–630.
 potential impact on non-Apis hymenopteran species. PLoS One, 5, Wheeler, B. & Torchiano, M. (2016) lmPerm: Permutation Tests for
 e14357. Linear Models. R package version 2.1.0. http://CRAN.R-project.org/
Slothouber Galbreath, J.G.M., Smith, J.E., Becnel, J.J., Butlin, R.K. & package=lmPerm.
 Dunn, A.M. (2009) Reduction in post-invasion genetic diversity in White, L.A., Forester, J.D. & Craft, M.E. (2017) Dynamic, spatial mod-
 Crangonyx pseudogracilis (Amphipoda: Crustacea): a genetic bottle- els of parasite transmission in wildlife: their structure, applications
 neck or the work of hitchhiking vertically transmitted microparasites? and remaining challenges. Journal of Animal Ecology, 87, 559–580.
 Biological Invasions, 12, 191–209. Wickham, H. (2017) tidyverse: Easily Install and Load “Tidy-
Spradbery, J.P. (1971) Seasonal changes in the population structure of verse.” R package version 1.2.1. http://CRAN.R-project.org/
 wasp colonies (Hymenoptera: Vespidae). Journal of Animal Ecology, package=tidyverse.
 40, 501–523.
Spradbery, J.P. (1973) Wasps: An Account of the Biology and Natural Accepted 25 January 2019
 History of Solitary and Social Wasps. University of Washington Press, First published online 9 March 2019
 Seattle, Washington. Associate Editor: Sheena Cotter

© 2019 The Royal Entomological Society, Ecological Entomology, 44, 512–523
You can also read