Flood of 2018: Keeping the City "Business as Usual" in a 15-Day Flood
←
→
Page content transcription
If your browser does not render page correctly, please read the page content below
Flood of 2018: Keeping the City
“Business as Usual” in a 15-Day Flood
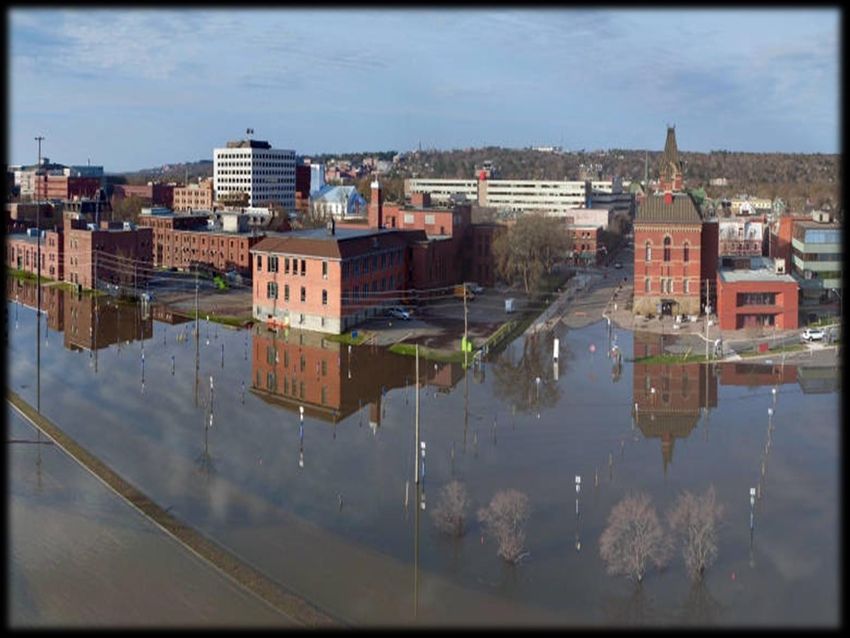
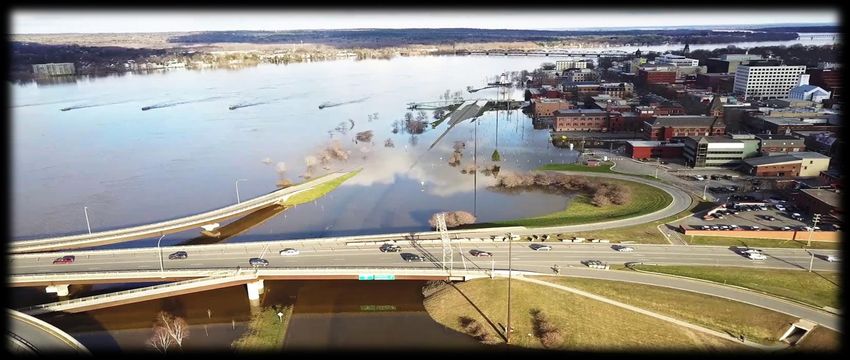
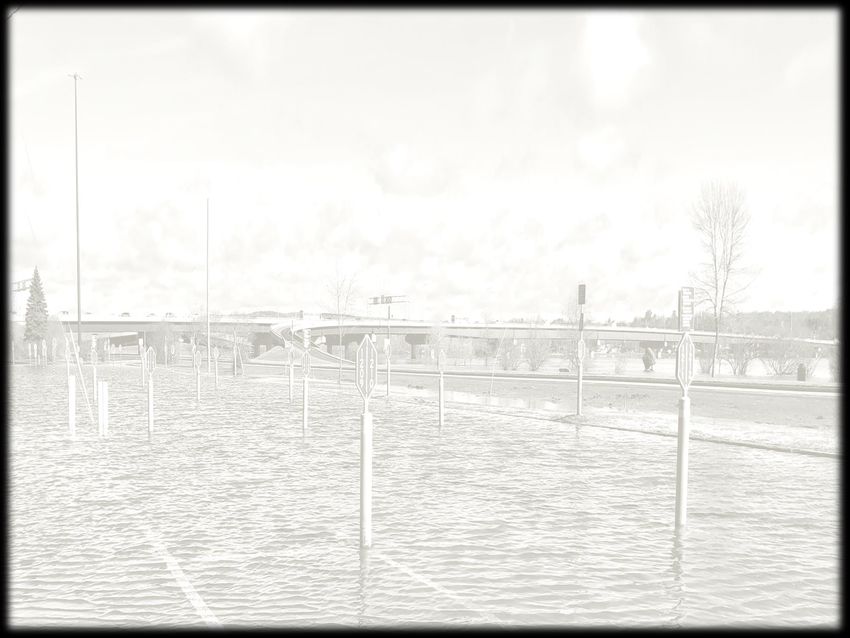
Fredericton 2018 Flood
•   City built at the confluence of two rivers
•   CBD/major employers located Downtown
•   Equal population either side of river
•   Daily commuting
•   Low lying parking /roads
Fredericton 2018 Flood
• Fluvial (Riverine) flooding
• Factors that attribute to flooding
   – Upper basin snow pack/water equivalency
   – Precipitation
   – Temperature fluctuations
   – Lower basin storage
   – Saint John Reversing Falls / tides
• Variability in flooding
1973 Water Elevation
1973 & 2008
Water Elevations Comparison
1973, 2008, 2018
Water Elevation Comparison

Number of Homes, Structures
            & Businesses Impacted
• At the 8 m mark approximately 660 structures were
affected in Fredericton.

• 184 residents registered for Disaster Financial Relief
(as of May 15th).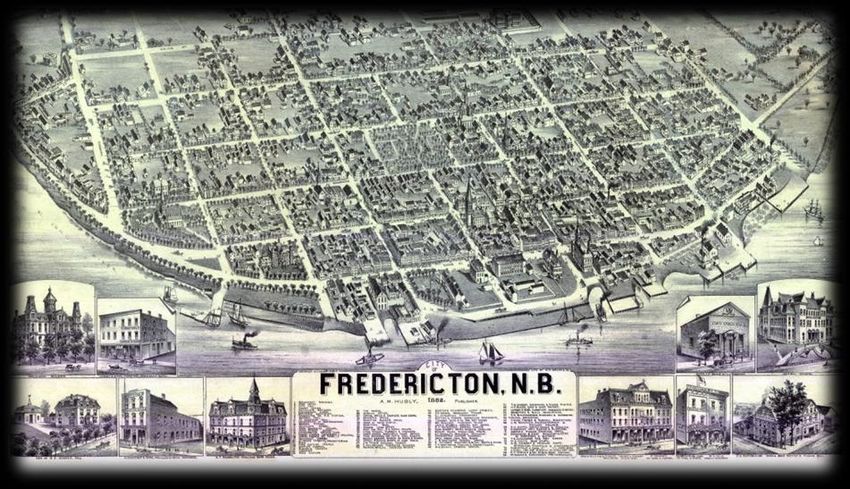
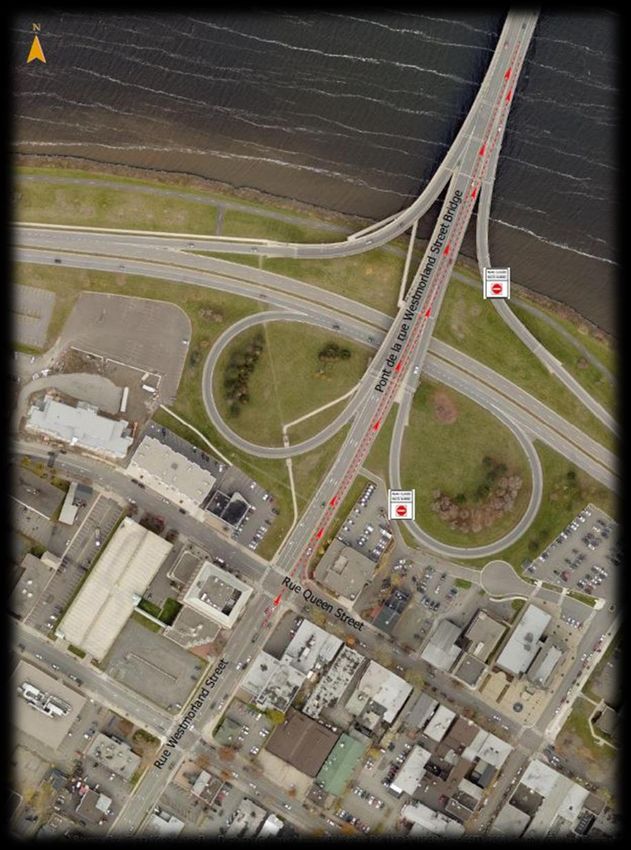
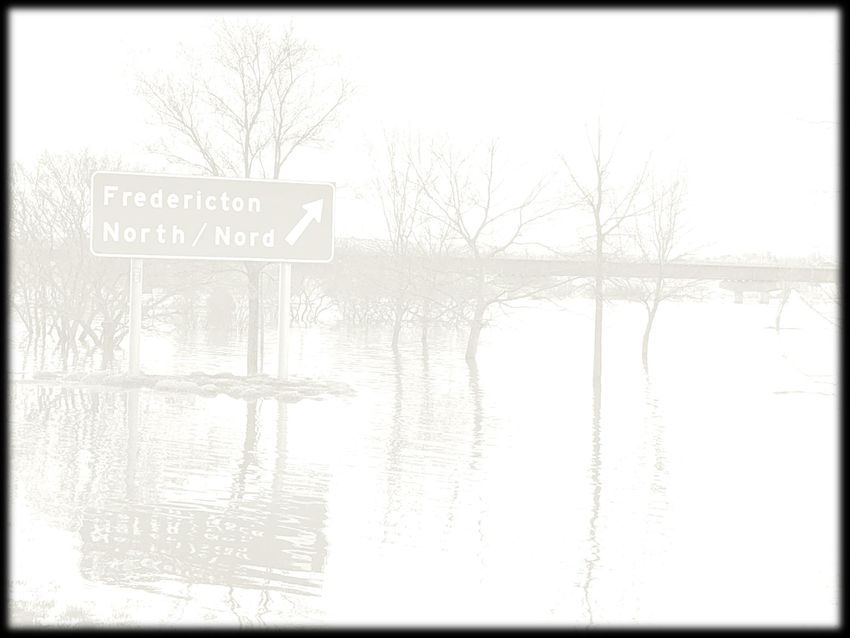
Impact on the Downtown Core
•Bridge ramps needed to be closed affecting 78,000 daily
commuters who travel into or through the downtown.
•Over 800 parking spots were under water.
•Over 50 streets were closed, many in the downtown.

• On Day 2 we realized that we may be faced with a
long duration flood.

• We needed to find a way to keep downtown
Fredericton offices and businesses open and traffic
flowing to unaffected areas. All with a significant
deficit in our transportation network.
• We put together an alternate mode of
transportation strategy. Involving Engineering &
Operations, Transit, Parking Services and Roads and
Streets.

How did we keep the City open in a 15 Day Flood

• Offered City wide free transit.
•Offered free Park & Ride shuttles from 4 locations into
the downtown.
•Park & Walk locations set up throughout the City.
•Collaborated with Provincial and Federal Governments to
offer employees flexible working hours, working from
home, etc…
•Reconfigured traffic
pattern on bridge to
help flow.

•Encouraged residents
to walk, bike and
carpool.

•Rewarded residents
who did use alternate
transportation.
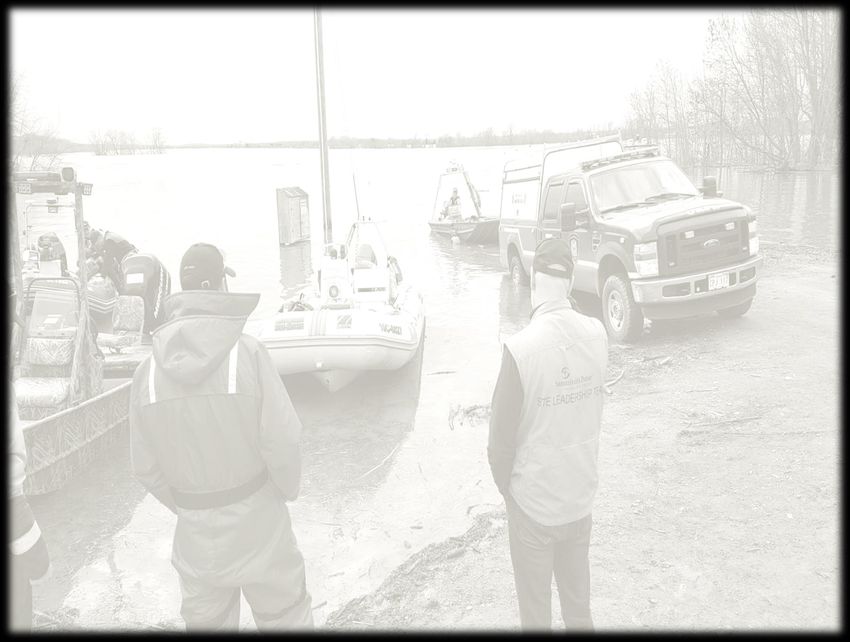
Fredericton EMO Preparedness

•Monthly Meetings

•20 – 25 attendees internal &
external partners

•Builds good working
relationships

•Emergency Response Plan
reviewed & exercised
EMO Partners

•   Canadian Red Cross             •   NB Social Development
•   Salvation Army                 •   Fredericton Airport
•   Meals on Wheels                •   Village of New Maryland
•   FARC                           •   Town of Oromocto
•   York Sunbury Search & Rescue   •   School District (Anglo West)
•   CBI Home Health                •   Enbridge Gas
•   Horizon Health                 •   Roadway Operations (Internal)
•   Ambulance NB                   •   Water & Sewer (Internal)
•   Bell Aliant                    •   Building Services (Internal)
•   NB Power                       •   Transit (Internal)
•   York Manor                     •   IT (Internal)
•   NB Health                      •   Fredericton Police
•   UNB                            •   Fredericton Fire
•   NBEMO                          •   Communications/911 (Internal)
•   Samaritan’s Purse
COMMUNICATIONS
Communications has changed in the last decade.
Residents want information fast and at their fingertips.
Social media allowed us to:
•Reach our residents in real time
•Ensure there was no need to panic
•Help move residents in and out of the downtown core
with ease.
•Minimize non emergency calls to Dispatch Services.
Flood Related Facebook Statistics
• 156 original posts made regarding the flood, In
comparison 412 total posts were made in 2017.

• Over the 15 days of
the flood the number of
people following our
page increased by 22%.

•Some of our
Facebook posts had a
reach of over
100,000.
Facebook Live
•Facebook Live was used daily to communicate our
message to residents. It allowed them to hear
information they needed to know, fast and efficiently.

 •Facebook Live video’s
 were viewed 70,800
 times for over 49,200
 minutes in the first 5
 days of the flood.
• Our Facebook and Twitter pages were key
 communication tools for our residents. Our Facebook
 page had 36,000 engagements (comments and shares).
 In all of 2017 we had a total of 24,000 engagements.

Reaction of residents in comments on Facebook & Twitter
       Neutral Comments: 827   Negative: 283   Positive: 484
Web Cam Usage
Web Cam Usage
Web cams allowed residents to:
• View water levels without coming too close to
Over the
the fast moving water.
• Allowed residents to check traffic on the bridge.
• Allowed them to see that downtown offices &
businesses were open.
Webcam 2017 2018
River View 3,065 44,489
Westmorland Street 2,248 44,186
Bridge
City Hall & Downtown 2,107 35,922
Street View
Officer Square 1,942 32,583
(off line mid week due to
flood)What Worked Well • No fatalities or injuries to residents or staff during this prolonged event. • Flow of traffic on the Westmorland Street Bridge (removal of concrete barriers to ease traffic flow) • Relationships with external partners. • Traditional media i.e.. Radio and television • Use of social media • Web Cams
•Good internal working
relationships between all
departments.
•Ability to reduce calls to
dispatch services.
•Positive relationship with our
elected officials.
•Ability to keep businesses
open in downtown core.
Past Adaptive Strategies

                    Operational Flood Map

• Operational flood maps
• Separated sewer systems
• “Disconnected” Downtown
• Key infrastructure and links raised • Minimum elevations for habitable space. • Storm water valves • Flood marker
Future Adaptive Strategies

• Infrastructure renewal/asset management:
   •Add resilience to key infrastructure and links
   •Storm water valves
• Increase knowledge about:
   •River flooding mechanisms
   •Climate change impacts (Sea level rise)
• Policy Development
   •Business continuity planning
   •Open space/flood plain management
Questions
You can also read


