Fluxes, patterns and sources of phosphorus deposition in an urban-rural transition region in Southwest China
←
→
Page content transcription
If your browser does not render page correctly, please read the page content below
Research article
Atmos. Chem. Phys., 22, 14813–14823, 2022
https://doi.org/10.5194/acp-22-14813-2022
© Author(s) 2022. This work is distributed under
the Creative Commons Attribution 4.0 License.

        Fluxes, patterns and sources of phosphorus deposition
        in an urban–rural transition region in Southwest China
           Yuanyuan Chen1 , Jiang Liu2 , Jiangyou Ran1 , Rong Huang1 , Chunlong Zhang1 , Xuesong Gao1 ,
       Wei Zhou1 , Ting Lan1 , Dinghua Ou1 , Yan He3 , Yalan Xiong1 , Ling Luo3 , Lu Wang4 , and Ouping Deng1
                    1 Collegeof Resources, Sichuan Agricultural University, Chengdu, 611130, P.R. China
                      2 StateKey Laboratory of Environmental Geochemistry, Institute of Geochemistry,
                                 Chinese Academy of Sciences, Guiyang, 550081, P.R. China
             3 College of Environmental Sciences, Sichuan Agricultural University, Chengdu, 611130, P.R. China
                              4 Chongzhou Meteorological Bureau, Chengdu, 611230, P.R. China

                                   Correspondence: Ouping Deng (ouping@sicau.edu.cn)

                                      Received: 1 June 2022 – Discussion started: 7 July 2022
                      Revised: 31 October 2022 – Accepted: 3 November 2022 – Published: 22 November 2022

       Abstract. Understanding the patterns of atmospheric phosphorus (P) deposition is essential for assessing the
       global P biogeochemical cycle. Atmospheric P is an essential source of P in agricultural activities as well as eu-
       trophication in waters; however, the information on P deposition is paid relatively less attention, especially in the
       anthropogenic influencing region. Therefore, this study chose a typical urban–rural transition as a representative
       case to monitor the dry and wet P depositions for 2 years. The results showed that the fluxes of atmospheric
       total P deposition ranged from 0.50 to 1.06 kg P hm−2 yr−1 , and the primary form was atmospheric dry P depo-
       sition (76.1 %, 0.76–0.84 kg P hm−2 yr−1 ). Moreover, it was found that the monthly variations of P deposition
       were strongly correlated with meteorological factors, including precipitation, temperature and relative humidity.
       However, the fluxes of dry P deposition and total P deposition were more affected by land use, which increased
       with the agro-facility, town and paddy field areas but decreased with the forest and country road areas. These
       findings suggested that dry P deposition was the primary form of total P deposition, and P deposition could
       be affected both by meteorological factors and land-use types. Thus, proper management of land use may help
       mitigate the pollution caused by P deposition.

1   Introduction                                                    of land area, in which P input, such as deposition, will signif-
                                                                    icantly increase the productivity of plants (Elser et al., 2007;
                                                                    Du et al., 2020; Hou et al., 2020). Hence, estimating the de-
Phosphorus (P) is generally considered the essential nutri-         position characteristics of atmospheric P is important to un-
ent and growth-limiting element in terrestrial and aquatic          derstand the biogeochemical process of P and could provide
ecosystems (Vitousek et al., 2010; Peñuelas et al., 2013).          information on water nutrient pollution control.
Over the past few decades, with the increasing application of          Several research efforts have quantified P deposition fluxes
P fertilizers and fossil fuel combustion, substantial anthro-       from the field scale to the global scale, and the results showed
pogenic P has been emitted into the atmosphere (Wang et al.,        large uncertainty. For instance, a recent meta-analysis of 394
2015; Du et al., 2016). Moreover, the deposition of atmo-           sites from a global scale covering the period 1959–2020 ob-
spheric P on terrestrial surfaces overfertilizes some natural       served that the average value of atmospheric total P deposi-
and seminatural ecosystems (Camarero and Catalan, 2012;             tion was 0.58 ± 0.72 kg hm−2 yr−1 (Pan et al., 2021). It has
Cleveland et al., 2013; Wang et al., 2015), especially aquatic      been reported that total P deposition fluxes range from 0.002
ecosystems (Pollman et al., 2002; Tong et al., 2017). How-          to 2.53 kg P hm−2 yr−1 at 41 sites across China (Zhu et al.,
ever, P deficiency was also found in a large proportion (43 %)

Published by Copernicus Publications on behalf of the European Geosciences Union.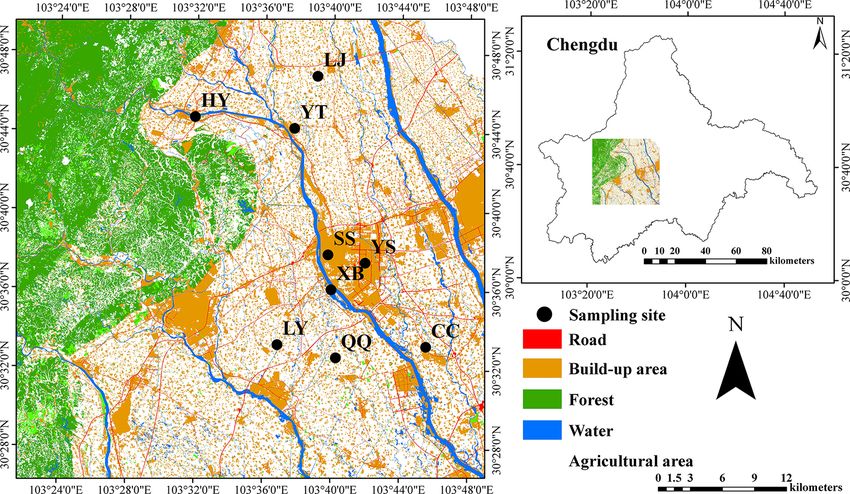
14814                                                  Y. Chen et al.: Fluxes, patterns and sources of phosphorus deposition

2016). In addition, the overall average fluxes of total P de-      man beings. The patterns and sources of P deposition are
position during 2008–2018 at four sites located in Southwest       more complex here than in natural ecosystems. However,
China ranged from 0.12 to 4.15 kg P hm−2 yr−1 (Song et al.,        P deposition studies are limited here. Therefore, a typical
2022). Previous studies have identified that P deposition rates    urban–rural transition region in southwestern China was se-
vary at local scales. Therefore, P deposition exists with tem-     lected, and 2 years’ monitoring of wet and dry P depositions
poral and spatial variations at a regional scale, and measure-     in this region was conducted. The aims of this study are (1) to
ments across different areas are needed to better understand       determine the spatial and temporal characteristics of P depo-
the role of P deposition in the global P cycle.                    sition fluxes in urban–rural transition areas, (2) to identify
   Different land-use types and the resulting landscape per-       the factors affecting P deposition fluxes in urban–rural tran-
turbations largely determine P deposition (Peñuelas et al.,        sition areas and (3) to reveal the “source–sink” relationship
2011). For instance, the application of P fertilizer could be      between P deposition and local land use. The results of this
the main source of higher P deposition in agricultural ar-         study are important for understanding the process of regional
eas (Winter et al., 2002; Anderson and Downing, 2006). At          P deposition and regional P management with source–sink
rural sites, biogenic sources are the primary contributor to       land use.
atmospheric P deposition, whereas anthropogenic sources
(such as the application of P fertilizer) have a larger ef-
                                                                   2     Materials and methods
fect on atmospheric P deposition at suburban sites (Chiwa,
2020). Additionally, a previous study revealed that sites          2.1    Sampling sites
characterized by land-use types, such as areas under inten-
sive agricultural management, contributed more P deposition        This study was conducted from March 2015 to Febru-
(3.22 kg P hm−2 yr−1 ), which was higher than in rural, ur-        ary 2017 at nine sites that were chosen to explore atmo-
ban and forest areas (0.20–1.07 kg P hm−2 yr−1 ; Song et al.,      spheric P deposition, spanning a transect covering urban ar-
2022). In addition, P deposition in forested sites significantly   eas (UAs), intensive agricultural areas (IAAs) and rural ar-
increased with decreasing distance to the nearest large cities     eas (RAs) in the southwestern Chengdu Plain (Fig. 1, Ta-
(Du et al., 2016). Additionally, field studies have observed       ble S1, Deng et al., 2019). Urban areas, including Shangnan
that meteorological factors, including precipitation and tem-      Street (SS), Yongkang Street (YS) and Xihe Bridge (XB)
perature, could influence temporal variations of atmospheric       sites, are located in Chongzhou, which has 74.4 km2 of ur-
P deposition (Tipping et al., 2014; Zhu et al., 2016; Chiwa        ban land and 130 000 permanent dwellers. Intensive agricul-
et al., 2020). There is still great uncertainty about how these    tural areas, including the Caichang (CC), Liaoyuan (LY) and
influencing factors affect the variation in P deposition. Fur-     Qiquan (QQ) sites, covered 1.8 km2 of the agro-facility land-
ther comprehensive identification of the variation drivers of      use type, which accounted for approximately 69.9 % of the
atmospheric P deposition on a regional scale is needed.            total in nine sites. Rural areas, including Yuantong (YT), Li-
   Atmospheric P mainly occurs in the form of aerosols             ujie (LJ) and Huaiyuan (HY) sites, covered 13.59 km2 of for-
rather than in a stable gaseous phase (Mahowald et al., 2008).     est, which accounted for approximately 96.2 % of the total in
Hence, larger and heavier P-containing aerosols are mainly         nine sites. The total area of one land-use type was calculated
contributed by local sources because they can only be trans-       by adding the values in each column, as shown in Table 1,
ported over short distances, while fine dust can originate         where each column indicates the area occupied by each land-
from thousands of kilometers (Tipping et al., 2014). Further,      use type in nine sites. More details about the study sites are
P-containing aerosols originating in different ways are likely     shown in Table 1. The climate at the sites is subtropical mon-
to be deposited on the terrestrial surface in distinct ways. At-   soon humid, with monthly precipitation, ambient tempera-
mospheric P-containing aerosols that were scavenged in and         ture, relative humidity and wind speed at nine sites varying
below clouds by precipitation and deposited on the terrestrial     from 0.6 to 238.63 mm, 5.83 to 27. ◦ C, 66.0 % to 89.3 % and
surface were defined as wet deposition (Yang et al., 2012).        0.5 to 1.80 m s−1 , respectively. The meteorological data used
These were removed and deposited onto the terrestrial sur-         in this study are from the Chongzhou Meteorological Bureau,
face by the adsorption of water droplets under the action of       Sichuan Province, China.
gravity, which was defined as dry deposition (Grantz et al.,
2003). However, most reported measurements are based on            2.2    Sample collection and analysis
bulk deposition, which includes wet deposition plus a frac-
tion of dry deposition. Meanwhile, the measurements of dry         Both dry deposition (from gases, aerosols and particles) and
deposition are quite sparse. Hence, it is essential to collect     wet deposition (from rain and snow) of P were monitored.
wet deposition and dry deposition separately, which can en-        In addition, three parallel collectors were used at each site to
rich the P database and clarify the global P deposition pat-       collect atmospheric wet and dry deposition to ensure three
tern.                                                              replicate data, respectively. Dry deposition was determined
   Urban–rural transition regions are formed commonly in           by the aqueous surface method (Anderson and Downing,
the process of urbanization and are deeply influenced by hu-       2006). Briefly, three precleaned glass cylinders (inner diam-

Atmos. Chem. Phys., 22, 14813–14823, 2022                                          https://doi.org/10.5194/acp-22-14813-2022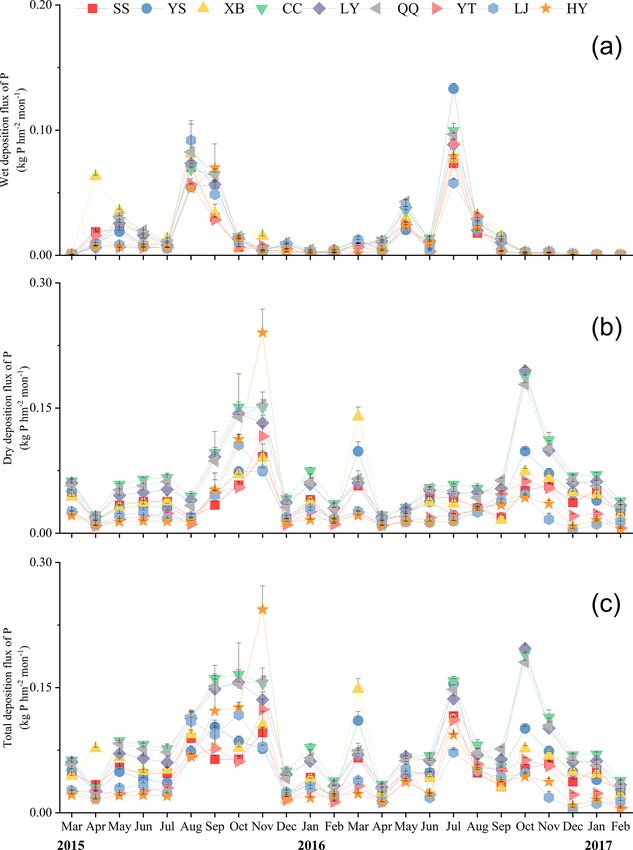
Y. Chen et al.: Fluxes, patterns and sources of phosphorus deposition                                                                                            14815

Table 1. The types of land use and areas were divided as follows: agricultural area (paddy field, dry land, yard and agro-facility area), built-up
area (urban, town and village), road (highway and country road), water and forest.

  Classification      Site      Paddy         Dry     Yard      Agro-facility       Urban       Town       Village      Highway        Country       Water      Forest
                      code       field       land                       area                                                              road
  UA                  SS         31.12       3.28          0               0.08      25.13       1.04         8.92           2.57          0.27        5.15       0.05
                      YS         27.71       2.58          0               0.08      27.54       2.79         7.75           3.43          0.23        5.34       0.15
                      XB         34.20       2.74          0               0.22      21.68       1.51         8.65           2.62          0.23        5.55       0.02
  IAA                 LY         52.49       4.25      0.06                0.49           0      5.42        11.44           1.36          0.16         1.3       0.07
                      QQ         55.00       4.13      0.49                0.72           0      1.75        12.04           0.96          0.03        2.85       0.07
                      CC         41.43       5.98      0.16                 0.6           0      8.00        11.60           2.00          0.04        6.86       0.18
  RA                  LJ         41.04      20.51      0.11                 0.2           0      2.16        11.90           0.22          0.52        1.26       0.13
                      YT         51.14       7.01         0                0.09           0      2.42        11.46           0.84          0.01        3.86       0.33
                      HY         38.88       5.61      1.57                0.11           0      3.20        10.46           1.20          0.21        2.75      13.13
SS, Shangnan Street; YS, Yuantong Street; XB, Xihe Bridge; CC, Caichang; LY, Liaoyuan; QQ, Qiquan; YT, Yuantong; LJ, Liujie; HY, Huaiyuan. UA, urban area; IAA, intensive
agricultural area; RA, rural area.

Figure 1. Location of the sampling sites. SS, Shangnan Street; YS, Yongkang Street; XB, Xihe Bridge; CC, Caichang; LY, Liaoyuan; QQ,
Qiquan; YT, Yuantong; LJ, Liujie; HY, Huaiyuan (Deng et al., 2019).

eter × height of 10.5 cm × 14.5 cm) were used as dry collec-                            were collected in precleaned glass bottles with lids at 08:00
tors at each site. All the collectors were placed 1.2 m above                           during these 5 d periods. In the case of rainfall, the lid on top
the ground with no obstacles and tall buildings around each                             of the collector was manually closed to eliminate the effect
site. A stainless-steel net (pore size, 0.02 × 0.02 m2 ) was                            of wet deposition. At the end of sampling every month, sam-
used to avoid any disturbance and pollution from birds and                              ples collected during the 5 d were mixed and transported to
crops. The cylinder was filled with ultrapure water and exam-                           the laboratory to determine total P (TP) concentrations on the
ined if a refill was needed on a 4 or 6 h basis (4 h in summer                          same day.
and 6 h in other seasons) to keep the water depth at a level                               A total of 5 consecutive days per month with a relative
of about 10 cm (Wang et al., 2016). Dry-deposition sampling                             frequency of rainfall events were selected for wet-deposition
was conducted for 5 consecutive days at the end of the month,                           collection, based on weather forecasts every month. Wet de-
avoiding continuous rainfall as much as possible. Samples                               position was collected at the end of each rainfall event (Ola-

https://doi.org/10.5194/acp-22-14813-2022                                                                Atmos. Chem. Phys., 22, 14813–14823, 2022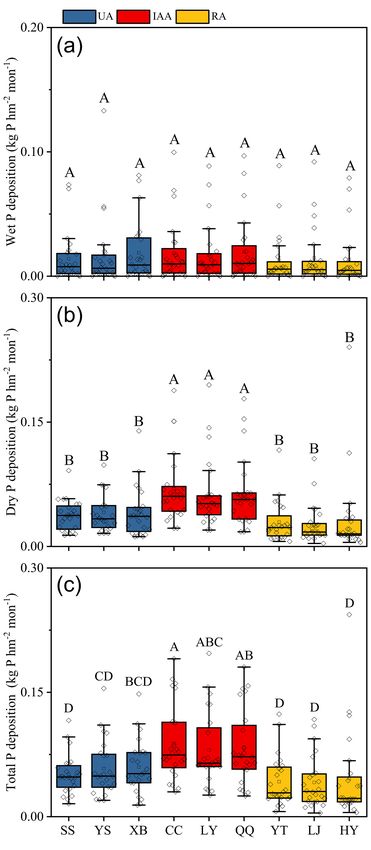
14816                                                   Y. Chen et al.: Fluxes, patterns and sources of phosphorus deposition

dosu et al., 2017). If the volume of samples (100 mL) col-          Province. Land-use types were divided as follows: agricul-
lected in one rainfall event was too little, samples from con-      tural area (paddy field, dry farm, yard and agro-facility area),
tinuous rainfall events were pooled as one mixed sample. The        built-up area (urban, town and village), road (highway and
duration (min) and rainfall capacity (mm) were recorded for         country road), forest and water (Fig. 1). Taking the sampling
each rainfall event. Rainfall samples collected monthly were        point as the center and extracting the land-use type area with
mixed and transferred to the laboratory to determine total P        a radius of 5 km from the center, ArcGIS 10.6 was used. Cor-
(TP) concentrations on the same day.                                relation analysis was used to study the covariation between
   During the sampling period, a total of 1026 deposition           the fluxes of atmospheric total, dry and wet P deposition and
samples were collected, with half of the dry-deposition and         land-use areas.
half of the wet-deposition samples. Changes in sample vol-
ume and air exposure were minimized. Moreover, river water          2.5    Statistical analyses
samples from the Xihe River (30◦ 360 0200 N, 103◦ 390 5700 E;
XB) were collected to measure the P concentration. The to-          One-way analysis of variance (ANOVA) was performed
tal P in the collected samples was digested using potassium         to determine the spatial and temporal variation among the
persulfate at 120◦ to convert TP to PO3− 4 and then analyzed        three areas. Statistically significant differences were set at
PO3−4  using ammonium     molybdate using    an ultraviolet spec-   P
Y. Chen et al.: Fluxes, patterns and sources of phosphorus deposition 14817
were observed to have significant spatial variations across
the study urban–rural transition (Fig. 5b, c) (P YT, LJ and HY (0.50–
0.55 kg P hm−2 yr−1 ).
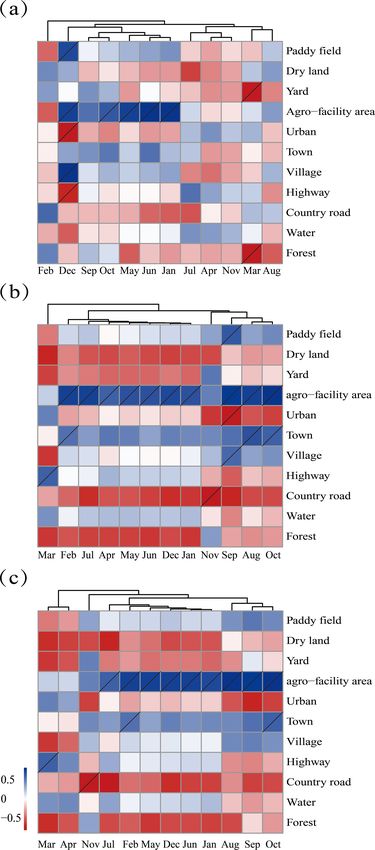
3.4 Relationship between land-use types and P
deposition
To better understand the potential sources of P deposition,
the correlations between monthly fluxes of P deposition and
areas of land-use types were analyzed (Fig. 6). The monthly
atmospheric wet P deposition fluxes were significantly pos-
itively correlated with the agro-facility areas in the five
months (P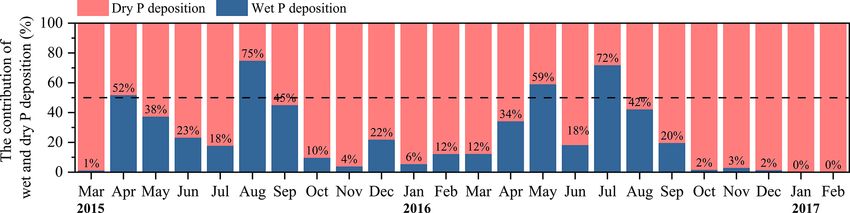
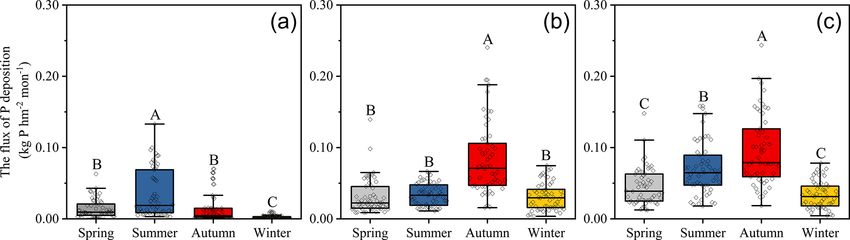
14818                                                      Y. Chen et al.: Fluxes, patterns and sources of phosphorus deposition

Figure 3. The contribution ratio of wet P deposition and dry P deposition to total P deposition. The middle-dashed line indicates each
contributes 50 %. The value represents the monthly contribution rate of wet P deposition to total P deposition.

Figure 4. Monthly phosphorus flux of wet (a), dry (b) and total (c) deposition in four seasons. Different capital letters indicate that the
differences among seasons are significant (one-way ANOVA, p
Y. Chen et al.: Fluxes, patterns and sources of phosphorus deposition                                                                 14819

Figure 5. Average monthly phosphorus wet (a), dry (b) and total
(c) deposition fluxes at nine sites. Each box contains 24 months
of P deposition fluxes. Different capital letters suggest that the dif-
ference in the fluxes among the nine sites is significant (p
14820                                                   Y. Chen et al.: Fluxes, patterns and sources of phosphorus deposition

such as large-scale livestock and poultry breeding. These lo-       study area cannot be ignored. More attention needs to be paid
cal P aerosols were deposited as local resources, causing a         to effectively managing P inputs and cycles.
higher value of dry P deposition. Hence, to further clarify the
influencing factors from multiple land-use types on P depo-         4.4   Relationship between land use and phosphorus
sition, the analysis of the correlation between land-use types            deposition
and P deposition was carried out as follows in this study.
   Moreover, the annual total P deposition fluxes in CC, LY         Lands show a tradeoff effect on atmospheric P deposition. On
and QQ (0.97–1.06 kg hm−2 yr−1 ) were significantly higher          the one hand, agro-facility areas, towns and highways were
than those in YT, LJ, and HY (0.50–0.55 kg hm−2 yr−1 )              positively correlated with P deposition, suggesting that those
(Fig. 4c; P
Y. Chen et al.: Fluxes, patterns and sources of phosphorus deposition                                                       14821

sources (Tipping et al., 2014). A previous study reported that    ambient concentration and was significantly higher in au-
P deposition increased after P fertilizer application (Gao et     tumn (P
14822                                                        Y. Chen et al.: Fluxes, patterns and sources of phosphorus deposition

Review statement. This paper was edited by Leiming Zhang and             Grantz, D. A., Garner, J. H. B., and Johnson, D. W.: Ecolog-
reviewed by three anonymous referees.                                      ical effects of particulate matter, Environ. Int., 29, 213–239,
                                                                           https://doi.org/10.1016/S0160-4120(02)00181-2, 2003.
                                                                         Gross, A., Turner, B. L., Goren, T., Berry, A., and Angert,
                                                                           A.: Tracing the sources of atmospheric phosphorus depo-
                                                                           sition to a tropical rain forest in Panama using stable
References                                                                 oxygen isotopes, Environ. Sci. Technol., 50, 1147–1156,
                                                                           https://doi.org/10.1021/acs.est.5b04936, 2016.
Anderson, K. A. and Downing, J. A.: Dry and wet atmo-                    Helliwell, R. C., Soulsby, C., Ferrier, R. C., Jenkins, A., and Har-
   spheric deposition of nitrogen, phosphorus, and silicon in              riman, R.: Influence of snow on the hydrology and hydrochem-
   an agricultural region, Water Air Soil Pollut., 176, 351–374,           istry of the Allt a’ Mharcaidh, Cairngorm mountains, Scotland,
   https://doi.org/10.1016/j.envpol.2022.119298, 2006.                     Sci. Total Environ., 217, 59–70, https://doi.org/10.1016/S0048-
Camarero, L. and Catalan, J.: Atmospheric phosphorus depo-                 9697(98)00165-X, 1998.
   sition may cause lakes to revert from phosphorus limita-              Herut, B., Zohary, T., Krom, M. D., Mantoura, R. F. C.,
   tion back to nitrogen limitation, Nat. Commun., 3, 1118,                Pitta, P., Psarra, S., Rassoulzadegan, F., Tanaka, T., and
   https://doi.org/10.1038/ncomms2125, 2012.                               Thingstad, T. F.: Response of east Mediterranean surface wa-
Chiwa, M.: Ten-year determination of atmospheric phosphorus de-            ter to Saharan dust: On-board microcosm experiment and
   position at three forested sites in Japan, Atmos. Environ., 223,        field observations, Deep-Sea Res. Pt. II, 52, 3024–3040,
   117247, https://doi.org/10.1016/j.atmosenv.2019.117247, 2020.           https://doi.org/10.1016/j.dsr2.2005.09.003, 2005.
Cleveland, C. C., Houlton, B. Z., Smith, W. K., Marklein, A. R.,         Hochmuth, G., Rao, M., and Hanlon, A. E.: The four Rs of fertilizer
   Reed, S. C., Parton, W., Del Grosso, S. J., and Running, S.             management, UF/IFAS Extension, 1–4, https://edis.ifas.ufl.edu/
   W.: Patterns of new versus recycled primary production in the           publication/SS624, last access: 4 November 2022.
   terrestrial biosphere, P. Natl. Acad. Sci., 110, 12733–12737,         Hou, E., Luo, Y., Kuang, Y., Chen, C., Lu, X., Jiang, L.,
   https://doi.org/10.1073/pnas.1302768110, 2013.                          Luo, X., and Wen, D.: Global meta-analysis shows perva-
Das, R., Lawrence, D., D’Odorico, P., and DeLonge, M.:                     sive phosphorus limitation of aboveground plant production
   Impact of land-use change on atmospheric P inputs in                    in natural terrestrial ecosystems, Nat. Commun., 11, 637,
   a tropical dry forest, J. Geophys. Res., 116, G01027,                   https://doi.org/10.1038/s41467-020-14492-w, 2020.
   https://doi.org/10.1029/2010JG001403, 2011.                           Hou, P., Ren, Y., Zhang, Q., Lu, F., Ouyang, Z., and Wang, X.:
Deng, O. and Chen, Y.: Fluxes, patterns and sources                        Nitrogen and phosphorous in atmospheric deposition and roof
   of phosphorus deposition in an urban–rural transi-                      runoff, Environ. Sci. Ecol., 21, 1621–1627, 2012.
   tion region in Southwest China, Figshare [data set],                  Kanakidou, M., Myriokefalitakis, S., and Tsagkaraki,
   https://doi.org/10.6084/m9.figshare.21571776.v1, 2022.                  M.: Atmospheric inputs of nutrients to the Mediter-
Deng, O., Zhang, S., Deng, L., Lan, T., Luo, L., Gao,                      ranean Sea, Deep-Sea Res. Pt. II, 171, 104606,
   X., and Zhou, W.: Atmospheric dry nitrogen deposition                   https://doi.org/10.1016/j.dsr2.2019.06.014, 2020.
   and its relationship with local land use in a high ni-                Mahowald, N., Jickell, T. D., Baker, A. R., Artaxo, P., Benitez-
   trogen deposition region, Atmos. Environ., 203, 114–120,                Nelson, C. R., Bergametti, G., Bond, T. C., Chen, Y., Co-
   https://doi.org/10.1016/j.atmosenv.2018.12.037, 2019.                   hen, D. D., Herut, B., Kubilay, N., Losno, R., Luo, C.,
Du, E., de Vries, W., Han, W., Liu, X., Yan, Z., and Jiang, Y.: Imbal-     Maenhaut, W., McGee, K. A., Okin, G. S., Siefert, R. L.,
   anced phosphorus and nitrogen deposition in China’s forests, At-        and Tsukuda, S.: Global distribution of atmospheric phos-
   mos. Chem. Phys., 16, 8571–8579, https://doi.org/10.5194/acp-           phorus sources, concentrations and deposition rates, and an-
   16-8571-2016, 2016.                                                     thropogenic impacts, Global Biogeochem. Cy., 22, GB4026,
Du, E., Terrer, C., Pellegrini, A. F. A., Ahlstrom, A., van Lissa, C.      https://doi.org/10.1029/2008GB003240, 2008.
   J., Zhao, X., Xia, N., Wu, X., and Jackson, R. B.: Global patterns    Mohan, S. M.: An overview of particulate dry deposition:
   of terrestrial nitrogen and phosphorus limitation, Nat. Geosci.,        measuring methods, deposition velocity and control-
   13, 221–229, https://doi.org/10.1038/s41561-019-0530-4, 2020.           ling factors, Int. J. Environ. Sci. Technol., 13, 387–402,
Elser, J. J., Bracken, M. E. S., Cleland, E. E., Gruner, D. S.,            https://doi.org/10.1007/s13762-015-0898-7, 2016.
   Harpole, W. S., Hillebrand, H., Ngai, J. T., Seabloom, E. W.,         Nenes, A., Krom, M. D., Mihalopoulos, N., Van Cappellen, P., Shi,
   Shurin, J. B., and Smith, J. E.: Global analysis of nitrogen            Z., Bougiatioti, A., Zarmpas, P., and Herut, B.: Atmospheric
   and phosphorus limitation of primary producers in freshwater,           acidification of mineral aerosols: a source of bioavailable phos-
   marine, and terrestrial ecosystems, Ecol. Lett., 10, 1135–1142,         phorus for the oceans, Atmos. Chem. Phys., 11, 6265–6272,
   https://doi.org/10.1111/j.1461-0248.2007.01113.x, 2007.                 https://doi.org/10.5194/acp-11-6265-2011, 2011.
Field, J. P., Belnap, J., Breshears, D. D., Neff, J. C., Okin, G.        Oladosu, N. O., Abayomi, A. A., Olayinka, K. O., and Alo, B. I.:
   S., Whicker, J. J., Painter, T. H., Ravi, S., Reheis, M. C., and        Wet nitrogen and phosphorus deposition in the eutrophication of
   Reynolds, R. L.: The ecology of dust, Front. Ecol. Environ., 8,         the Lagos Lagoon, Nigeria, Environ. Sci. Pollut. Res., 24, 8645–
   423–430, https://doi.org/10.1890/090050, 2010.                          8657, https://doi.org/10.1007/s11356-017-8479-6, 2017.
Gao, Y., Zhu, B., Zhou, P., Tang, J., Wang, T., and Miao,                Pan, Y., Liu, B., Gao, J., Liu, J., Tian, S., and Du, E.: En-
   C.: Effects of vegetation cover on phosphorus loss from a               hanced atmospheric phosphorus deposition in Asia and Europe
   hillslope cropland of purple soil under simulated rainfall: a           in the past two decades, Atmos. Ocean. Sci. Lett., 14, 100051,
   case study in China, Nutr. Cycl. Agroecosyst., 85, 263–273,             https://doi.org/10.1016/j.aosl.2021.100051, 2021.
   https://doi.org/10.1007/s10705-009-9265-8, 2009.

Atmos. Chem. Phys., 22, 14813–14823, 2022                                                 https://doi.org/10.5194/acp-22-14813-2022
Y. Chen et al.: Fluxes, patterns and sources of phosphorus deposition 14823 Parron, L. M., Cunha Bustamante, M. M., and Markewitz, D.: Vitousek, P. M., Porder, S., Houlton, B. Z., and Chadwick, O. Fluxes of nitrogen and phosphorus in a gallery forest in A.: Terrestrial phosphorus limitation: mechanisms, implications, the Cerrado of central Brazil, Biogeochemistry, 10, 89–104, and nitrogen–phosphorus interactions, Ecol. Appl., 20, 5–15, https://doi.org/10.1007/s10533-010-9537-z, 2011. https://doi.org/10.1890/08-0127.1, 2010. Peñuelas, J., Poulter, B., Sardans, J., Ciais, P., Van der Velde, Wang, H., Yang, F., Shi, G., Tian, M., Zhang, L, Zhang, M., Bopp, L., Boucher, O., Godderis, Y., Hinsinger, P., Llu- L, and Fu, C.: Ambient concentration and dry deposi- sia, J. Nardin, E., Vicca, S., Obersteiner, M., and Janssens, I. tion of major inorganic nitrogen species at two urban sites A.: Human-induced nitrogen-phosphorus imbalances alter nat- in Sichuan Basin, China, Environ. Pollut., 219, 235–244, ural and managed ecosystems across the globe, Nat. Commun., https://doi.org/10.1016/j.envpol.2016.10.016, 2016. 4, 2934, https://doi.org/10.1038/ncomms3934, 2013. Wang, R., Balkanski, Y., Boucher, O., Ciais, P., Peñuelas, J., and Peñuelas, J., Sardans, J., Rivas-ubach, A., and Janssens, I. Tao, S.: Significant contribution of combustion-related emissions A.: The human-induced imbalance between C, N, and to the atmospheric phosphorus budget, Nat. Geosci., 8, 48–54, P in Earth’s life system, Glob. Change Biol., 18, 3–6, https://doi.org/10.1038/ngeo2324, 2015. https://doi.org/10.1111/j.1365-2486.2011.02568.x, 2011. Wang, W., Liu, X., Xu, J., Dore, A. J., and Xu, W.: Imbalanced Pollman, C. D., Landing, W. M., and Perry Jr., J. J.: Wet deposi- nitrogen and phosphorus deposition in the urban and forest en- tion of phosphorus in Florida, Atmos. Environ., 36, 2309–2318, vironments in southeast Tibet, Atmos. Pollut. Res., 9, 774–782, https://doi.org/10.1016/S1352-2310(02)00199-1, 2002. https://doi.org/10.1016/j.apr.2018.02.002, 2018. Qi, J., Li, P., Li, X., Feng, L., and Zhang, M.: Esti- Winter, J. G., Dillon, P. J., Futter, M. N., Nicholls, K. H., Scheider, mation of dry deposition fluxes of particulate species to W. A., and Scott, L. D.: Total Phosphorus Budgets and Nitrogen the water surface in the Qingdao area, using a model Loads: Lake Simcoe, Ontario (1990 to 1998), J. Gt. Lakes Res., and surrogate surfaces, Atmos. Environ., 39, 2081–2088, 28, 301–314, https://doi.org/10.1016/S0380-1330(02)70586-8, https://doi.org/10.1016/j.atmosenv.2004.12.017, 2005. 2002. Rodríguez, S., Alastuey, A., Alonso-Pérez, S., Querol, X., Cuevas, Ma, X., Li, Y., Zhang, M., Zheng, F., and Du, S.: Assess- E., Abreu-Afonso, J., Viana, M., Pérez, N., Pandolfi, M., and ment and analysis of non-point source nitrogen and phos- Rosa, J. D. L.: Transport of desert dust mixed with north african phorus loads in the Three Gorges Reservoir Area of Hubei industrial pollutants in the subtropical Saharan Air Layer, At- Province, China, Sci. Total Environ., 412/413, 154–161, mos. Chem. Phys., 11, 6663–6685, https://doi.org/10.5194/acp- https://doi.org/10.1016/j.scitotenv.2011.09.034, 2011. 11-6663-2011, 2011. Yang, F., Tan, J., Shi, Z., Cai, Y., He, K., Ma, Y., Duan, F., Song, L., Kuang, F., Zhou, M., Zhu, B., and Skiba, U.: Okuda, T., Tanaka, S., and Chen, G.: Five-year record of at- Bulk phosphorous deposition at four typical land use mospheric precipitation chemistry in urban Beijing, China, At- sites in Southwest China, Chemosphere, 288, 132424, mos. Chem. Phys., 12, 2025–2035, https://doi.org/10.5194/acp- https://doi.org/10.1016/j.chemosphere.2021.132424, 2022. 12-2025-2012, 2012. Tipping, E., Benham, S., Boyle, J. F., Crow, P., Davies, J., Fischer, Zhai, J., Cong, L., Yan, G., Wu, Y., Liu, J., Wang, Y., Ma, W., U., Guyatt, H., Helliwell, R., Jackson-Blake, L., Lawlor, A. J., and Zhang, Z.: Dry Deposition of Particulate Matter and Ions Monteith, D. T., Rowe, E. C., and Toberman, H.: Atmospheric in Forest at Different Heights, Int. J. Environ. Res., 13, 117–130, deposition of phosphorus to land and freshwater, Environ. Sci., https://doi.org/10.1007/s41742-018-0158-z, 2019. 16, 1608–1617, https://doi.org/10.1039/C3EM00641G, 2014. Zhang, X., Lin, C., Zhou, X., Lei, K., Guo, B., Gao, Y., Lu, S., Liu, Tong, Y., Zhang, W., Wang, X., Couture, R. M., Larssen, T., Zhao, X., and He, M.:. Concentrations, fluxes, and potential sources of Y., Li, J., Liang, H., Liu, X., Bu, X., He, W., Zhang, Q., and Lin, nitrogen and phosphorus species in atmospheric wet deposition Y.: Decline in Chinese lake phosphorus concentration accompa- of the Lake Qinghai Watershed, China, Sci. Total Environ., 682, nied by shift in sources since 2006, Nat. Geosci., 10, 507–511, 523–531, https://doi.org/10.1016/j.scitotenv.2019.05.224, 2019 https://doi.org/10.1038/ngeo2967, 2017. Zhou, K., Lu, X., Mori, T., Mao, Q., Wang, C., Zheng, M., Mo, Tsukuda, S., Sugiyama, M., Harita, Y., and Nishimura, K.: At- H., Hou, E., and Mo, J.: Effects of long-term nitrogen deposi- mospheric bulk deposition of soluble phosphorus in Ashiu Ex- tion on phosphorus leaching dynamics in a mature tropical forest, perimental Forest, Central Japan: source apportionment and Biogeochemistry, 138, 215–224, https://doi.org/10.1007/s10533- sample contamination problem, Atmos. Environ., 39, 823–836, 018-0442-1, 2018. https://doi.org/10.1016/j.atmosenv.2004.10.028, 2005. Zhu, J., Wang, Q., He, N., Smith, M.D., Elser, J.J., Du, Van Langenhove, L., Verryckt, L. T., Bréchet, L., Courtois, E. J., Yuan, G., Yu, G., and Yu, Q.: Imbalanced atmospheric A., Stahl, C., Hofhansl, F., Bauters, M., Sardans, J., Boeckx, nitrogen and phosphorus depositions in China: Implica- P., Fransen, E., Peñuelas, J., and Janssens, I. A.: Atmo- tions for nutrient limitation: Imbalanced N and P Deposi- spheric deposition of elements and its relevance for nutrient tions in China, J. Geophys. Res.-Biogeo., 121, 1605–1616, budgets of tropical forests, Biogeochemistry, 149, 175–193, https://doi.org/10.1002/2016JG003393, 2016. https://doi.org/10.1007/s10533-020-00673-8, 2020. https://doi.org/10.5194/acp-22-14813-2022 Atmos. Chem. Phys., 22, 14813–14823, 2022
You can also read