Vertical sleeve gastrectomy induces distinctive transcriptomic responses in liver, fat and muscle
←
→
Page content transcription
If your browser does not render page correctly, please read the page content below

www.nature.com/scientificreports
OPEN Vertical sleeve gastrectomy
induces distinctive transcriptomic
responses in liver, fat and muscle
Chang Ho Ahn1,2, Eun Hye Choi1,3, Hyunjung Lee4,5, Woochan Lee4,5, Jong‑Il Kim4,5 &
Young Min Cho1,3*
Vertical sleeve gastrectomy (VSG) is the most commonly performed bariatric/metabolic surgery,
exhibiting a high rate of diabetes remission in humans. To elucidate the molecular mechanisms of
VSG, we performed transcriptomic analysis of the liver, fat, and muscle in VSG mice. C57BL/6 mice
fed a high-fat diet were randomly assigned to sham or VSG surgery. The sham-operated mice were fed
ad libitum (sham group) or pair-fed (sham-PF group) matching their food intake to the VSG-operated
mice. Comparative transcriptomic analysis of the liver, fat, and muscle using RNA sequencing was
performed. VSG reduced body weight and improved glucose tolerance compared to the sham group,
but not more than the sham-PF group. Improvement in fatty liver and adipose tissue inflammation
was comparable between VSG and sham-PF. However, global gene expression profiles showed
distinctive changes in the liver, fat, and muscle of the VSG group compared to both the sham or
sham-PF groups. The liver showed the most prominent gene expression changes. Immune response-
related pathways were commonly upregulated in the three organs of the VSG group compared to the
sham or sham-PF. VSG induces organ-specific gene expression changes in the liver, fat, and muscle,
which may play critical roles in metabolic improvements after VSG.
Bariatric surgery is currently the most effective and durable treatment for obesity. Furthermore, its profound
metabolic effects including remission of type 2 diabetes mellitus (T2DM) introduced a new concept that is called
‘metabolic surgery’1. Among various types of bariatric/metabolic surgery, vertical sleeve gastrectomy (VSG) is
the most popular procedure worldwide2,3. VSG removes approximately 80% of the stomach along the side of the
greater curvature, leaving a tube-like remnant stomach. In this regard, VSG was initially considered a restrictive
surgery4. However, a growing body of evidence suggests that the restriction of food intake is not the primary
mechanism driving metabolic improvements after V SG5.
VSG has pleiotropic effects on whole-body metabolism and its r egulation6. VSG decreases hedonic food
intake. In obese patients, the hedonic rating for high-fat food was decreased after V SG7. Bile acid pool is another
component affected by VSG. In mice, total circulating bile acid level was increased after VSG8. Specifically,
conjugated bile acid levels were increased, but unconjugated bile acid levels were decreased8. Bile acids not only
serve critical roles in fat absorption, but they also act through cellular receptors including FXR and TGR5. FXR
knock-out mice showed diminished effects of VSG, suggesting a pivotal role of FXR to mediate the effects of
VSG9. TGR5 knock-out mice showed reduced, but nevertheless significant improvements of glucose metabolism
after VSG8,10. Bariatric surgery also affects the secretion of gut hormones11. After VSG, postprandial secretion of
glucagon-like peptide-1 (GLP-1) and peptide YY (PYY) was i ncreased12. The increase of GLP-1 secretion was a
significant predictor of diabetes remission after surgery12. The gut microbial composition is changed after VSG.
The Bacteroides genus was decreased after VSG, which was associated with low adiposity and improved glucose
metabolism13.
In addition to the abovementioned effects of VSG, previous studies showed distinctive effects of bariatric
surgery on major glucose-metabolizing organs, liver, fat and muscle. In the liver, hepatic glucose production and
atients14. VSG-induced gene expres-
fat content were decreased as early as 1 week after bariatric surgery in obese p
sion changes of the liver were independent of weight loss, where genes involved in bile acid metabolism were
1
Department of Internal Medicine, Seoul National University College of Medicine, 101 Daehak‑ro, Jongno‑gu,
Seoul 03080, Republic of Korea. 2Department of Internal Medicine, Seoul National University Bundang
Hospital, Seongnam, Republic of Korea. 3Department of Internal Medicine, Seoul National University Hospital,
Seoul, Republic of Korea. 4Department of Biomedical Sciences, Seoul National University, Seoul, Republic of
Korea. 5Medical Research Center, Genomic Medicine Institute, Seoul National University, Seoul, Republic of
Korea. *email: ymchomd@snu.ac.kr
Scientific Reports | (2021) 11:2310 | https://doi.org/10.1038/s41598-021-81866-5 1
Vol.:(0123456789)
www.nature.com/scientificreports/
mainly changed15,16. In adipose tissue, bariatric surgery induced decreased lipolysis and tissue inflammation17,18.
In gene expression analyses, pathways involving branched chain amino acid, NAD+, and glutathione metabo-
lism were upregulated in both visceral and subcutaneous adipose tissue 1 year after bariatric surgery in obese
patients19. The muscle showed improved lipid metabolism and mitochondrial function 1 year after bariatric
surgery, which was accompanied by various epigenetic changes20. To systematically explore the effects of VSG
on major glucose-metabolizing organs (i.e., the liver, fat and muscle), we analyzed global gene expression of the
three organs in VSG-operated mice.
Materials and methods
Animals. Six-week-old male C57BL/6 N mice were purchased from Orient Bio, Seongnam, Korea. After
1 week of acclimation, mice were fed 60% high-fat diet (D12492, Research Diets, New Brunswick, NJ, USA)
for 12 weeks, and randomly divided into 3 body weight-matched groups: sham, sham-pair feeding (sham-PF),
and VSG groups. The sham-PF group was matched to the VSG group one-by-one and given the same amount
of high-fat diet eaten by the VSG group. The mice were housed 3 or 4 mice per cage and then individually from
8 weeks before surgery. The housing environment was maintained in a controlled temperature (25 °C) and 12-h
light/dark cycle (light off at 20:00 h). All procedures for the animal study were approved by the Institutional
Animal Care and Use Committee of Seoul National University Hospital (approval no. 15-0113-C1A1) and were
conducted in accordance with the National Institutes of Health Guide for the Care and Use of Laboratory Ani-
mals guideline for the ethical treatment of animals. All animal studies were carried out in compliance with the
ARRIVE guidelines21.
Surgical procedure and perioperative care. Mice were fasted for 18 h before surgery. The surgical
area of the abdomen was depilated using thioglycolic acid cream (Niclean, Ildong Pharmaceuticals, Seoul,
Korea). After induction of isoflurane anesthesia, the abdomen was disinfected with povidone-iodine solution
and midline laparotomy was performed. The stomach was gently exposed and the spleen was separated from the
stomach. The lateral stomach was excised along with a virtual line from gastroesophageal junction to pylorus-
duodenum junction leaving a tubular remnant of the stomach. The remaining stomach was approximated and
closed by a running suture with 6-0 Vicryl. If leakage was suspected by visual inspection, we added additional
sutures. Thereafter, the intraperitoneal cavity was washed with warm saline 3 or 4 times. Dry gauze was gently
applied to remove any remaining fluid in the cavity. The abdominal fascia and the skin were closed by a running
suture using 6-0 Vicryl and 6-0 nylon, respectively. Antibiotics (ceftriaxone 50 mg/kg/day) was administered
before surgery and until postoperative day 2. Normal saline 20 ml/kg was administered after surgery to prevent
dehydration. Analgesics (meloxicam 1 mg/kg/day) were administered after surgery and until postoperative day
2. The sham surgery included midline laparotomy, stomach isolation and closing the incision. The duration of
sham operation was matched to that of the VSG group by waiting for 10 to 20 min after stomach isolation while
the abdomen was covered by warm saline-soaked gauze. No oral intake was allowed for postoperative 24 h.
Water was provided for 1 day followed by 5 days of liquid diet (Nucare, Daesang Welllife, Seoul, Korea). On
postoperative day 6, 1 g of high-fat diet was reintroduced with liquid diet. If the mouse looked well and ate the
high-fat diet, then ad libitum high-fat diet was given without liquid diet. The body weight and food intake were
monitored daily.
Insulin tolerance test. Mice were fasted for 4 h and given an intraperitoneal injection of insulin (0.75 IU/
kg). Blood glucose was measured with a glucometer (AccuCheck, Roche Diagnostics, Indianapolis, IN, USA)
from the tip of the tail vein at 0, 15, 30, 60, and 90 min after the insulin injection.
Glucose tolerance test. The mice underwent both intraperitoneal glucose tolerance test (IPGTT) and oral
glucose tolerance test (OGTT) 1 week apart. Mice fasted for 12 h overnight was given 20% dextrose (1 g/kg) by
intraperitoneal injection and oral gavage, respectively. Blood glucose was measured with a glucometer (Accu-
Check) from the tip of the tail vein at 0, 15, 30, 60, and 120 min after glucose administration.
Glucose‑stimulated insulin and GLP‑1 secretion in vivo. On a separate day at least 1 week apart from
any blood measurement, mice fasted for 12 h overnight were given 20% dextrose (1 g/kg) by oral gavage. Before
and 15 min after the oral gavage, approximately 100 μl of blood was obtained. Blood was cold-centrifuged and
plasma was stored at − 80 °C until the measurement of insulin and total GLP-1. Plasma insulin and total GLP-1
level were measured by ELISA (#90080 and #81508, respectively, CrystalChem, Downers Grove, IL).
Tissue collection and RNA sequencing. After euthanasia, the liver, epididymal fat and soleus muscle
were isolated from the sham, sham-PF, and VSG groups. Tissues were stored in RNAlater solution (Invitrogen,
Carlsbad, CA, USA) at − 20 °C. Total RNA was extracted using RNeasy Plus Universal kits (Qiagen, Valencia,
CA, USA). RNA quality was checked based on RNA integrity number (RIN). All samples had RIN over 9.0.
cDNA library was constructed with the TruSeq RNA library kit using 1 μg of extracted RNA. The protocol con-
sisted of polyA-selected RNA extraction, RNA fragmentation, random hexamer primed reverse transcription
and 100 nt paired-end sequencing by Illumina HiSeq4000 (Illumina Inc., San Diego, CA, USA). Sequence reads
were aligned to the mouse reference genome (mm10) and gene expression values were calculated from aligned
reads using RSEM-1.2.31. Differentially expressed genes (DEGs) were determined using DESeq2 package in
three comparisons: sham-PF versus sham, VSG versus sham, and VSG versus sham-PF22. The criteria for DEG
was adjusted P value < 0.05 and absolute fold change ≥ 1.5. Enrichment analysis of gene ontology biologic process
Scientific Reports | (2021) 11:2310 | https://doi.org/10.1038/s41598-021-81866-5 2
Vol:.(1234567890)
www.nature.com/scientificreports/
and KEGG p athway23 was done using DAVID s oftware24. The enrichment analysis was done for upregulated
genes and downregulated genes separately and the genes with raw P value < 0.05 were used for the analysis.
To compare the gene expression profiles with Roux-en-Y gastric bypass (RYGB) mouse model, the Gene
Expression Omnibus (GEO) database (https://www.ncbi.nlm.nih.gov/gds/) was searched for datasets that
included the gene expression profiles of the liver, fat, and muscle samples collected from mouse RYGB models.
GSE113823 is the dataset deposited from a study that investigated the gene expression of different organs after
RYGB25. In that study, the gene expression profiles of the liver, inguinal fat, and gastrocnemius muscle were ana-
lyzed and compared with weight-matched sham control group. The dataset of postoperative 9 weeks was used.
We downloaded the FASTQ files and processed it using the same protocols of our current study.
Flow cytometry analysis of the stromal vascular fraction. The dissected epididymal fat samples
were minced in DMEM with 1 mg/ml collagenase P (Roche, Mannheim, Germany) and 5% BSA. After 45 min
of shaking incubation at 37 °C, any debris was filtered using nylon mesh. The stromal vascular fraction (SVF)
was separated via centrifugation (500 g for 10 min). The SVF was washed and incubated with antibodies for
further flow cytometry analysis. For the analysis of macrophage population, the SVF was stained with following
antibodies: CD11b-FITC (BD 557396, BD Biosciences, Franklin Lakes, NJ), F4/80-Bv421 (BD 565411), CD206-
APC (BD 565250), and MHC II-PE (BD 562010). For the analysis of lymphocyte population, the SVF was
stained with following antibodies: CD19-APC-Cy7 (BD 561043) and CD3-PE-Cy5 (BD 561108). Samples were
analyzed using a BD FACSCanto and FACSDiva software (BD Biosciences, Franklin Lakes, NJ). Data were pro-
cessed with FlowJo software (Tree Star Inc. Ashland, OR).
Histologic analysis. The tissues were fixed in 4% paraformaldehyde solution and embedded in paraffin.
The tissue sections were stained with hematoxylin and eosin (H&E). Nonalcoholic fatty liver disease severity
score which estimates the severity of fatty liver by the summation of steatosis, lobular inflammation and hepato-
cyte balloon degeneration was calculated in a blinded fashion. The lipid droplet areas of the H&E stained liver
were quantified using ImageJ26 according to a previous protocol27. The size of adipocyte was measured using
ImageJ. The number of crown-like structure was calculated per 5 high power field (× 200) to estimate the adipose
tissue inflammation.
Statistical analysis. Data in the graph were expressed as the mean ± SEM, unless otherwise indicated. The
area under the curve (AUC) was calculated using the trapezoidal rule. Time-series data were analyzed using
repeated measures ANOVA followed by Sidak’s post hoc test. Three group comparisons were performed using
one-way ANOVA followed by Tukey’s post hoc test. Pearson correlation of L og2 fold change of the gene expres-
sion was used to determine similarity between the gene expression data of VSG and RYGB model. Data were
analyzed using Prism v8.0 (GraphPad, San Diego, CA, USA) and R version 3.5.0 (R Foundation for Statistical
Computing, Vienna, Austria). P value < 0.05 was considered statistically significant. The statistical analysis used
for RNA sequencing was described in the previous section.
Results
Body weight and glucose tolerance. All three mice groups lost significant amounts of body weight
during the early postoperative period (Fig. 1a). The VSG group induced slightly more body weight loss than
the sham group during the liquid diet period and exhibited lower body weight regain thereafter. This resulted
in significant weight differences between the VSG and the sham group and the difference was maintained dur-
ing the rest of the study period. The body weight of the sham-PF group was initially paralleled with that of the
sham group during the liquid diet period. Then, the trajectory of the body weight of the sham-PF group followed
that of the VSG group after the initiation of pair feeding of the high-fat diet. The food intake was well matched
between the VSG and the sham-PF group (Fig. 1b). However, during postoperative 6 and 7 week, the sham-PF
group consumed slightly lower amount of food than the VSG group. Compared with the sham group, the VSG
group consumed less food only during the first 3 weeks after the surgery (Fig. 1b). The cumulative food intake
was similar between the VSG and the sham-PF group, both of which were lower than the sham group (Fig. 1c).
Both the VSG and the sham-PF group demonstrated better glucose tolerance than the sham group during
the OGTT and IPGTT (Fig. 1d,e). During the OGTT, the VSG group showed a higher peak of blood glucose at
15 min than the sham-PF group and a steeper decline nearly to the baseline level at 30 min (Fig. 1d). This unique
pattern observed during the OGTT was not seen during the IPGTT (Fig. 1e). The AUC of blood glucose levels
during the OGTT and IPGTT was similar between the VSG and the sham-PF groups, both of which were lower
than those of the sham group (Fig. 1d,e).
During the insulin tolerance test, the decrement of blood glucose level was significantly greater in the VSG
and sham-PF groups than in the sham group (Fig. 1f). Homeostatic model assessment of insulin resistance
(HOMA-IR)28 was significantly lower in the VSG group than in the sham group; however, the sham-PF showed
a nominal decrease compared to the sham group (Fig. 1g).
To measure postprandial insulin and GLP-1 secretion, blood was sampled at baseline and 15 min after an oral
glucose load. Postprandial insulin levels were significantly higher in the VSG group than in both the sham and
sham-PF groups (Fig. 1h). The insulinogenic index at 15 min (the increment of insulin divided by the increment
of glucose in the blood) was significantly higher in the VSG group than in the sham group (Fig. 1i), which also
tended to be higher than in the sham-PF group (P = 0.070). Postprandial plasma GLP-1 levels were higher in the
VSG group than in both the sham and the sham-PF groups (Fig. 1j). Fasting GLP-1 levels were not significantly
different among the three groups.
Scientific Reports | (2021) 11:2310 | https://doi.org/10.1038/s41598-021-81866-5 3
Vol.:(0123456789)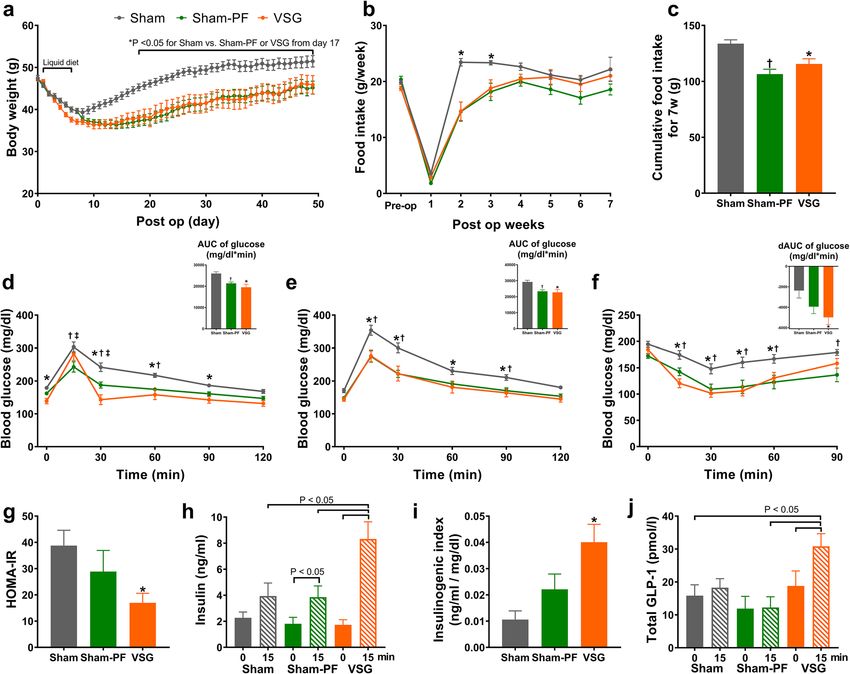
www.nature.com/scientificreports/

                                            Figure 1.  VSG induced sustained weight loss and improved glucose tolerance. (a) Body weight, (b) weekly
                                            food intake and (c) cumulative food intake during 7 weeks after surgery. (d) Blood glucose levels during the
                                            oral glucose tolerance test and the AUC of glucose levels (inset figure). (e) Blood glucose levels during the
                                            intraperitoneal glucose tolerance test and the AUC of glucose levels (inset figure). (f) The blood glucose levels
                                            during the insulin tolerance test and the decremental AUC, which is the area under the curve of the glucose
                                            levels below the baseline glucose level (inset figure). (g) HOMA-IR is defined as fasting glucose level (mg/
                                            dl) × fasting insulin level (μU/ml)/405. (h) The plasma insulin levels of fasted and 15 min after the oral glucose
                                            challenge. (i) Insulinogenic index is the increment of the insulin divided by the increment of the glucose level
                                            between fasting and 15 min after the oral glucose challenge. (j) The plasma GLP-1 levels of fasted and 15 min
                                            after the oral glucose challenge. N = 12 in each group. Comparison: Repeated measured ANOVA with Sidak’s
                                            post hoc test. *P < 0.05 for sham versus VSG. Data are mean with SEM. †P < 0.05 for sham versus sham-PF.
                                            ‡
                                             P < 0.05 for sham-PF versus VSG.

                                            Histologic analysis. On the histologic examination of the liver, fatty liver was apparently improved in the
                                            sham-PF and VSG groups compared to the sham group (Fig. 2a). The lipid droplet area was significantly lower in
                                            the VSG and sham-PF groups than the sham group (Fig. 2b). Nonalcoholic fatty liver disease activity score of the
                                            VSG and sham-PF groups tended to be lower than that of the sham group (P = 0.08) (Fig. 2c). The liver weight
                                            also tended to be lower in the VSG and sham-PF groups than in the sham group (Fig. 2d).
                                                On the histologic examination of the epididymal fat, the sham-PF and the VSG groups had fewer numbers
                                            of crown-like structures compared to the sham group (Fig. 2e,f). The mean adipocyte size was similar among
                                            the three groups (Fig. 2g).

                                            Global gene expression analyses. The global gene expression profile showed a distinctive pattern in the
                                            liver, fat, and muscle (Fig. 3a–d). In the liver, the number of DEG was greater in the comparison between VSG
                                            versus sham-PF than VSG versus sham or sham-PF versus sham (Fig. 3a). The global gene expression profile of
                                            the liver changed in a seemingly opposite direction in the VSG and the sham-PF group compared to the sham

          Scientific Reports |   (2021) 11:2310 |                https://doi.org/10.1038/s41598-021-81866-5                                                      4

Vol:.(1234567890)
www.nature.com/scientificreports/
Figure 2. Histologic evaluation of the liver and fat. (a) The representative images of the H&E staining of
the liver tissue. (b) The lipid droplet area of the liver, (c) NAFLD activity score and (d) liver weight. (e) The
representative images of the H&E staining of the fat tissue. Arrows indicate crown-like structures. (f) The
number of crown-like structure per high power field and (g) adipocyte size. N = 8 in each group. Comparison:
ANOVA with Tukey’s post hoc test. *P < 0.05 for sham versus VSG. †P < 0.05 for sham versus sham-PF.
group, which suggests that the response to the surgery, which was shown in the VSG group, and the response
to the calorie-restriction alone, which was shown in the sham-PF group, appeared to be distinctive (Fig. 3d).
In the fat, the number of DEG was greater in the comparison between VSG versus sham than VSG versus
sham-PF or sham-PF versus sham (Fig. 3b). Compared to the sham group, the global gene expression profile
of the fat changed in a similar direction in the VSG and the sham-PF group (Fig. 3d). In the muscle, however,
the number of DEG was much smaller than in the liver or fat (Fig. 3c). Global gene expression profiles showed
only small changes by VSG or calorie restriction (as is shown in the sham-PF group) in the muscle (Fig. 3d).
VSG versus RYGB. RYGB and VSG are the two most popular types of bariatric s urgery2. They create dif-
ferent anatomical alterations in the gastrointestinal tract and may have different effects on major organs for
the glucose homeostasis including the liver, fat, and muscle. To compare the gene expression changes between
RYGB and VSG models, we analyzed a GEO dataset by Ben-Zvi et al. that was composed of the liver, fat, and
muscle samples from RYGB-operated mice and body weight-matched sham-operated mice25. The gene expres-
sion changes of the RYGB group versus the weight-matched sham group from the former dataset and of the
VSG group versus the sham-PF group from the current study were compared. The global gene expression profile
was distinctive between the VSG and RYGB model, which mainly reflects the different experimental settings
(Fig. 4a). When we examine the correlation of the fold-changes of the gene expression between VSG and RYGB
in an organ-specific manner, the correlation was higher in the liver than the fat or muscle (Fig. 4b). When the
correlation of gene expressions involved in each specific pathway was analyzed, genes involved in the immune
system process showed a higher correlation between VSG and RYGB than other pathways including metabo-
lism-related pathways (Fig. 4b). The correlation of the gene expression in the glucose and fatty acid metabolism
pathway between VSG and RYGB was statistically significant only in the liver (Fig. 4b). The effects of RYGB on
the gene expression of the liver, fat, and muscle were in a similar direction as VSG, but with higher fold-changes
than VSG for both the metabolism-related genes and the immune response-related genes (Fig. 4c,d).
Pathway analyses of the gene expression data. Pathway analyses of the gene ontology and KEGG
pathways showed that immune response-related pathways were commonly upregulated in the three organs of
the VSG group compared to the sham-PF group (Fig. 5a–c). Specifically, ‘innate immune response’ was signifi-
cantly enriched in the liver, fat, and muscle. B cell-related pathways were enriched in the liver and fat. At the
gene level, Ifngr1, which is a receptor of IFN-γ and induces proinflammatory M1 polarization of macrophages
was downregulated in the liver, fat, and muscle of the VSG group (Supplementary Table S1). Flow cytometry
analysis of the stromal vascular fraction isolated from the epididymal fat showed a tendency of increased anti-
inflammatory M2 macrophages (Supplementary Figure S1a–c). Cxcl13, a B cell chemoattractant, was also a
common DEG in the liver, fat, and muscle of the VSG group (Supplementary Table S1). Cxcl13 is involved in B
cell-related pathways and was upregulated in the three organs. Flow cytometry analysis of the stromal vascular
fraction isolated from the epididymal fat showed increased C D19+/CD3+ lymphocyte ratio, suggesting increased
B cell-to-T cell ratio among the lymphocyte population in the VSG group compared to the sham-PF group (Sup-
plementary Figure S1d–f). In the VSG group, compared to the sham group, immune response-related pathways
were also commonly upregulated in the liver, fat, and muscle (Fig. 5d–f).
Metabolism-related pathways were enriched in the liver of the VSG group compared to those of the sham-PF
group (Fig. 5a). ‘Lipid metabolic process’ and ‘fatty acid metabolic process’ were enriched in the downregulated
DEGs of the liver. At the gene level, the expression of metabolism-related genes was also changed mainly in the
liver (Supplementary Figure S2a). In the liver of the VSG group, genes involved in the glycolysis pathway, includ-
ing Hk1, Hk3, and Pkm were upregulated, while these genes were downregulated in the liver of the sham-PF
group compared to the sham group (Supplementary Figure S2b). The genes involved in the fatty acid synthesis
and elongation processes including Acaca, Fasn, and Elovl, were downregulated in the liver of the VSG group
Scientific Reports | (2021) 11:2310 | https://doi.org/10.1038/s41598-021-81866-5 5
Vol.:(0123456789)www.nature.com/scientificreports/
Figure 3. Global gene expression profiles of the liver, fat and muscle. The volcano plot of (a) the liver, (b) fat
and (c) muscle. The DEG was defined as adjusted P value < 0.05 and fold change ≥ 1.5. (d) Heatmap showing log2
fold change in the three comparison: sham-PF versus sham, VSG versus sham, and VSG versus sham-PF. Each
column represent a gene and genes that showed adjusted P value < 0.05 in any of the three organs are included
in the heatmap. The numbers of mice included in the RNA sequencing analysis were 4, 3, and 3 for the sham,
sham-PF, and VSG group, respectively. S, Sham group; SP, sham-PF group, V, VSG group.
compared to that of the sham group, which was not seen in the sham-PF group. In the VSG group compared
to the sham group, metabolism-related pathways including ‘lipid metabolic pathway’ were also enriched in the
downregulated DEGs of the liver (Fig. 5d).
Scientific Reports | (2021) 11:2310 | https://doi.org/10.1038/s41598-021-81866-5 6
Vol:.(1234567890)www.nature.com/scientificreports/
Figure 4. The comparison of gene expression profile between the VSG and RYGB model. (a) PCA plot of the
VSG and RYGB model and their respective control groups. conRYGB, weight-matched control mice of the
RYGB mice; conVSG, pair-fed control mice of the VSG mice. (b) Correlation between the gene expression
changes of the VSG and RYGB model. Red indicates a positive correlation, while blue indicates a negative
correlation. ‘*’ denotes significant by P value < 0.05. All other correlations were significant with P value < 0.001.
The expression patterns of the genes of the (c) metabolic process and (d) the immune system process in the VSG
and RYGB model. Heatmap shows log2 fold change. Each row represents a gene. Any genes that showed adjusted
P value < 0.05 in any of the three organs are included in the heatmap.
Discussion
In this study, we focused on the effects of VSG on gene expression in the liver, fat, and muscle, the three major
glucose-metabolizing organs. The VSG group exhibited improved glucose tolerance and reduced body weight
compared to the sham group. However, the glucose tolerance and body weight of the VSG group were similar
to those of the sham-PF group. Although histologic changes were not different between the VSG and the sham-
PF group in the liver and fat, the gene expression profile showed distinctive changes, which implies additional
mechanisms of VSG on metabolic improvements other than calorie restriction alone.
The global gene expression profile showed a much larger change in the liver compared to the fat and muscle.
The muscle showed only small changes in global gene expression. In a previous study29, a rat VSG model showed
that the significant decrease of hepatic glucose production was the major contributor to the improvement of
glucose tolerance than sham or sham-PF control rats. In the same study, glucose clearance by peripheral tissues
was not different between the VSG and the sham or the sham-PF g roup29. In a study of obese patients with T2DM,
HOMA-IR, which mainly reflects hepatic insulin sensitivity, was improved as early as 3 days after VSG before
any significant weight loss o ccurred30. In another study, the hepatic insulin sensitivity measured by a hyperin-
sulinemic–euglycemic clamp was significantly improved 1 week after RYGB in obese patients, while peripheral
nchanged31. The liver showed the most prominent gene expression changes in our study,
insulin sensitivity was u
suggesting that the liver is the primary organ mediating the systemic effects of VSG.
Effects of VSG on hepatic glucose metabolism can be summarized as the upregulated glycolytic pathway.
Genes involved in the rate limiting and irreversible steps of glycolysis, Hk1, Hk3, and Pkm, were upregulated
in the liver of the VSG group compared to that of the sham-PF group. These genes were downregulated in the
sham-PF group compared to the sham group. The calorie intake in the sham-PF group was restricted to match
Scientific Reports | (2021) 11:2310 | https://doi.org/10.1038/s41598-021-81866-5 7
Vol.:(0123456789)www.nature.com/scientificreports/
Figure 5. Pathway analyses of the liver, fat and muscle in the VSG group. The enrichment analyses of gene
ontology and KEGG pathways in (a) the liver, (b) fat, and (c) muscle in the VSG group compared to the
sham-PF group and (d) the liver, (e) fat, and (f) muscle in the VSG group compared to the sham group are
summarized. Top 5 gene ontologies or KEGG pathways with adjusted P value < 0.05 are shown.
to the calorie intake of the VSG group. In the calorie-restricted state, the activity of gluconeogenic enzymes is
enhanced and that of glycolytic enzymes is suppressed in the l iver32,33. VSG might reverse this calorie restriction-
induced changes of hepatic glucose metabolism. Although we could not specify the mechanism of how VSG
affects hepatic gene expression, the changes of bile acid pool and subsequent FXR signaling could mediate this
effect. FXR is a nuclear receptor of bile acids that coordinates hepatic glucose metabolism according to fasting
and feeding s tate34. In a murine study, levels of circulating bile acids were increased and the expression of FXR
target genes were enhanced in the VSG g roup15. Activation of FXR by a chemical agonist or gene transfer sup-
pressed Pepck and G6pc, genes involved in gluconeogenesis in the liver35. In addition, a previous report that FXR
is required for the beneficial effects of VSG on glucose m etabolism9 supports the possibility that FXR mediates
the effects of VSG on hepatic gene expression.
In our VSG model, immune response-related pathways were upregulated in the liver, fat, and muscle. There are
other previous studies also reported the increased immune response in peripheral tissues after bariatric surgery.
Hagman et al. reported that, at postoperative 1 year after RYGB or VSG, patients exhibited 35 kg weight loss on
average, but the number of neutrophils, dendritic cells, macrophages, and T cells were increased in the subcutane-
ous adipose t issue36. Frikke-Schmidt et al. examined the adipose tissue immune cell population in VSG-operated
Scientific Reports | (2021) 11:2310 | https://doi.org/10.1038/s41598-021-81866-5 8
Vol:.(1234567890)www.nature.com/scientificreports/
ice37. The number of T cells and macrophages were increased in the epididymal fat of the VSG group compared
m
to that of the sham and the sham-PF group. A RYGB mouse study also reported that RYGB induced a stronger
immune response in the liver, fat, and muscle characterized by upregulation of Il3325. However, there are other
studies that reported opposite results. The expression levels of inflammatory cytokines including Ccl2, Il6, and
TNF-α were decreased in the adipose tissue of the RYGB-operated patients after achieving 20% body weight
loss38. Systemic levels of IL-6 were decreased in the short- and long-term periods after bariatric s urgery39. Col-
lectively, these results suggest that VSG might differentially affect each specific immune pathway in different
contexts such as different postoperative time points and target organs.
The flow cytometry analysis of the stromal vascular fraction was performed to examine whether the changes
in the gene expression was related to the changes in the immune cell population in the adipose tissue. In the
VSG group, compared to the sham-PF group, the proportion of M2 macrophage tended to be higher and B cell
to T cell ratio was modestly increased. Similarly, it was reported that VSG, compared to pair feeding, increased
CD11c− macrophage (an M2 phenotype) in the adipose tissue in high fat diet-fed obese m ice37. The metabolic
role of B cells residing in the adipose tissue is yet to be fully e lucidated40. It was reported that regulatory B cells
attenuated adipose tissue inflammation and had beneficial effects on glucose metabolism, while another B cell
subset, B2 subtype, promoted adipose tissue inflammation and insulin resistance41,42. Our study showed that
VSG altered the immune cell population in the adipose tissue and the immune response gene expression in the
liver, fat and muscle, which warrants further mechanistic study to elucidate the role of these immune responses
in metabolic improvements following VSG.
In summary, VSG improved glucose tolerance and induced sustained body weight loss to a similar extent as
pair-fed sham controls. VSG induced global gene expression changes in the liver, fat, and muscle. Among the
three organs, the liver showed the most prominent gene expression changes after VSG. Immune response-related
pathways, in particular, were commonly upregulated in the liver, fat, and muscle. VSG-induced gene expression
changes in the liver, fat and muscle may play a critical role in the metabolic improvements after VSG.
Data availability
The datasets generated during and/or analysed during the current study are available from the corresponding
author on reasonable request.
Received: 9 November 2020; Accepted: 12 January 2021
References
1. Madadi, F., Jawad, R., Mousati, I., Plaeke, P. & Hubens, G. Remission of type 2 diabetes and sleeve gastrectomy in morbid obesity: A
comparative systematic review and meta-analysis. Obes. Surg. 29, 4066–4076. https: //doi.org/10.1007/s11695 -019-04199- 3 (2019).
2. The International Federation for the Surgery of Obesity and Metabolic Disorders. Fifth IFSO Global Registry Report 2019 (2019).
3. Lee, W. J. & Aung, L. Metabolic surgery for type 2 diabetes mellitus: Experience from Asia. Diabetes Metab. J. 40, 433–443. https
://doi.org/10.4093/dmj.2016.40.6.433 (2016).
4. Phillips, B. T. & Shikora, S. A. The history of metabolic and bariatric surgery: Development of standards for patient safety and
efficacy. Metab. Clin. Exp. 79, 97–107. https://doi.org/10.1016/j.metabol.2017.12.010 (2018).
5. Madsbad, S., Dirksen, C. & Holst, J. J. Mechanisms of changes in glucose metabolism and bodyweight after bariatric surgery. Lancet
Diabetes Endocrinol. 2, 152–164. https://doi.org/10.1016/s2213-8587(13)70218-3 (2014).
6. Cho, Y. M. A gut feeling to cure diabetes: Potential mechanisms of diabetes remission after bariatric surgery. Diabetes Metab. J. 38,
406–415. https://doi.org/10.4093/dmj.2014.38.6.406 (2014).
7. Ammon, B. S. et al. Short-term pilot study of the effect of sleeve gastrectomy on food preference. Obes. Surg. 25, 1094–1097. https
://doi.org/10.1007/s11695-015-1602-1 (2015).
8. McGavigan, A. K. et al. TGR5 contributes to glucoregulatory improvements after vertical sleeve gastrectomy in mice. Gut 66,
226–234. https://doi.org/10.1136/gutjnl-2015-309871 (2017).
9. Ryan, K. K. et al. FXR is a molecular target for the effects of vertical sleeve gastrectomy. Nature 509, 183–188. https://doi.
org/10.1038/nature13135 (2014).
10. Ding, L. et al. Vertical sleeve gastrectomy activates GPBAR-1/TGR5 to sustain weight loss, improve fatty liver, and remit insulin
resistance in mice. Hepatology 64, 760–773. https://doi.org/10.1002/hep.28689 (2016).
11. Ahn, C. H., Chae, S., Oh, T. J., Hwang, D. & Cho, Y. M. Dynamic adaptive changes of the ileum transposed to the proximal small
intestine in rats. Obes. Surg. 29, 2399–2408. https://doi.org/10.1007/s11695-019-03858-9 (2019).
12. Nannipieri, M. et al. Roux-en-Y gastric bypass and sleeve gastrectomy: Mechanisms of diabetes remission and role of gut hormones.
J. Clin. Endocrinol. Metab. 98, 4391–4399. https://doi.org/10.1210/jc.2013-2538 (2013).
13. Sánchez-Alcoholado, L. et al. Gut microbiota adaptation after weight loss by Roux-en-Y gastric bypass or sleeve gastrectomy
bariatric surgeries. Surg. Obes. Relat. Dis. 15, 1888–1895. https://doi.org/10.1016/j.soard.2019.08.551 (2019).
14. Taylor, R. et al. Remission of human type 2 diabetes requires decrease in liver and pancreas fat content but is dependent upon
capacity for β cell recovery. Cell Metab. 28, 547-556.e543. https://doi.org/10.1016/j.cmet.2018.07.003 (2018).
15. Myronovych, A. et al. Vertical sleeve gastrectomy reduces hepatic steatosis while increasing serum bile acids in a weight-loss-
independent manner. Obesity 22, 390–400. https://doi.org/10.1002/oby.20548 (2014).
16. Abu-Gazala, S. et al. Sleeve gastrectomy improves glycemia independent of weight loss by restoring hepatic insulin sensitivity.
Diabetes 67, 1079–1085. https://doi.org/10.2337/db17-1028 (2018).
17. Hoffstedt, J. et al. Long-term protective changes in adipose tissue after gastric bypass. Diabetes Care 40, 77–84. https://doi.
org/10.2337/dc16-1072 (2017).
18. Camastra, S. et al. Muscle and adipose tissue morphology, insulin sensitivity and beta-cell function in diabetic and nondiabetic
obese patients: Effects of bariatric surgery. Sci. Rep. 7, 9007. https://doi.org/10.1038/s41598-017-08444-6 (2017).
19. Mardinoglu, A. et al. Extensive weight loss reveals distinct gene expression changes in human subcutaneous and visceral adipose
tissue. Sci. Rep. 5, 14841. https://doi.org/10.1038/srep14841 (2015).
20. Gancheva, S. et al. Dynamic changes of muscle insulin sensitivity after metabolic surgery. Nat. Commun. 10, 4179. https://doi.
org/10.1038/s41467-019-12081-0 (2019).
21. Percie du Sert, N. et al. The ARRIVE guidelines 2.0: Updated guidelines for reporting animal research. PLoS Biol. 18, e3000410.
https://doi.org/10.1371/journal.pbio.3000410 (2020).
Scientific Reports | (2021) 11:2310 | https://doi.org/10.1038/s41598-021-81866-5 9
Vol.:(0123456789)www.nature.com/scientificreports/
22. Love, M. I., Huber, W. & Anders, S. Moderated estimation of fold change and dispersion for RNA-seq data with DESeq2. Genome
Biol. 15, 550. https://doi.org/10.1186/s13059-014-0550-8 (2014).
23. Kanehisa, M. & Goto, S. KEGG: Kyoto encyclopedia of genes and genomes. Nucleic Acids Res. 28, 27–30. https://doi.org/10.1093/
nar/28.1.27 (2000).
24. da Huang, W., Sherman, B. T. & Lempicki, R. A. Systematic and integrative analysis of large gene lists using DAVID bioinformatics
resources. Nat. Protoc. 4, 44–57. https://doi.org/10.1038/nprot.2008.211 (2009).
25. Ben-Zvi, D. et al. Time-dependent molecular responses differ between gastric bypass and dieting but are conserved across species.
Cell Metab. 28, 310-323.e316. https://doi.org/10.1016/j.cmet.2018.06.004 (2018).
26. Schneider, C. A., Rasband, W. S. & Eliceiri, K. W. NIH image to ImageJ: 25 years of image analysis. Nat. Methods 9, 671–675. https
://doi.org/10.1038/nmeth.2089 (2012).
27. Daqing Piao, J. W. R. et al. In vivo percutaneous reflectance spectroscopy of fatty liver development in rats suggests that the eleva-
tion of the scattering power is an early indicator of hepatic steatosis. J. Innov. Opt. Health Sci. 11, 1850019 (2018).
28. Matthews, D. R. et al. Homeostasis model assessment: Insulin resistance and beta-cell function from fasting plasma glucose and
insulin concentrations in man. Diabetologia 28, 412–419. https://doi.org/10.1007/bf00280883 (1985).
29. Chambers, A. P. et al. Weight-independent changes in blood glucose homeostasis after gastric bypass or vertical sleeve gastrectomy
in rats. Gastroenterology 141, 950–958. https://doi.org/10.1053/j.gastro.2011.05.050 (2011).
30. Rizzello, M. et al. Early postoperative insulin-resistance changes after sleeve gastrectomy. Obes. Surg. 20, 50–55. https://doi.
org/10.1007/s11695-009-0017-2 (2010).
31. Bojsen-Møller, K. N. et al. Early enhancements of hepatic and later of peripheral insulin sensitivity combined with increased
postprandial insulin secretion contribute to improved glycemic control after Roux-en-Y gastric bypass. Diabetes 63, 1725–1737.
https://doi.org/10.2337/db13-1307 (2014).
32. Hagopian, K., Ramsey, J. J. & Weindruch, R. Caloric restriction increases gluconeogenic and transaminase enzyme activities in
mouse liver. Exp. Gerontol. 38, 267–278. https://doi.org/10.1016/s0531-5565(02)00202-4 (2003).
33. Hagopian, K., Ramsey, J. J. & Weindruch, R. Influence of age and caloric restriction on liver glycolytic enzyme activities and
metabolite concentrations in mice. Exp. Gerontol. 38, 253–266. https://doi.org/10.1016/s0531-5565(02)00203-6 (2003).
34. Preidis, G. A., Kim, K. H. & Moore, D. D. Nutrient-sensing nuclear receptors PPARα and FXR control liver energy balance. J. Clin.
Investig. 127, 1193–1201. https://doi.org/10.1172/jci88893 (2017).
35. Zhang, Y. et al. Activation of the nuclear receptor FXR improves hyperglycemia and hyperlipidemia in diabetic mice. Proc. Natl.
Acad. Sci. USA 103, 1006–1011. https://doi.org/10.1073/pnas.0506982103 (2006).
36. Hagman, D. K. et al. The short-term and long-term effects of bariatric/metabolic surgery on subcutaneous adipose tissue inflam-
mation in humans. Metab. Clin. Exp. 70, 12–22. https://doi.org/10.1016/j.metabol.2017.01.030 (2017).
37. Frikke-Schmidt, H. et al. Weight loss independent changes in adipose tissue macrophage and T cell populations after sleeve gas-
trectomy in mice. Mol. Metab. 6, 317–326. https://doi.org/10.1016/j.molmet.2017.02.004 (2017).
38. Bradley, D. et al. Gastric bypass and banding equally improve insulin sensitivity and β cell function. J. Clin. Investig. 122, 4667–4674.
https://doi.org/10.1172/jci64895 (2012).
39. Rao, S. R. Inflammatory markers and bariatric surgery: A meta-analysis. Inflamm. Res. 61, 789–807. https://doi.org/10.1007/s0001
1-012-0473-3 (2012).
40. Srikakulapu, P. & McNamara, C. A. B lymphocytes and adipose tissue inflammation. Arterioscler. Thromb. Vasc. Biol. 40, 1110–1122.
https://doi.org/10.1161/atvbaha.119.312467 (2020).
41. Nishimura, S. et al. Adipose natural regulatory B cells negatively control adipose tissue inflammation. Cell Metab. 18, 759–766.
https://doi.org/10.1016/j.cmet.2013.09.017 (2013).
42. Ying, W. et al. Adipose tissue B2 cells promote insulin resistance through leukotriene LTB4/LTB4R1 signaling. J. Clin. Investig.
127, 1019–1030. https://doi.org/10.1172/jci90350 (2017).
Acknowledgements
This study was supported by a grant from the Korea Health Technology R&D Project through the Korea Health
Industry Development Institute (KHIDI), funded by the Ministry of Health and Welfare, Republic of Korea
(HI14C1277) and by Basic Science Research Program through the National Research Foundation of Korea (NRF)
funded by the Ministry of Education (2020R1A6A1A03047972).
Author contributions
C.H.A., J.I.K. and Y.M.C. conceived the idea and experimental design of the study. C.H.A. and E.H.C. performed
animal experiments. C.H.A., H.L. and W.L. performed RNA sequencing analysis and following bioinformatic
analysis. C.H.A. and Y.M.C. drafted the manuscript. All authors read and approved the final manuscript.
Competing interests
The authors declare no competing interests.
Additional information
Supplementary Information The online version contains supplementary material available at https://doi.
org/10.1038/s41598-021-81866-5.
Correspondence and requests for materials should be addressed to Y.M.C.
Reprints and permissions information is available at www.nature.com/reprints.
Publisher’s note Springer Nature remains neutral with regard to jurisdictional claims in published maps and
institutional affiliations.
Scientific Reports | (2021) 11:2310 | https://doi.org/10.1038/s41598-021-81866-5 10
Vol:.(1234567890)www.nature.com/scientificreports/
Open Access This article is licensed under a Creative Commons Attribution 4.0 International
License, which permits use, sharing, adaptation, distribution and reproduction in any medium or
format, as long as you give appropriate credit to the original author(s) and the source, provide a link to the
Creative Commons licence, and indicate if changes were made. The images or other third party material in this
article are included in the article’s Creative Commons licence, unless indicated otherwise in a credit line to the
material. If material is not included in the article’s Creative Commons licence and your intended use is not
permitted by statutory regulation or exceeds the permitted use, you will need to obtain permission directly from
the copyright holder. To view a copy of this licence, visit http://creativecommons.org/licenses/by/4.0/.
© The Author(s) 2021
Scientific Reports | (2021) 11:2310 | https://doi.org/10.1038/s41598-021-81866-5 11
Vol.:(0123456789)You can also read