Multi phenotype genome wide association studies of the Norfolk Island isolate implicate pleiotropic loci involved in chronic kidney disease - Nature
←
→
Page content transcription
If your browser does not render page correctly, please read the page content below

www.nature.com/scientificreports
OPEN Multi‑phenotype genome‑wide
association studies of the Norfolk
Island isolate implicate pleiotropic
loci involved in chronic kidney
disease
Ngan K. Tran1,9, Rodney A. Lea1,9, Samuel Holland2, Quan Nguyen2, Arti M. Raghubar2,
Heidi G. Sutherland1, Miles C. Benton3, Larisa M. Haupt1, Nicholas B. Blackburn4,5,6,
Joanne E. Curran4,5, John Blangero4,5, Andrew J. Mallett2,7,8 & Lyn R. Griffiths1*
Chronic kidney disease (CKD) is a persistent impairment of kidney function. Genome-wide association
studies (GWAS) have revealed multiple genetic loci associated with CKD susceptibility but the
complete genetic basis is not yet clear. Since CKD shares risk factors with cardiovascular diseases and
diabetes, there may be pleiotropic loci at play but may go undetected when using single phenotype
GWAS. Here, we used multi-phenotype GWAS in the Norfolk Island isolate (n = 380) to identify new
loci associated with CKD. We performed a principal components analysis on different combinations
of 29 quantitative traits to extract principal components (PCs) representative of multiple correlated
phenotypes. GWAS of a PC derived from glomerular filtration rate, serum creatinine, and serum urea
identified a suggestive peak (pmin = 1.67 × 10⁻⁷) that mapped to KCNIP4. Inclusion of other secondary
CKD measurements with these three kidney function traits identified the KCNIP4 locus with GWAS
significance (pmin = 1.59 × 10⁻⁹). Finally, we identified a group of two SNPs with increased minor allele
frequencies as potential functional variants. With the use of genetic isolate and the PCA-based multi-
phenotype GWAS approach, we have revealed a potential pleotropic effect locus for CKD. Further
studies are required to assess functional relevance of this locus.
Chronic kidney disease (CKD) is the gradual deterioration of kidney function or structure over at least 3 months1.
CKD can result in end-stage kidney disease (ESKD) whereby kidney replacement therapy is required. CKD preva-
lence and burden is steadily rising, with an estimated 10–15% of the world’s population a ffected2. Increased serum
ysfunction3. The best current marker of
levels of creatinine, cystatin C or urea are often used to indicate kidney d
CKD is glomerular filtration rate (GFR), which can be directly measured using exogeneous markers or estimated
(eGFR) based on concentrations of endogenous filtration markers such as serum creatinine or cystatin C 4.
The pathophysiology underlying CKD is not yet fully understood, which has hindered the early detection
and prevention of CKD as well as development of effective therapeutic treatments. Genome-wide association
studies (GWAS) have identified a number of loci in relation to CKD, eGFR or complementary biomarkers, e.g.
serum creatinine and blood urea5–8. A recent GWAS meta-analysis of eGFR (n = 765,348) identified 308 associ-
ated loci, which together explained 19.6% of eGFR heritability5. In addition, the GWASs to date have mostly
1
School of Biomedical Sciences, Centre for Genomics and Personalised Health, Genomics Research Centre, Institute
of Health and Biomedical Innovation, Queensland University of Technology (QUT), 60 Musk Ave., Kelvin Grove,
QLD 4059, Australia. 2Institute for Molecular Bioscience & Faculty of Medicine, The University of Queensland,
Brisbane, QLD, Australia. 3Institute of Environmental Science and Research, Kenepuru, New Zealand. 4School of
Medicine, South Texas Diabetes and Obesity Institute, The University of Texas Rio Grande Valley, Brownsville, TX,
USA. 5Department of Human Genetics, School of Medicine, The University of Texas Rio Grande Valley, Brownsville,
TX, USA. 6Menzies Institute for Medical Research, University of Tasmania, Hobart, TAS, Australia. 7Department
of Renal Medicine, Townsville University Hospital, Townsville, QLD, Australia. 8College of Medicine & Dentistry,
James Cook University, Townsville, QLD, Australia. 9These authors contributed equally: Ngan K. Tran and Rodney
A. Lea. *email: lyn.griffiths@qut.edu.au
Scientific Reports | (2021) 11:19425 | https://doi.org/10.1038/s41598-021-98935-4 1
Vol.:(0123456789)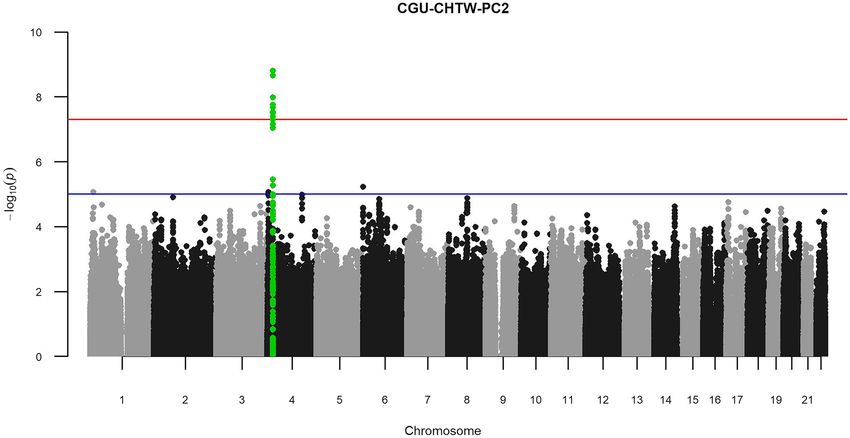
www.nature.com/scientificreports/
focused on populations with European ancestry, hence the complete genetic architecture underlying CKD has
not yet been established2.
Other chronic disorders such as diabetes, high blood pressure, and obesity exhibit co-morbidity with C KD9,10.
Furthermore, many endophenotypes for CKD risk exhibit substantial intercorrelation. This suggests that a genetic
commonality, perhaps acting via pleiotropic mechanisms, may play a role in CKD and related disorders. This
is supported by a phenome-wide association study (PheWAS) that revealed association of eGFR index SNPs
with 7 phenotypes out of 23 cardiovascular and diabetes-related t raits11. Principal component analysis (PCA) of
multiple correlated quantitative endophenotypes can capture important underlying structure in the phenotypic
data, which when analysed as outcomes in GWASs may reveal loci that would remain undetected when traits
are analysed individually. Avery et al.12 sucessfully identified three new loci associated with multiple-phenotype
domains of metabolic syndrome by using the PCA-based GWAS approach. Applying the same method, Fatumo
et al.13 identified new susceptibility genes for blood cell traits that were not identified in the standard univari-
ate GWAS. Thus, investigating multiple CKD-related phenotypes via PCA might reveal new insights into the
genetic basis of CKD.
The use of genetically isolated populations can empower genetic mapping studies of complex traits. Genetic
isolates are often defined by founder effects resulting in reduced genetic diversity and increased frequency of
variants that are rare in other p opulations14. Norfolk Island (NI) is a small and remote island located in the
Pacific Ocean and is about 1400 km off the east coast of mainland Australia. Most of the modern-day Norfolk
Island population are direct descendants of 11 European Mutineers of the HMS Bounty and 6 Polynesian women
from the late eighteenth century. Thus, the NI population now exhibits founder effects, admixture and increased
homozygosity. For almost 20 years, the NI isolate has been a valuable resource for genetic r esearch15–19. Notably,
a study of multiple cardiovascular disease (CVD) risk traits in the NI cohort group identified a potential pleio-
tropic effect locus on chromosome 1p22.2. This locus was only revealed from a GWAS of a multiple quantitative
endophenotypes for C VD19.
In this study, we performed a GWAS of multiple phenotypes in 380 individuals of the NI isolate with the aim
of identifying pleiotropic loci associated with CKD. The phenotypes included for CKD were primary traits, i.e.
creatinine-based eGFR, serum creatinine level, and serum urea level, as well as 26 secondary phenotypes includ-
ing anthropometric and biochemical measurements. We applied PCA on the 3 CKD-primary traits to identify
components representing covariance among them and then performed GWAS on the principal components
yielding statistically significant heritability. We also included 26 secondary CKD traits into the analysis based on
correlation clusters and combined these with the primary traits to perform the same PCA and GWAS workflow.
As a result, we were able to identify variants in the KCNIP4 gene, which encodes for the Potassium Voltage-Gated
(Kv) channel-interacting protein 4, as a potential pleiotropic locus of CKD. In addition, we also identified two
SNPs with MAFs substantially enriched in NI isolate to be the potential functional variants.
Results
Epidemiology of CKD risk in NI. To compare eGFR levels of the NI isolate to those of other populations,
we obtained CKD-related phenotypic data from the UK Biobank20 (UKBB) (Fig. 1). The number of individuals
and age range in each ethnicity can be found in Supplementary Table S1. To ensure the NI data was compa-
rable to the UKBB data in terms of age range we included only NI individuals aged between 40 and 70 years,
comprising 278 samples. Out of all the populations, the NI isolate exhibited the lowest eGFR profile (Fig. 1a).
Further examination of eGFR that was less than 60 mL/min/1.73 m2, a level indicative of reduced kidney func-
tion, showed the NI cohort as the population with the highest proportion in this category (Fig. 1b). Collectively,
eGFR levels in the NI isolate indicated a very high degree of potential kidney disease prevalence when compared
to other world populations. Importantly, the actual prevalence of CKD in NI may be even higher as individuals
with end-stage renal disease leave the island for mainland Australia to receive treatments such as renal transplant
or dialysis.
The high rate of reduced kidney function observed in the NI isolate may also reflect the influence of Polyne-
sian ancestry in the gene pool. We note that there is not comparable eGFR data available for Polynesian popula-
tions, however, many studies have shown that the prevalence of ESKD is much higher in Polynesian populations
in comparison to E uropeans21.
Single phenotype analysis. Serum creatinine, eGFR, and serum urea were 3 CKD-primary traits avail-
able in the NI isolate phenotypic collection. According to the literature22, heritability estimates of eGFR, serum
urea, and serum creatinine were 44%, 31%, and 37% respectively. In our study, these traits showed lower herit-
ability estimates, ranging from 0.27 to 0.3 (P < 0.05) (Supplementary Table S2). GWAS of these individual traits
did not identify loci passing the genome-wide significance P-value threshold (results not shown).
Principal components of the 3 CKD‑primary traits. A PCA of serum creatinine, eGFR, and serum
urea (CGU) generated 3 principal components (PC): CGU-PC1, CGU-PC2, and CGU-PC3 (Table 1). CGU-
PC1 explained approximately two thirds of the total variance. For this component, serum creatinine and serum
urea were found to be highly correlated to each other, but both were negatively correlated to eGFR. In relation
to kidney diseases, low eGFR and high serum urea and creatinine levels are indicative of impaired kidney func-
tion. CGU-PC2 was also significantly correlated to all the 3 traits, with a particularly high contribution from
serum urea levels; samples with high CGU-PC2 scores exhibited high serum urea, but relatively normal levels of
creatinine and eGFR. As for the last component, CGU-PC3 accounted for the positive correlation between eGFR
and creatinine, without inclusion of urea. The individual component map under CGU-PC1 and CGU-PC2 is
illustrated in Supplementary Fig. S1.
Scientific Reports | (2021) 11:19425 | https://doi.org/10.1038/s41598-021-98935-4 2
Vol:.(1234567890)
www.nature.com/scientificreports/
Figure 1. Comparison of eGFR in NI isolate to those of other populations. (a) Distributions of eGFR in NI
isolate and other populations. There were statistically significant differences between mean of eGFR in NI
compared to those of other population (adjusted P-values < 2e−13). (b) Proportion of people with reduced
kidney function (eGFR < 60 mL/min/1.73 m 2) in each population. Data are represented as the percentage ± SE.
Loadings Heritability
Principal component % Variance eGFR Serum creatinine Serum urea h2 P-value
CGU-PC1 66 − 0.600 0.607 0.522 0.33 7.75 × 10⁻⁴
CGU-PC2 21.1 0.406 − 0.331 0.852 0.26 6.66 × 10⁻³
CGU-PC3 12.9 0.690 0.723 − 0.048 0.12 1.35 × 10⁻¹
Table 1. Statistics of principal components extracted from eGFR, serum creatinine, and serum urea.
Scientific Reports | (2021) 11:19425 | https://doi.org/10.1038/s41598-021-98935-4 3
Vol.:(0123456789)www.nature.com/scientificreports/
Figure 2. Manhattan plot for CGU-PC1 extracted from the 3 CKD primary traits. The red line indicates
genome-wide significance threshold of 5 × 10⁻⁸, while the blue line indicates the suggestive threshold of 1 × 10⁻⁵.
CGU—serum creatinine, eGFR, and serum urea.
Principal component Chr. SNP BP A1 A2 Freq. Beta P-value Gene
CGU-AT-PC3 2 rs17863787 233,702,448 G T 0.314 0.603 1.18 × 10⁻¹³ UGT1A8
CGU-BH-PC1 4 rs12640604 20,999,244 A G 0.355 − 0.347 3.37 × 10⁻⁸ KCNIP4
CGU-CHTW-PC2 4 rs12640604 20,999,244 A G 0.355 − 0.448 1.59 × 10⁻⁹ KCNIP4
Table 2. Combination PCs with genome-wide significant association peaks.
Heritability and GWAS analysis of CKD components. Heritability estimation showed that only CGU-
PC1 and CGU-PC2 had statistically significant heritability of 0.26 and 0.33, respectively (P < 0.05).
GWASs of CGU-PC1 and CGU-PC2 did not identify any genome-wide significant loci. However, there was
a cluster of SNPs mapped to the KCNIP4 gene on chromosome 4 forming a clear GWAS peak for CGU-PC1
(Fig. 2, lead SNP rs12640604-A, MAF = 0.355, beta = − 0.344, se = 0.066, P = 1.67 × 10⁻⁷). Given the high capacity
of CGU-PC1 in explaining kidney dysfunction and the negative effect size of the lead SNP, the identified KCNIP4
locus could be relevant in decreased susceptibility of CKD.
Combinations of the 3 CKD traits and other measurements. Following analysis of the three pri-
mary CKD traits, we expanded the analysis to include other CKD-secondary phenotypes. Along with eGFR,
serum creatinine, and serum urea, there were 26 other continuous measurements that were assessed (Supple-
mentary Table S3).
Whether negatively or positively, correlated traits tend to gather into the same PCs. Therefore, we first clus-
tered all the 29 continuous traits into groups based on significant bivariate correlations (P ≤ 0.05, Supplementary
Table S4). Phenotypic traits indicative for specific metabolic functions were highly correlated to each other. For
example, the three liver enzyme measurements: alkaline phosphatase, alanine aminotransferase, and gamma-
glutamyl transferase all clustered into the same group. We also included the three CKD-primary phenotypes in
the correlation analysis to see their relationships to each other and to the remaining phenotypes. The three traits
clustered well into a single group as they are the biomarkers of renal function. The clusters were then combined
with the three CKD-primary traits for PCA as well as further downstream analyses.
In total, there were ten combinations included for further analyses (Supplementary Table S4). From a total
of 58 generated combination PCs, 30 showed statistically significant heritability estimates and significant asso-
ciation peaks were identified in three PCs (Table 2). Notably, the KCNIP4 gene was identified in two of those.
Specifically, a KCNIP4 association was found in PCs extracted from the three CKD-primary traits combined with
other secondary traits as follows: total cholesterol (TC)/HDL-C ratio, HDL, triglyceride, and waist hip ratio (i.e.
CGU-CHTW-PC2); body fat and height (i.e. CGU-BH-PC1). Of note, the association of KCNIP4 in the CGU-
CHTW-PC2 combination was identified with the the lowest P-value of p min = 1.59 × 10⁻⁹ (Fig. 3).
Scientific Reports | (2021) 11:19425 | https://doi.org/10.1038/s41598-021-98935-4 4
Vol:.(1234567890)www.nature.com/scientificreports/
Figure 3. Manhattan plot for CGU-CHTW-PC2 showing KCNIP4 peak with higher significance than in
the GWAS of CGU-PC1. The red line indicates the genome-wide significance threshold of 5 × 10⁻⁸, while the
blue line indicates the suggestive threshold of 1 × 10⁻⁵. CGUserum creatinine, eGFR, and serum urea, CHTW
cholesterol HDL-C ratio, HDL-cholesterol, triglyceride, and waist hip ratio.
Further analysis of the index SNP (rs12640604) with all the 29 phenotypic traits showed this locus to be
highly associated with eGFR, creatinine, and urea (Supplementary Fig. S2). The inclusion of more correlated
traits in PCs might increase the statistical power to identify susceptible loci in GWAS. We examined the trait
correlation with component variables in each PC (Supplementary Table S5). CGU-PC1, CGU-CHTW-PC2, and
CGU-BH-PC1 all had very similar contributions to the three CKD-primary traits, i.e. the PCs were all positively
correlated to serum creatinine and eGFR as well as negatively correlated to serum urea. We looked at other PCs
with similar profiles. Interestingly, we found that the sum of all the correlation coefficients was highly correlated
to the corresponding GWAS P-value (Supplementary Fig. S3). Therefore, the observed increase in the statistical
power to identify loci can be attributed to the decrease in total correlation coefficients in the PCs. Conversely,
some trait combinations, e.g. BMI, hip circumference, waist circumference, and weight (CGU-BHWW-PC1 in
Supplementary Table S5), when added to the three CKD-primary traits increased the sum of all the correlation
coefficients between the variables and the PCs, and hence resulted in a high GWAS P-value. It should also be
noted that the increased power achieved was not due to increased heritability of the combined PCs (Pearson
correlation = − 0.29).
The inclusion of both serum creatinine and eGFR in all the PCAs was unnecessary as eGFR was estimated
from creatinine, along with age and sex information. We examined whether removing serum creatinine out
of the PCAs would alter the GWAS results. Consequently, the KCNIP4 peak was still detected and rs12640604
continued to be the most significant SNP in all of these additional GWASs (Supplementary Table S6).
Along with KCNIP4, we also identified suggestive genome-wide significance at the UGT1A8 locus in the
GWAS of CGU-AT-PC3 (derived from the three CKD-primary traits, albumin, and total bilirubin). UGT1A8 is
an established bilirubin-associated gene.
Replication analysis. We utilized the UKBB data to test for replication of the association between the index
SNP for KCNIP4 gene (rs12640604) and CGU-PC1 extracted from the three CKD-primary traits. The UKBB
is comprised of multiple different ethnic (and ancestral) subgroups and these were analyzed separately (Sup-
plementary Table S7). The MAF for rs12640604 in each of the UKBB ethnicities are shown in Table 3 and were
not substantively different to NI. In each subgroup, CGU-PC1 was newly constructed using the same formula
developed for the NI cohort. Similar to the CGU-PC1 in the NI isolate, all the components in the UKBB popu-
lations were positively correlated to serum creatinine and urea, while negatively correlated to eGFR (Table 3).
In the Caribbean and Indian subgroups, rs12640604-A and CGU-PC1 showed some evidence of association
(P-values < 0.05). However, the effect size in the NI isolate (beta = − 0.313 and P-value = 1.38 × 10⁻⁶) was several
times higher than those in the Caribbean and Indian. Finally, only the Indian subgroup effect size was in the
same direction as that in the NI isolate. Of note, the index SNP showed some evidence for association to the
individual CKD traits in several subgroups (P < 0.05) although the modest level of statistical significance would
not implicate this SNP in large GWASs.
Scientific Reports | (2021) 11:19425 | https://doi.org/10.1038/s41598-021-98935-4 5
Vol.:(0123456789)www.nature.com/scientificreports/
Loadings Association with rs12640604-A
Principal components eGFR Creatinine Urea Allele frequency BETA P
African-CGU-PC1 − 0.577 0.598 0.556 0.614 – –
British-CGU-PC1 − 0.605 0.6 0.524 0.379 – –
Caribbean-CGU-PC1 − 0.581 0.6 0.55 0.578 0.064 0.047
Chinese-CGU-PC1 − 0.599 0.598 0.533 0.388 – –
Indian-CGU-PC1 − 0.591 0.59 0.55 0.274 − 0.07 0.022
Irish-CGU-PC1 − 0.604 0.599 0.526 0.386 – –
Pakistani-CGU-PC1 − 0.602 0.608 0.518 0.258 – –
Table 3. Association analyses of rs12640604-A and in UKBB data and CGU-PC1 in each UKBB subgroup. (–)
Association results with P-values > 0.05.
Compared to the index SNP
rs12640604
ID Chr. Position Ref Alt Distance R2 D’
rs148583816 4 20,999,427 G T 183 0.3363 0.6434
rs143182955 4 20,999,431 G T 187 0.2492 0.5334
MAF in the UK biobank
ID MAF in the NI isolate British Chinese Irish Indian Caribbean African Pakistani
rs148583816 0.458 0.044 0.048 0.043 0.043 0.092 0.093 0.04
rs143182955 0.443 0.044 0.039 0.04 0.026 0.015 0.012 0.026
Table 4. Statistics of the two potential functional SNPs.
Potential functional variants in KCNIP4. In the NI cohort we identified 8940 SNPs spanning KCNIP4
of which, there were 47 SNPs that exhibited some LD ( R2 > 0.2) with the index SNP (rs12640604). These SNPs
showed MAFs ranging from 0.146 to 0.491. Comparison with the MAFs taken from the UKBB, in which 46
SNPs were available, showed that most of the SNPs had comparable MAFs to NI cohort (the ratios of NI MAFs
to the UKBB MAFs ranged from 0.6 to 2.3). In contrast, two SNPs (rs148583816 and rs143182955), which are a
few base pairs apart from one another, have MAFs approximately tenfold higher than their MAFs in NI isolate
(Table 4). These SNPs were part of an LD region spanning approximately 37.8 Mb in the NI cohort. However, in
the UKBB, rs148583816 and rs143182955 were not in LD (LD < 0.2) with the index SNP.
Examining these 2 SNPs in the UCSC Genome B rowser23, we observed that they are located on a T-enriched
region and coincided with a histone modification H3K4me3. H3K4me3, or tri-methylation of lysine 4 on his-
tone H3, is a chromatin modification at the transcription start site and its level is positively associated with
transcription24. For KCNIP4, several transcripts have been identified, some of which are expressed in the human
kidney25. Interestingly, the associated SNPs are located on the promoter region of isoform KCNIP4-IeΔII which
is one of the transcripts expressed in the kidney along with KCNIP4-IbΔII and KCNIP4-IcΔII. Taken together,
these SNPs may play a regulatory role in KCNIP4 gene expression due to founder effect in NI.
Spatial gene expression of KCNIP4. Using Visium Spatial Gene Expression (10 × Genomics), we local-
ized the expression of KCNIP4 gene to the tubules, in both non-scarred and scarred human cortical kidney tissue
sections (Fig. 4). Furthermore, we found no expression of the KCNIP4 gene in the glomeruli or vasculature of the
non-scarred and scarred human kidney tissue sections.
Discussion
For the past decade, multiple genetic loci associated with kidney function have been identified via GWAS.
However, the genetic basis of CKD is still not completely understood and requires a range of approaches to
tackle the problem. In this study, we aimed to identify novel susceptible loci underlying kidney function using a
multi-phenotype approach in combination with the use of the genetically isolated cohort of Norfolk Island (NI).
As a result, the KCNIP4 locus was identified in principal component traits derived from three CKD-primary
traits as well as with various secondary trait combinations. The three derived composite phenotypes, i.e. CGU-
PC1, CGU-BH-PC1, and CGH-CHTW-PC2, have encapsulated information that were not entirely expressed
in the individual traits, hence, we were able to identify the KCNIP4 locus in these components but not in any
single-phenotype.
The gene KCNIP4 which encodes for the Potassium Voltage-Gated (Kv) channel-interacting protein 4 has
several transcripts with varied cellular expressions, and potentially different protein functions. In kidney, the
three active transcripts are KCNIP4-IbΔII, KCNIP4-IcΔII, and KCNIP4-IeΔII25. Previously, the disruption of
KCNIP4 has been observed in patients with renal-cell carcinoma. This is possibly due to alteration of the normal
transcriptional regulation since the breakpoint interval coincides with the promoter of transcript KCNIP4-IcΔII26.
Scientific Reports | (2021) 11:19425 | https://doi.org/10.1038/s41598-021-98935-4 6
Vol:.(1234567890)www.nature.com/scientificreports/
Figure 4. Spatial gene expression of KCNIP4 in human cortical kidney tissue sections. We localized KCNIP4
gene expression within the tubules of both sample one, composed of non-scarred (green) and scarred cortical
regions and sample two, composed of non-scarred cortical region.
In our study, the associated SNPs were located in the region corresponding to the promoter of the transcript
KCNIP4-IeΔII, hence the associated variants may have a regulatory role in gene expression. In a recent publica-
tion, Gerhardt et al.27 found that KCNIP4 was markedly up-regulated at the late injury stage in proximal tubule
cells in an ischemia–reperfusion injury model for studying acute kidney injury (AKI). Kidney proximal tubule
is particularly vulnerable to injury and maladaptive repair of injured tubules after AKI can lead to C KD28,29.
Therefore, the up-regulation of KCNIP4 can be one of the factors involved in the consistent impairment of the
proximal tubule in kidney injury. In support of this we were also able to identify spatial gene expression of
KCNIP4 in two human cortical kidney tissue sections. In these samples, KCNIP4 expression was localized to the
tubules, with no expression in the glomeruli or vasculature of the cortical kidney tissue.
To pinpoint the potential regulatory SNPs, we analyzed all the SNPs in LD with the index SNP and found two
nearby SNPs with MAFs much greater in NI isolate compared to other world populations. Consistent with the
hypothesis that the associated SNPs involved in transcriptional regulation, this group was in a region where the
histone modification H3K4me3 occurred. The founder effect of NI isolate, along with the high inbreeding rate,
has mostly likely increased the frequencies of these alleles, which in turn has increased the power to detect the
association relative to other major ancestral populations.
One of the limitations of the study was the lack of urine biomarkers for measuring albuminuria, which are
especially important to detect CKD when eGFR is in normal r ange3. However, because the initial aim of the
Norfolk Island Health Study (NIHS) was to study cardiovascular diseases, only serum biomarkers were collected.
Also, the inclusion of both eGFR and serum creatinine in PCA was not entirely justified because these were highly
correlated variables i.e. eGFR was calculated based on serum creatinine, age, and sex. However, the exclusion of
serum creatinine did not alter the current findings.
In conclusion, the use of the NI genetic isolate in combination with the PCA-based multi-phenotype approach
revealed the KCNIP4 locus to be associated with CKD. Two associated variants which minor allele frequencies
that were about tenfold higher in the NI isolate than in other world populations potentially play a regulatory role
in the KCNIP4 gene expression. Further studies are needed to assess the biological functions of the identified
variants in relation to CKD.
Materials and methods
Norfolk Island Health Study. The Norfolk Island Health Study (NIHS) is a well-established study aimed
at identifying genetic and environmental risk factors for CVD and related d iseases16,17,30.
In this study, we included 380 individuals with available genomic and phenotypic data. These individuals
consisted of 196 females (mean age: 49.8 ± 16.5) and 184 males (mean age: 47.1 ± 15.3) all of whom were members
of the core-pedigree and at least 18 years of age at the time of collection. Serum samples were drawn from each
individual to measure serum biomarkers as well as to collect blood-based DNA.
Ethical approval was granted prior to the commencement of the study by the Griffith University Human
Research Ethics Committee (approval no: 1300000485). Ethics approval and management of the NIHS has
since been transferred to Queensland University of Technology (approval no: 1600000464). All individuals
gave written informed consent prior to the study and all methods were carried out in accordance with relevant
guidelines and regulations.
Principal component analysis of CKD endophenotype data. In total there were 29 quantitative phe-
notypic traits (Supplementary Table S3) along with age and sex information of 380 NIHS individuals included
in this study. eGFR was calculated using the CKD-EPI Creatinine e quation31. Missing data were imputed using
Scientific Reports | (2021) 11:19425 | https://doi.org/10.1038/s41598-021-98935-4 7
Vol.:(0123456789)www.nature.com/scientificreports/
the MissMDA 1.3 p ackage32. The package can perform multiple imputation using principal component analysis
(PCA), meaning the imputed values will not affect PCA results.
After the imputation of missing data, the PCA method was applied to transform multi-dimensional data into
fewer components. PCA is one of the optimal approaches in multiphenotype analysis, especially in the case of
association studies33. Principal component (PC) analyses were performed with the package FactoMineR 1.4234,
which integrated multiple PCA exploratory methods and illustrations.
Genome‑wide SNP genotyping. NI genomic data were generated from two platforms: Illumina HiSeq
X10 sequencing (n = 108) and Illumina 610-Quad array (n = 506). Whole genome sequencing (WGS) directly
revealed nearly 20 million SNPs, while the SNP-array, which was imputed using the 1000 genomes project35 as a
reference, identified over 26 million SNPs. In total, genomic data was available for 520 individuals.
To merge the SNP-array and WGS data, the common SNPs across both data sets were identified, and data
associated with the common SNPs extracted. The merge procedure was performed using the default parameters
of the ‘bmerge’ function in PLINK 1.936. For overlapping individuals, WGS data was given preference such that
SNP-array data was removed.
Quality control filters were applied to the unified genomic data set to ensure high quality SNP data for
subsequent analysis. A P-value of 1.84 × 10⁻⁷ was applied as the HWE threshold—a specific value calculated to
account for widespread linkage disequilibrium in the NI cohort. A 5% missing genotyping filter was also applied
on individuals and variants to ensure high quality data for subsequent analysis. Finally, variants with a minor
allele frequency less than 0.05 and samples without phenotype data were removed. A total of 380 individuals
and 4,753,086 SNPs remained after filtering.
Heritability estimation. We utilized the SOLAR 8.5.1 p rogram37 to estimate heritability for each indi-
vidual trait and phenotypic PCs. The extended pedigree information of the NI i solate38 was integrated to account
for the high degree of relatedness among the samples. All traits and PCs with a high excess kurtosis were inverse-
normal transformed prior to heritability estimation.
Genome‑wide association analysis. Genome-wide association analysis (GWAS) was only performed
for traits that yielded heritability estimates that were statistically significant at a nominal level (P < 0.05). To
account for the family relatedness in association testing, we applied the mixed linear model, where a genetic
relationship matrix (GRM) containing all the genotype correlations between all pairs of individuals was fitted as
a random effect with age and sex fitted as additional fixed effects when computing the associations between phe-
notype and genetic markers. However, tested SNPs were excluded from calculating the GRM as implemented in
the GCTA-LOCO approach39 to avoid loss of power when double-fitting of the candidate variants in the model.
We examined the inclusion of principal components of all genotyped SNPs’ GRM as a common method to
address confounding due to population structure. PCA was performed with PLINK 1.9 and the first numbers of
PCs were included as covariates along with age and sex in the GWAS. We found that as more PCs were included,
the deflation in the statistics tests increased (Supplementary Fig. S5). However, further testing showed that the
association signal from the top (index) SNP was not appreciable changed by the inclusion of PCs 1 and 2 (Sup-
plementary Table S4). Given the modest sample size used in this study and the risk of overburdening the GWAS
model with covariates we chose to omit genomic PCs from the primary analysis.
We also applied a filter to remove loci due to spurious associations. Since there is extended LD present in
the NI cohort, we reasoned that associated SNPs would mostly be in LD with other associated SNPs located
nearby. Thus, significantly associated loci were deemed as those that passed the genome-wide significance P-value
threshold of 5 × 10⁻⁸, as well as having 2 or more variants within a 50 kb distance and with P-value ≤ 1 × 10⁻⁵. LD
tests were performed with PLINK 1.9.
Fine mapping. We used the WGS data of 108 NI samples to explore allele frequencies of variants that are
in LD with the GWAS most associated SNP rs12640604 at the KCNIP4 locus. Minor allele frequencies (MAFs)
of these SNPs were then compared to those in the gnomAD database (v3.1.1)40 and the UKBB data. Genes and
SNPs were visualized on the UCSC Genome Browser.
Visium spatial gene expression. Existing Visium spatial gene expression data of two human cortical
kidney tissue s ection41 were used to identify the spatial gene expression of KCNIP4. These data were visualized
using the gene_plot function of stLearn42 and compared to existing data from the Human Protein Atlas.
Replication analysis. We performed association analysis between the index SNP mapped to the KCNIP4
gene and CGU-PC1 extracted from the 3 CKD-primary traits in populations included in the UKBB20 data
(Supplementary Table S5). Serum creatinine and serum urea were available while creatinine-based eGFR was
calculated using the CKD-EPI formula31. CGU-PC1 were newly constructed for each sub-group. Genotypic
association analysis for each population was performed with simple linear models using the allele counts of
rs12640604-A as independent variable and CGU-PC1 as the outcomes.
Data availability
The genotypic and phenotypic data of the Norfolk Island isolate supporting the current study are not publicly
available due to ethics constraints but are available from the corresponding author on reasonable request.
Scientific Reports | (2021) 11:19425 | https://doi.org/10.1038/s41598-021-98935-4 8
Vol:.(1234567890)www.nature.com/scientificreports/
Received: 27 April 2021; Accepted: 14 September 2021
References
1. Levin, A. et al. Kidney disease: Improving global outcomes (KDIGO) CKD Work Group. KDIGO 2012 clinical practice guideline
for the evaluation and management of chronic kidney disease. Kidney Int. Suppl. 3, 1–150 (2013).
2. Levin, A. et al. Global kidney health 2017 and beyond: A roadmap for closing gaps in care, research, and policy. The Lancet 390,
1888–1917. https://doi.org/10.1016/S0140-6736(17)30788-2 (2017).
3. Romagnani, P. et al. Chronic kidney disease. Nat. Rev. Dis. Primers 3, 1–24. https://doi.org/10.1038/nrdp.2017.88 (2017).
4. Webster, A. C., Nagler, E. V., Morton, R. L. & Masson, P. Chronic kidney disease. The Lancet 389, 1238–1252. https://doi.org/10.
1016/S0140-6736(16)32064-5 (2017).
5. Wuttke, M. et al. A catalog of genetic loci associated with kidney function from analyses of a million individuals. Nat. Genet. 51,
957–972. https://doi.org/10.1038/s41588-019-0407-x (2019).
6. Hellwege, J. N. et al. Mapping eGFR loci to the renal transcriptome and phenome in the VA million veteran program. Nat. Com-
mun. 10, 1–11. https://doi.org/10.1038/s41467-019-11704-w (2019).
7. Morris, A. P. et al. Trans-ethnic kidney function association study reveals putative causal genes and effects on kidney-specific
disease aetiologies. Nat. Commun. 10, 1–14. https://doi.org/10.1038/s41467-018-07867-7 (2019).
8. Pattaro, C. et al. Genetic associations at 53 loci highlight cell types and biological pathways relevant for kidney function. Nat.
Commun. 7, 1–19. https://doi.org/10.1038/ncomms10023 (2016).
9. Parikh, N. I. et al. Cardiovascular disease risk factors in chronic kidney disease: Overall burden and rates of treatment and control.
Arch. Intern. Med. 166, 1884–1891. https://doi.org/10.1001/archinte.166.17.1884 (2006).
10. Jha, V. et al. Chronic kidney disease: Global dimension and perspectives. The Lancet 382, 260–272. https://doi.org/10.1016/S0140-
6736(13)60687-X (2013).
11. Graham, S. E. et al. Sex-specific and pleiotropic effects underlying kidney function identified from GWAS meta-analysis. Nat.
Commun. 10, 1–9. https://doi.org/10.1038/s41467-019-09861-z (2019).
12. Avery, C. L. et al. A phenomics-based strategy identifies loci on APOC1, BRAP, and PLCG1 associated with metabolic syndrome
phenotype domains. PLoS Genet. 7, e1002322. https://doi.org/10.1371/journal.pgen.1002322 (2011).
13. Fatumo, S. et al. Complimentary methods for multivariate genome-wide association study identify new susceptibility genes for
blood cell traits. Front. Genet. https://doi.org/10.3389/fgene.2019.00334 (2019).
14. Hatzikotoulas, K., Gilly, A. & Zeggini, E. Using population isolates in genetic association studies. Brief. Funct. Genom. 13, 371–377.
https://doi.org/10.1093/bfgp/elu022 (2014).
15. Bellis, C. et al. Phenotypical characterisation of the isolated Norfolk Island population focusing on epidemiological indicators of
cardiovascular disease. Hum. Hered. 60, 211–219. https://doi.org/10.1159/000090545 (2005).
16. Cox, H. C. et al. Principal component and linkage analysis of cardiovascular risk traits in the Norfolk isolate. Hum. Hered. 68,
55–64. https://doi.org/10.1159/000210449 (2009).
17. Benton, M. C. et al. Mapping eQTLs in the Norfolk Island genetic isolate identifies candidate genes for CVD risk traits. Am. J.
Hum. Genet. 93, 1087–1099. https://doi.org/10.1016/j.ajhg.2013.11.004 (2013).
18. Benton, M. C. et al. Methylome-wide association study of whole blood DNA in the Norfolk Island isolate identifies robust loci
associated with age. Aging (Albany NY) 9, 753–768. https://doi.org/10.18632/aging.101187 (2017).
19. Benton, M. C. et al. A phenomic scan of the norfolk island genetic isolate identifies a major pleiotropic effect locus associated with
metabolic and renal disorder markers. PLoS Genet. 11, e1005593. https://doi.org/10.1371/journal.pgen.1005593 (2015).
20. Bycroft, C. et al. The UK biobank resource with deep phenotyping and genomic data. Nature 562, 203–209. https://doi.org/10.
1038/s41586-018-0579-z (2018).
21. Walker, R. J., Tafunai, M. & Krishnan, A. Chronic kidney disease in New Zealand Māori and Pacific people. Semin. Nephrol. 39,
297–299. https://doi.org/10.1016/j.semnephrol.2019.03.001 (2019).
22. Zhang, J., Thio, C. H. L., Gansevoort, R. T. & Snieder, H. Familial aggregation of CKD and heritability of kidney biomarkers in the
general population: The lifelines cohort study. Am. J. Kidney Dis. 77, 869–878. https://doi.org/10.1053/j.ajkd.2020.11.012 (2021).
23. Karolchik, D. et al. The UCSC genome browser database. Nucleic Acids Res. 31, 51–54. https://doi.org/10.1093/nar/gkg129 (2003).
24. Howe, F. S., Fischl, H., Murray, S. C. & Mellor, J. Is H3K4me3 instructive for transcription activation? BioEssays 39, e201600095.
https://doi.org/10.1002/bies.201600095 (2017).
25. Pruunsild, P. & Timmusk, T. Structure, alternative splicing, and expression of the human and mouse KCNIP gene family. Genomics
86, 581–593. https://doi.org/10.1016/j.ygeno.2005.07.001 (2005).
26. Bonne, A. et al. Mapping of constitutional translocation breakpoints in renal cell cancer patients: Identification of KCNIP4 as a
candidate gene. Cancer Genet. Cytogenet. 179, 11–18. https://doi.org/10.1016/j.cancergencyto.2007.07.005 (2007).
27. Gerhardt, L. M., Liu, J., Koppitch, K., Cippà, P. E. & McMahon, A. P. Single-nuclear transcriptomics reveals diversity of proximal
tubule cell states in a dynamic response to acute kidney injury. Proc. Natl. Acad. Sci. 118, e2026684118. https://doi.org/10.1073/
pnas.2026684118 (2021).
28. Liu, B.-C., Tang, T.-T., Lv, L.-L. & Lan, H.-Y. Renal tubule injury: A driving force toward chronic kidney disease. Kidney Int. 93,
568–579. https://doi.org/10.1016/j.kint.2017.09.033 (2018).
29. Chevalier, R. L. The proximal tubule is the primary target of injury and progression of kidney disease: Role of the glomerulotubular
junction. Am. J. Physiol. Renal Physiol. 311, F145–F161. https://doi.org/10.1152/ajprenal.00164.2016 (2016).
30. McEvoy, B. et al. European and Polynesian admixture in the Norfolk Island population. Heredity (Edinb.) 105, 229–234. https://
doi.org/10.1038/hdy.2009.175 (2010).
31. Levey, A. S. et al. A new equation to estimate glomerular filtration rate. Ann. Intern. Med. 150, 604–612. https://doi.org/10.7326/
0003-4819-150-9-200905050-00006 (2009).
32. Josse, J. & Husson, F. missMDA: A package for handling missing values in multivariate data analysis. J. Stat. Softw. 70, 1–31. https://
doi.org/10.18637/jss.v070.i01 (2016).
33. Suo, C. et al. Analysis of multiple phenotypes in genome-wide genetic mapping studies. BMC Bioinform. 14, 151. https://doi.org/
10.1186/1471-2105-14-151 (2013).
34. Lê, S., Josse, J. & Husson, F. FactoMineR: An R package for multivariate analysis. J. Stat. Softw. 25, 1–18. https://doi.org/10.18637/
jss.v025.i01 (2008).
35. Genomes Project Consortium. A global reference for human genetic variation. Nature 526, 68–74. https://doi.org/10.1038/natur
e15393 (2015).
36. Purcell, S. et al. PLINK: A tool set for whole-genome association and population-based linkage analyses. Am. J. Hum. Genet. 81,
559–575. https://doi.org/10.1086/519795 (2007).
37. Almasy, L. & Blangero, J. Multipoint quantitative-trait linkage analysis in general pedigrees. Am. J. Hum. Genet. 62, 1198–1211.
https://doi.org/10.1086/301844 (1998).
38. Macgregor, S. et al. Legacy of mutiny on the bounty: Founder effect and admixture on Norfolk Island. Eur. J. Hum. Genet. 18,
67–72. https://doi.org/10.1038/ejhg.2009.111 (2010).
Scientific Reports | (2021) 11:19425 | https://doi.org/10.1038/s41598-021-98935-4 9
Vol.:(0123456789)www.nature.com/scientificreports/
39. Yang, J., Zaitlen, N. A., Goddard, M. E., Visscher, P. M. & Price, A. L. Advantages and pitfalls in the application of mixed-model
association methods. Nat. Genet. 46, 100–106. https://doi.org/10.1038/ng.2876 (2014).
40. Karczewski, K. J. et al. The mutational constraint spectrum quantified from variation in 141,456 humans. Nature 581, 434–443.
https://doi.org/10.1038/s41586-020-2308-7 (2020).
41. Raghubar, A. M. et al. Spatially resolved transcriptome profiles of mammalian kidneys illustrate the molecular complexity of
functional nephron segments, cell-to-cell interactions and genetic variants. BioRxiv. https://doi.org/10.1101/2020.09.29.31791
7v1 (2020).
42. Pham, D. T. et al. stLearn: Integrating spatial location, tissue morphology and gene expression to find cell types, cell-cell interac-
tions and spatial trajectories within undissociated tissues. BioRxiv. https://doi.org/10.1101/2020.05.31.125658v1 (2020).
Acknowledgements
We acknowledge and thank the Norfolk Island participants for their ongoing involvement in this research. This
work was supported by funding from the Australian National Health and Medical Research Council (NHMRC)
project Grant [APP1083450 to LRG] and by an Australian International Science Linkages grant and by infra-
structure purchased with Australian Government EIF Super Science Funds as part of the Therapeutic Innovation
Australia—Queensland Node. The funders had no role in study design, data collection and analysis, decision to
publish, or preparation of the manuscript.
Author contributions
N.K.T. was involved in study conception, performed statistical analysis, and manuscript writing. R.A.L. was
involved in study conception, results interpretation, and manuscript writing. S.H., Q.N. and A.M.R. performed
gene expression experiments and interpreted results. H.G.S. and L.M.H. performed DNA extraction and SNP
genotyping. M.C.B. performed initial SNP genotype QC and phenotype curation. N.B., J.E.C. and J.B. performed
replication analysis. A.J.M. performed clinical interpretation of results. L.R.G. involved in study conception,
project management, interpretation of results and manuscript writing.
Competing interests
The authors declare no competing interests.
Additional information
Supplementary Information The online version contains supplementary material available at https://doi.org/
10.1038/s41598-021-98935-4.
Correspondence and requests for materials should be addressed to L.R.G.
Reprints and permissions information is available at www.nature.com/reprints.
Publisher’s note Springer Nature remains neutral with regard to jurisdictional claims in published maps and
institutional affiliations.
Open Access This article is licensed under a Creative Commons Attribution 4.0 International
License, which permits use, sharing, adaptation, distribution and reproduction in any medium or
format, as long as you give appropriate credit to the original author(s) and the source, provide a link to the
Creative Commons licence, and indicate if changes were made. The images or other third party material in this
article are included in the article’s Creative Commons licence, unless indicated otherwise in a credit line to the
material. If material is not included in the article’s Creative Commons licence and your intended use is not
permitted by statutory regulation or exceeds the permitted use, you will need to obtain permission directly from
the copyright holder. To view a copy of this licence, visit http://creativecommons.org/licenses/by/4.0/.
© The Author(s) 2021
Scientific Reports | (2021) 11:19425 | https://doi.org/10.1038/s41598-021-98935-4 10
Vol:.(1234567890)You can also read