FOREIGN DIRECT INVESTMENT AND ECONOMIC TRANSFORMATION IN MYANMAR - Stephen Gelb, Linda Calabrese and Xiaoyang Tang March 2017 - Refworld
←
→
Page content transcription
If your browser does not render page correctly, please read the page content below
FOREIGN DIRECT INVESTMENT AND
ECONOMIC TRANSFORMATION IN
MYANMAR
           Stephen Gelb, Linda Calabrese and Xiaoyang Tang
                                               March 2017
FOREIGN DIRECT INVESTMENT AND ECONOMIC TRANSFORMATION IN MYANMAR

     Authors
     This paper has been prepared by Stephen Gelb and Linda Calabrese (both ODI)
     and Xiaoyang Tang (Carnegie-Tsinghua Center for Global Policy, Beijing).

     Note: Throughout this document, we follow UN practice in referring to ‘Myanmar’
     rather than ‘Burma’.

     Acknowledgements
     This paper has been prepared by ODI’s Supporting Economic Transformation
     programme. The authors wish to thank Dirk Willem te Velde for comments, Hamish
     Nixon for inputs and the DFID team in Myanmar for their exceptional support and
     their insightful feedback on earlier drafts. Special acknowledgement goes to James
     Owen (former DFID) for providing support and comments throughout the
     preparation of the paper. All views expressed are those of the authors alone and do
     not reflect DFID or ODI views.

     We also wish to thank the firm owners and managers, and others who provided
     interviews in Myanmar and in China (full list provided on page 79). We wish to
     thank in particular for comments UK FCO and UKTI officials in Yangon, and DFID
     and FCO officials in China

     This is a very substantially revised version of earlier drafts produced in March 2016
     and May 2016.

     For further information about the ODI’s Supporting Economic Transformation (SET)
     please contact Sonia Hoque, Programme Manager (s.hoque@odi.org.uk).

     © SUPPORTING ECONOMIC TRANSFORMATION.

     The views presented in this publication are those of
     the author(s) and do not necessarily represent the
     views of DFID or ODI.

ii
FOREIGN DIRECT INVESTMENT AND ECONOMIC TRANSFORMATION IN MYANMAR
CONTENTS
Acronyms _______________________________________________________ 3
Executive summary _______________________________________________ 1
1 Introduction ____________________________________________________ 3
2 Growth, transformation, trade and investment in Myanmar: an overview _____ 6
2.1 Sectoral composition of output in Myanmar ____________________________________ 7
2.2 Employment and productivity levels __________________________________________ 8
2.3 Trade relations __________________________________________________________ 9
2.3.1 Trade diversification ________________________________________________________ 13
2.3.2 Trade in selected sectors ____________________________________________________ 15
2.4 China–Myanmar trade ___________________________________________________ 19
2.5 Foreign direct investment in Myanmar _______________________________________ 21
2.5.1 Legal and institutional framework for foreign investment ____________________________ 22
2.5.2 FDI performance in Myanmar _________________________________________________ 26
2.6 Concluding remarks on transformation, trade and FDI __________________________ 36
3 Foreign investment in Myanmar: insights from firms and sectors __________ 37
3.1 Perceptions of the operating environment in Myanmar __________________________ 51
3.2 Impact of Chinese firms on economic transformation in Myanmar _________________ 54
3.2.1 Garments_________________________________________________________________ 55
3.2.2 Tourism __________________________________________________________________ 56
3.2.3 Construction ______________________________________________________________ 57
3.2.4 Agriculture and agro-processing _______________________________________________ 57
3.3 Concluding remarks _____________________________________________________ 58
4 Towards policies for economic transformation ________________________ 59
4.1 Sector-specific policies __________________________________________________ 60
4.1.1 Garments_________________________________________________________________ 60
4.1.2 Tourism __________________________________________________________________ 65
4.1.3 Construction and infrastructure ________________________________________________ 65
5 Concluding remarks: the political economy of foreign investment and economic
transformation in Myanmar _________________________________________ 68
5.1 Interest groups and economic transformation _________________________________ 68
5.2 A potential role for China in promoting economic transformation in Myanmar _________ 70
References _____________________________________________________ 73
Dataset _________________________________________________________________ 79
Interviews _______________________________________________________________ 79
Annex: Myanmar’s imports from China________________________________ 80
iiiEXECUTIVE SUMMARY
This study assesses the potential for foreign direct investment (FDI) to contribute to Myanmar’s economic
transformation, by raising productivity and growth. The study focuses on four sectors – agriculture and
agro-processing, garments, construction and tourism – selected for their significance for both
transformation and FDI in Myanmar, particularly FDI from China.
The paper begins with a brief review demonstrating that economic transformation over the past two
decades has been limited, though data limitations make it difficult to reach firm conclusions. The sectoral
composition of output has shifted, as agriculture’s contribution has dropped from over 40% in 1997 to
below 30% in 2014, while industry (manufacturing, construction, mining and extractives, and utilities)
doubled from around 15% of gross domestic product (GDP) to around 30%, manufacturing alone going
from less than 10% to over 20%. Agriculture’s employment share is still largest, but has dropped from over
60% to 40% between 1991 and 2013, but much of the labour was absorbed by low-productivity services,
and manufacturing is still very low at about 10%.
The review of trade and investment looks at overall performance, as well as in the four selected sectors,
and at relations with China. Exports have grown especially into China, but are dominated by extractives
(particularly natural gas and precious stones). Promising growth of garment exports in the 1990s was
interrupted by sanctions, but exports have begun to recover as these have been relaxed since 2012. FDI
performance has similarly been poor and dominated by natural resources (extractives) and infrastructure
(hydropower), with China the largest source. Garment export potential has raised manufacturing FDI since
2012. The trade and investment regimes are still undergoing liberalisation to encourage entry.
Forty firms in the selected industries were interviewed, of which 31 were Chinese investors. Motivations
for entry were predictable, including low-wage unskilled labour to support garment exports to European
and US markets, domestic infrastructure and real estate projects in construction, and domestic market
share in rice seeds and rice processing firms with rice output supplying both the domestic market and
growing Chinese exports. The paper emphasises firms’ interactions with each other: Chinese garment
firms’ entry is largely motivated by the choice of Myanmar as a location by their customers (often large
Western retail or clothing brands), while construction and agro-processing firms have been required to
have local joint venture partners, which usually have been part of the well-connected family-owned
conglomerates that dominate Myanmar business.
The firm interviews – and much other evidence – suggest the Chinese firms are fairly satisfied with their
performance in Myanmar, and with the productivity of low-skilled Myanmar labour (adjusted for wages).
The Chinese and non-Chinese firms are not very different with respect to their main concerns: the quality
of infrastructure (energy and transport particularly) and trade facilitation; the quality of local employees in
higher-level managerial and technical positions; the limited breadth of the financial system, including the
narrow scope of financial and foreign exchange instruments; and the unpredictability or absence of
regulation.
The paper reviews in some detail the foreign presence in each of the four sectors and its impact on
economic transformation. Significant positive effects include employment and exports in garments, local
enterprise development and downstream user costs in construction (and infrastructure), and exports,
technology transfer and product market competition in agriculture and agro-processing, where indirect
Chinese investment (via a large EXIM Bank loan) is supporting farmer liquidity and mechanisation.
The paper makes a number of policy recommendations for UK DFID, starting with general concerns.
a. Support public and private policy dialogue, which is remarkably sparse, and which will help develop
a culture where burden-sharing and trade-offs between different interests become visible.
b. Address the severe shortage of high-level skills (entrepreneurial, management and technical)
through multiple approaches:
i. Set up post-secondary institutions at scale to focus on these skill areas.FOREIGN DIRECT INVESTMENT AND ECONOMIC TRANSFORMATION IN MYANMAR
ii. Support ‘labour circulation’ to enable skilled and experienced employees of foreign firms in
Myanmar to set up their own enterprises, via mechanisms to assist access to finance and land.
iii. Use similar mechanisms to attract diaspora entrepreneurs back to Myanmar.
c. Promote collective action by businesses:
i. Support clustering through the regeneration and expansion of industrial parks (the special
economic zones not being sufficient), focusing especially on ‘soft’ institutional infrastructure in
these areas, while partnering with other donors better placed to support ‘hard’ infrastructure.
ii. Support the upgrading of business associations and their ability to engage in policy dialogue,
by training at scale in organisational and negotiation skills.
d. Support reforms in the financial and energy sectors to improve the quantity and quality of provision
and lower its cost, including liberalisation of foreign exchange access.
e. Support efforts to improve economic statistics and training in regulatory skills.
On the different sectors, the paper recommends, over and above the sector-specific adaptation of the
general recommendations:
a. Garment sector:
i. Support significant increases in firm entry from China and other Asian source countries,
through ‘trilateral’ investment and trade promotion – (Myanmar/China/UK and Europe) –
including a focus on the lead (buying) firms in the value chains (retail and brand owners).
ii. Encourage the immediate elimination of the CMP/FOB distinction in the Myanmar tax
structure, and support the introduction of back-to-back letters of credit and bonded
warehouses (as advocated by the industry), by assisting with training and systems
development in customs and banking.
b. Tourism:
i. Focus on high-level skills development by assisting with training institution development.
c. Construction:
i. Focus on urban low-cost housing development by supporting entry by Chinese construction
companies, both large and small.
ii. Develop regulatory capabilities for tendering, construction safety and housing product
quality.
d. Agriculture:
i. Scale up existing interventions in financial system leasing capacity for mechanisation and
irrigation equipment, in investment promotion to encourage foreign entry into rice seed
production and rice processing and in efficiency improvements and cost reductions in rice
export infrastructure.
2FOREIGN DIRECT INVESTMENT AND ECONOMIC TRANSFORMATION IN MYANMAR ACRONYMS CMP Cut-Make-Pack CSO Central Statistical Organisation DICA Directorate of Investment and Company Administration DTT Double Taxation Treaty FDI Foreign Direct Investment FIL Foreign Investment Law FOB Free on Board GDP Gross Domestic Product GNI Gross National Income GVC Global Value Chain ITC International Trade Centre JV Joint Venture IPA Investment Promotion Agency MEC Myanmar Economic Commission MGMA Myanmar Garments Manufacturers Association MIC Myanmar Investment Commission MMK Myanmar kyat MMSIS Myanmar Statistical Information System MOFCOM Ministry of Commerce, People’s Republic of China NLD National League for Democracy OBM Own brand manufacturer OECD Organisation for Economic Co-operation and Development OEM Original Equipment Manufacturer PRC People’s Republic of China SEE State-owned Economic Enterprise (referring to Myanmar enterprises) SET Supporting Economic Transformation SEZ Special Economic Zone SOE State Owned Enterprises (referring to Chinese and other countries’ enterprises) UMEHL Union of Myanmar Economic Holdings Limited UNCTAD United Nations Conference on Trade and Development USDP Union Solidarity and Development Party 3
FOREIGN DIRECT INVESTMENT AND ECONOMIC TRANSFORMATION IN MYANMAR

1 INTRODUCTION
Structural economic transformation is an aspect of the economic growth process which reflects the
reallocation of resources (especially labour) from less productive to more productive activities, as well as
changes in the composition of output and higher average productivity in the economy as a whole.
Reallocation can occur either from low productivity to higher productivity sectors, for example from
subsistence agriculture to manufacturing, or from less productive to more productive activities within the
same sector, such as from less mechanised to more mechanised production techniques within
manufacturing or within agriculture. Economic transformation raises the growth rate in the short term, but
also enhances the sustainability of growth in per capita incomes over time. Structural economic
transformation driven by a shift of resources into secondary industry has long been seen as the key to
economic development of low-income countries, because secondary industry offers arguably greater
potential than agriculture or (most) services sectors for stronger productivity growth as a result of capital-
intensive production, for technological progress, for agglomeration and scale economies, and for linkages
and spillovers between firms and sub-sectors.1 Indeed, with the possible and partial exception of India
where IT services have been important, there are arguably no economic development success stories of
the past 75 years in which secondary industry, and manufacturing in particular, has not been central.

Looking across countries, manufacturing productivity levels converge ‘unconditionally’, in other words the
manufacturing productivity level in developing countries tends to catch up to its level in developed
countries (Rodrik, 2013). Increased productivity in agriculture and services are also part of structural
transformation. Rising productivity linked to mechanisation and commercialisation of farming contributes
to growth directly, and also lowers the cost of food for urban workers and consumers which supports
industrial expansion. Both manufacturing and commercial agriculture depend heavily on a wide range of
services inputs, so that lower costs and improved quality of the latter can have substantial downstream
growth and transformation impacts. Structural transformation also involves changes in demand
composition, especially in exports, away from unprocessed primary commodities towards manufactured
goods and processed natural resources. The shift in sectoral ‘labour allocation’, that is, employment
patterns, at the heart of structural transformation is increasingly seen as the key to sustainable poverty
reduction, since it raises household incomes and enables accumulation of human capital, so lowering
vulnerability.

This study examines Myanmar’s economic transformation over the past two decades, and its potential for
further transformation in the future. Agriculture’s share of Myanmar’s gross domestic product (GDP) has
dropped from 60% in 1991 to 27.9% in 2014, but this does not necessarily mean that there has been
extensive transformation: 42% of the workforce is still found in agriculture and the sector remains largely
unmechanised. Over 25% of workers are in trade, which remains overwhelmingly informal, with low-
productivity activities. This suggests that structural transformation has been limited, notwithstanding strong
GDP growth since 2007/8, averaging 5.8% per annum.2 Myanmar’s gross national income (GNI) per capita
in 2014 was $1270,3 which was above its regional neighbours Cambodia ($1020) and Bangladesh ($1080)
but below Laos ($1660), India ($1570) and the average of sub-Saharan African developing countries
($1637).4

As detailed in Section 2 below, China has been Myanmar’s largest international economic partner for trade
and investment over the past 15 years, and has itself undergone very rapid economic transformation with
associated employment creation and poverty reduction over the past 30 years. This has been linked with
the rapid expansion of the manufacturing sector in China, including garments and other export-oriented
light manufacturing supplied to industrialised-country markets, as well as the construction and engineering

1
  For more discussion on economic transformation, see McMillan et al. (2015). The classic references are Chenery et al (1986), and Lewis
(1954).
2
  This average growth rate is based on International Monetary Fund (IMF) staff estimates of real GDP growth: see tables of Selected Economic
Indicators, Article IV Consultations, 2011, 2013 and 2015, available at http://www.imf.org/external/country/mmr/.
3
    World Development Indicators (WDI), current US$, Atlas method.
4
    This average excludes South Africa.

4
FOREIGN DIRECT INVESTMENT AND ECONOMIC TRANSFORMATION IN MYANMAR sectors with development in transport and energy infrastructure and urban housing. But China is now shifting into a new phase of economic growth involving rises in domestic wages and in the share of domestic consumption in aggregate demand relative to exports and fixed investment. This is contributing to a shift in China’s export-oriented labour-intensive light manufacturing from the coastal regions to new locations both inside and outside China, and to an increase in outward investment in other sectors, including construction and engineering. Both the latter sectors are central to the Chinese government’s foreign economic policy strategy articulated as the ‘Belt and Road Initiative’, in which Myanmar is of great significance, given its geographical location between western China and the Bay of Bengal and Indian Ocean. But several large Chinese investment projects in Myanmar have been politically and socially controversial, as has been the extensive informal natural resource extraction and trading activities undertaken by Chinese businesses. In the past five years, this has contributed to political tension over China’s role in Myanmar – both within Myanmar and between the two countries – however, as its much larger neighbour and with its own global stature increasing, China remains very influential in Myanmar’s economic and geo- political situation. The ongoing political transition in Myanmar, together with the continued economic growth transition in China, provides a promising context for investment from China to have significant beneficial impacts on economic transformation in Myanmar. This paper examines this possibility. This study focusses on foreign direct investment (FDI), in particular from China, and in particular into four sub-sectors with the potential to accelerate economic transformation in Myanmar, namely: garment manufacturing; agriculture and agro-processing; construction; and tourism. Three of the four sub-sectors – garment manufacturing, construction and tourism – are in secondary industry, and garments, tourism and agro-processing (partially) are export-oriented. Garments, construction and tourism are all labour- intensive, and have the potential to provide extensive employment opportunities for people moving out of subsistence agriculture, which also helps to create a workforce able to undertake standardised factory- type work. Though these activities may not be high productivity in international comparative terms, they are high productivity in the context of Myanmar’s current economic structure, and particularly relative to subsistence agriculture which still employs 40% of the workforce. For this reason, this study also examines the expansion of commercial agriculture and agro-processing, which are higher productivity activities than subsistence agriculture and also contribute in potentially significant ways to economic transformation through lower prices for domestic food and through increased exports. The construction sector’s impact on transformation is both direct and indirect, the latter via forward linkages relating to the provision of housing and improvement of infrastructure, that is, lower input costs for other sectors. We begin in Section 2 with a discussion of the broad context of economic transformation in Myanmar, including an examination of changes in the sectoral composition of output, employment and trade, focusing on both the Myanmar economy as a whole, and on the four sub-sectors of primary interest in this paper. This section also discusses FDI into Myanmar, looking at historical patterns of inward investment by sector and source country, and the ongoing reforms in the investment environment in an effort to improve the country’s historically poor performance in attracting foreign capital. The discussion in this section makes extensive use of both official Myanmar data as well as ‘mirror’ data from its trade and investment partners. To examine whether investment from China into Myanmar could benefit economic transformation, we interviewed 32 Chinese firms and ten non-Chinese firms already operating in the four selected sub-sectors in Myanmar. The objective was to understand the firms’ motivations for investing in Myanmar, their perceptions of the business environment and their impact on Myanmar’s economy. Section 3 presents the findings from the firm interviews in the context of the overall trajectory of each sector, which provides a basis for discussion in Section 4 of possible policy options for various stakeholders – the Myanmar government, the Chinese government and Myanmar’s other development partners – to enhance economic transformation through growth of these activities. Section 5 discusses the political economy context for the formulation and implementation of policy options looking at both Myanmar’s political transition and its relationship with China. 5
FOREIGN DIRECT INVESTMENT AND ECONOMIC TRANSFORMATION IN MYANMAR

2 GROWTH, TRANSFORMATION, TRADE AND
INVESTMENT IN MYANMAR: AN OVERVIEW
This section takes stock of economic transformation in Myanmar in recent decades, looking first at
changes in the production structure and at productivity across sectors, before turning to trade and finally
to FDI. We draw on a wide range of secondary data sources including DFID’s Inclusive Growth Diagnostic
(2015) and SET’s own data portal. 5 Although it has improved recently since the Myanmar Central
Statistical Organisation (CSO) introduced the Myanmar Statistical Information Service (MMSIS), both data
availability and quality in Myanmar remain very uneven, especially at the sectoral level, which is a severe
limitation on what can be said with confidence about economic transformation.6

Illustrative of the data challenges, there is considerable uncertainty even about the overall size of
Myanmar’s economy, as measured by GDP. Table 1 reports estimates of GDP presented by the Myanmar
government.

Table 1: Alternative estimates of Myanmar’s GDP, 2012/13–2014/15
                                                              CSO Myanmar                 IMF           WDI

                                           MMK trillion       65.44                       -             -
     2014/15             Nominal
                                           US$ billion        65.25                       63.1          64.33

                                           MMK trillion       48.88                       54.7          -
     2013/14             Real
                                           US$ billion        -                           56.7          -

                                           MMK trillion       51.26                       47.7          -
     2012/13             Nominal
                                           US$ billion        -                           55.6          74.69

According to the CSO, Myanmar’s nominal (current price) GDP was Myanmar Kyat (MMK) 65.44 trillion in
the fiscal year (FY) 2014/15, equivalent to United States (US) $65.25 billion converted using IMF exchange
rates. 7 The IMF’s own projection of nominal GDP for FY2014/15 was US$63.1 billion, which is 3.3%
smaller than the CSO’s figure,8 while the World Bank’s WDI report nominal GDP for FY2014/15 of $64.33
billion, 1.4% lower than the CSO. Similar disparities are found in earlier years, and for both nominal and
real measures.9

As noted above (and taking the data at face value), based on a population of 53.4 m. the GNI per capita
in 2014 was $1270 according to the World Bank (Atlas method). This income level is higher than Cambodia
and Bangladesh but below Laos, India and the average for sub-Saharan Africa (excluding South Africa).
Note that the IMF reports per capita income as $1112 per capita (IMF, 2015a).

Given the uncertainties about the GDP data, both real or nominal, growth rates calculated using the data
should be treated with extreme caution. Nonetheless, we report here that according to the UN data for

5
    http://set.odi.org/data-portal/. Explanation of the methodology and use of data are provided in te Velde and Kennan (2015).
6
    See http://www.mmsis.gov.mm/, which provides better quality data than the CSO’s original site http://www.csostat.gov.mm/.
7
 See www.mmsis.gov.mm, which reports official data compiled by the CSO. This figure was published on 18 August 2015. Myanmar’s national
accounts present data for the fiscal year, running from 1 April to 31 March: for example, FY2014/15 starts on April 1 2014.The exchange rate
used here is $1 = MMK997.18, the average monthly rate over FY2014/15 from www.imf.org. The IMF estimate of real GDP for FY 2013/14 is
MMK54,699 billion, or $56.7 billion, equivalent to $1112 per capita (IMF, 2015a).
8
    IMF (2015a: Table 1a) published a few weeks after the MMSIS figure for FY2014/15.
9
 Exchange rate differences probably account for part of this disparity: the IMF reports the average US$ exchange rate for the MMK to have
been 640.65 for 2012 (end-2012 855.00) and 933.57 for 2013 (end of year 988.00).

6
FOREIGN DIRECT INVESTMENT AND ECONOMIC TRANSFORMATION IN MYANMAR
gross value added (GVA) (used across countries for the SET data portal), aggregate economic growth in
Myanmar averaged a scarcely credible 9.7% per annum between 1991 and 2013, with the rate remaining
above 10% persistently between 1999 and 2010. As noted above, the IMF reports growth of 5.8% on
average for the years 2007/08 to 2013/14.
2.1 Sectoral composition of output in Myanmar
This section discusses shifts in the sectoral composition of output in Myanmar, using CSO data, before
looking at shifts in the sectoral composition of employment using data from the ILO.
As shown in Figure 1, in 2014 nearly 28% of value added came from agriculture, with 20% from
manufacturing, 7.3% from mining and extractives (mainly natural gas), and just under 6% from
construction. The remaining 39% came from the services sector, with a surprisingly large share of 14.8%
contributed by infrastructure services: transport and communication.
There are alternative estimates of the size of the mining/extractives sector, based on different information
on resource exports. The IMF reports a figure of $3.6 billion of natural gas exports in 2012/13 (provided
by the SOE Myanmar Oil and Gas Enterprise, MOGE), equal to 6.47% of its estimate of nominal GDP for
that year of $55.6 billion, and reportedly 70% of all exports (IMF, 2015a, b). This is not significantly different
from the CSO estimate of mining’s share of output. In contrast however, a recent unofficial report
suggested that jade output, based on mirror data of Myanmar exports reported as imports by its trading
partners, was at least $31 billion for 2014 (Global Witness, 2015a). The report went on to argue that this
was not accounted for in the GDP data, notwithstanding that it was ‘official’ output in the sense that the
foreign trade was regulated and measured by public agencies. Adding this amount to officially measured
output would significantly raise both the GDP whether reported by the Myanmar government or multilateral
organisations, and also raise significantly the share of mining relative to those of other sectors.
Nonetheless, taking the official data at face value, it is evident that the composition of the economy has
changed considerably over time, as Figure 1 shows. Agriculture’s contribution to GDP has dropped
dramatically since 1995, while the industrial sector (including manufacturing, mining and construction) has
quadrupled its share. The manufacturing share alone has nearly trebled from 1995 to 2014.
Figure 1: Value added by each sector as share of GDP, selected years
100%
90%
80%
70%
60%
50%
40%
30%
20%
10%
0%
1995 2000 2005 2010 2011 2012 2013 2014
Agriculture Manufacturing Mining
Construction Energy and electric power Transportation
Communications Trade Other services
Source: CSO, MMSIS.
Compared to the other countries in the region, Myanmar’s economy relies heavily on agriculture despite
the drop in the sector’s share (Figure 2). The contribution of manufacturing to GDP is in line with
7FOREIGN DIRECT INVESTMENT AND ECONOMIC TRANSFORMATION IN MYANMAR
neighbouring countries, but higher than developing countries in sub-Saharan Africa where the share of
value added of manufacturing averaged 11.2% of GDP in 2014 (World Bank, WDI).10
Figure 2: Value added by each sector as share of the GDP, selected countries, 2014
100%
90%
80%
70%
60%
50%
40%
30%
20%
10%
0%
Myanmar Bangladesh Cambodia Lao PDR Thailand Vietnam
Agriculture Mining
Manufacturing Electricity, gas, and water
Construction Trade
Transport and communications Other
Source: CSO MMSIS; Asian Development Bank, Key economic indicators 2015.
2.2 Employment and productivity levels
Turning now to employment, the total Myanmar workforce – people aged 15 to 64 years old – was 32.98
million in 2014 according to the latest population census (Ministry of Immigration and Population, 2015).
The census indicates that 21.2 million were employed and only 900,000 unemployed, with the remainder
of the workforce – 10 m. people – in unpaid and subsistence work.11 The World Bank and International
Labour Organization (ILO) both label the latter categories as ‘employed’, and their figures for total labour
force and unemployment broadly correspond with those of the Myanmar government.
Employment projections using a model compiled by the ILO World Economic and Social Outlook (WESO)
suggest that employment rose from 19.59 m. in 1991 to 30.42 m. in 2013. According to this analysis,
agricultural activities remain the largest occupation, though the share of the population working in
agriculture dropped from more than 66% in 1991 to 42% in 2013, with the absolute number of agricultural
workers peaking at 14.99 m. in 2000 and dropping to 12.79 m. by 2013.12
The manufacturing share of employment remains low, though it increased from 7.1% in 1991 to just over
10% in 2013. This is in line with most other countries in the region, using data from the same dataset:
employment in manufacturing ranged from 10.7% in Cambodia to 14% in Vietnam in 2013, though in Lao
PDR, less than 2% of the workforce was in manufacturing. The ILO WESO dataset reports a very low
share of employment in the mining sector of less than 1%, almost certainly an underestimate given the
sector’s share of output.
The ILO WESO data suggests that manufacturing sector employment growth was 3.9% per annum
between 1991 and 2013, with employment rising from 1.4 m. to 3.2 m. people. Construction sector
employment grew from 217,000 workers in 1991 to 1.77 m. in 2013.
10
African countries, however, may or may not exhibit the same degree of underestimation of their extractives sector.
11
For a full explanation see: http://laborsta.ilo.org/applv8/data/c2e.html
12
Note that it is not clear how agricultural employment is defined in this dataset.
8FOREIGN DIRECT INVESTMENT AND ECONOMIC TRANSFORMATION IN MYANMAR
Table 2: Employment by sector (%)
Sector 1991 2000 2005 2010 2013
Agriculture 66.3 60.4 52.8 45.7 42.0
Mining and utilities 0.6 0.8 0.9 0.9 0.9
Manufacturing 7.1 8.6 9.7 10.1 10.6
Construction 1.1 2.4 3.7 4.9 5.8
Wholesale, retail, hotels 17.2 18.9 21.4 24.1 25.4
Transport, storage, comms 2.4 2.9 4.2 5.3 5.6
Other (incl. gas/electricity) 5.3 6.2 7.4 9.1 9.6
Total 100 100 100 100 100
Source: ILO WESO supporting dataset.
Figure 3: Employment by sector in selected countries, 2013
100%
90%
80%
70%
60%
50%
40%
30%
20%
10%
0%
Myanmar Bangladesh Cambodia Lao PDR Thailand Vietnam
Agriculture Mining & utilities
Manufacturing Construction
Wholesale, retail, hotels Transport, storage, comms
Other
Source: ILO WESO supporting data set as compiled by the SET data portal.
The SET dataset examines labour productivity using United Nations (UN) data on output and ILO WESO
data on employment. The resulting estimates of growth of labour productivity for Myanmar are not credible,
but are reported here for completeness. For the economy as a whole, productivity growth was 7.4%
between 1991 and 2013, with the manufacturing sector increasing its productivity by 10.7% and agriculture
by 7.3%, even though the latter sector remains largely unmechanised. The data suggests that annual
manufacturing productivity growth between 2003 and 2010 was a barely credible 17.4% and that it slowed
to 4.7% per year since 2010. Unfortunately, better quality data at sector level is not available, meaning
that firm estimates of labour productivity are not possible.
2.3 Trade relations
As with all its economic data, Myanmar’s trade data is idiosyncratic, partial and inconsistent over time, so
that international comparisons can be difficult. For example, official data distinguishes between sea and
air trade, on one hand, and overland (‘border’) trade on the other, and may exclude overland trade in some
9FOREIGN DIRECT INVESTMENT AND ECONOMIC TRANSFORMATION IN MYANMAR
(sensitive) items. In addition, there is a very high level of illicit and unrecorded trade in key commodities,
which may comprise very significant shares of total trade, as illustrated by the mirror estimates of jade
exports cited above. In this section and the next, therefore, we examine in turn exports and imports using
both own data from official Myanmar sources, as well as mirror data from Myanmar’s trading partners.13
Figure 4: Total exports, Myanmar, 2001–2014 ($ millions)
30,000
25,000
20,000
15,000
10,000
5,000
-
2001 2002 2003 2004 2005 2006 2007 2008 2009 2010 2011 2012 2013 2014
Export (own) Export (mirror)
Source: Own data from the MMSIS. Mirror data from UN Comtrade, as compiled by the Atlas of Economic Complexity (for 2001-2010) and the
International Trade Centre (2011-2014).
Exports have increased more than tenfold in value from $820 m. in 1993 to around $10 billion in 2013,
and over $12 billion in 2014, according to own data. The mirror data follow a very similar pattern up to
2013, but there is a sizable disparity for 2014, which is accounted for by jade being underreported in the
own (Myanmar) data: the Myanmar customs department reported jade exports for May 2014 to April 2015
as $1.02 billion (AHK German Delegation in Myanmar, 2016), while Chinese data reports $12.3 billion jade
imports for 2014 from Myanmar.14
Looking at Myanmar own data, the overall export increase since the 1990s can largely be attributed to
natural gas exports, which grew from zero in 1999 to almost $2.4 billion in 2010, more than a quarter of
total exports in that year (MIT Observatory of Economic Complexity), and then more than doubled to $5.18
billion in 2014/15 (AHK German Delegation in Myanmar, 2016). With the opening of the pipeline pumping
gas from Kyaukphyu in Myanmar to Yunnan Province in China in July 2013,15 natural gas has become the
largest export by value, with other natural resources and semi-processed commodities also prominent,
including wood/timber and precious stones. Manufacturing exports in 2013 were less than 15% of the total,
four-fifths of which – 12% of total exports – were in garments, as discussed further below. It is worth
mentioning here that export taxes of 10% were levied on all until 2011, when they were reduced to 2%,
for all commodities except oil and gas (85 and 5%), wood (50%) and gems (30%) (WTO, 2014).The export
regime was further reformed in 2013, with many commodities no longer requiring licences.
13
Mirror data can itself be problematic, as the number of reporting trade partner countries may vary over time, and the quality of reported data
may vary across partners.
14
Global Witness (2015a) asserts the true figure to be about $31 billion, about 2.5 times the figure reported by China. The South China Morning
Post reported a Myanmar official figure for jade exports of $540 m.
15
An adjacent oil pipeline began pumping from February 2015.
10FOREIGN DIRECT INVESTMENT AND ECONOMIC TRANSFORMATION IN MYANMAR
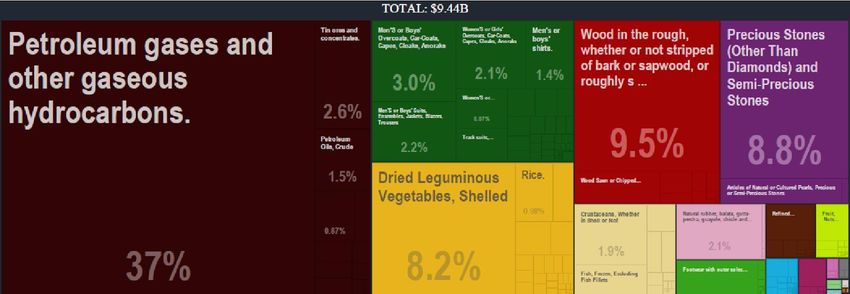
Figure 5: Composition of Myanmar exports, 2013
Source: MIT Observatory of Economic Complexity.
Turning to trading partners, Figure 6 below shows the major export markets for 2014, using mirror data.
Myanmar trades to a very large extent with other Asian countries. Myanmar’s own data shows a very
similar picture, with 95% of exports going to Asia, and over 70% to Thailand and China alone. Below we
discuss in more detail exports in garments, agricultural products and tourism (the latter not included in the
data shown here). In all three, Asian markets remain dominant, but in garments and tourism, European
and North American markets are growing fast since the relaxation of sanctions.
Figure 6: Myanmar export markets, 2014
Indonesia, 1.0% Great Britain, 1.0% Other, 6.0%
Germany, 1.1%
Singapore, 1.2%
Malaysia, 1.4%
South Korea, 4.9%
Japan, 7.2% China, 36.0%
India, 9.2%
Thailand, 31.0%
Source: Observatory for Economic Complexity based on UN Comtrade.
Figure 7 compares own and mirror data on imports, showing significant disparities between the two sets
of data since 2011, the point at which total imports began to grow much more rapidly. As a result, the own
data and mirror data give differing perspectives on Myanmar’s trade balance over the period, as shown in
Figures 8 and 9, between which – it should be noted – the scales on the vertical axis differ quite
significantly. The own data in Figure 8 suggest a fairly sizable trade surplus between 2003 and 2010, with
a growing deficit thereafter. In contrast, the mirror data in Figure 9 suggest trade was balanced up to 2010,
followed by a deficit for three years before trade again became balanced in 2014, and at a much higher
absolute level than in the own data. The contrast between Figure 8 and Figure 9 is noteworthy, as it
suggests Myanmar trade data is an unreliable guide for trade and balance of payments policy, as well as
for customs revenues. There is little pattern to the discrepancies between the own (Figure 8) and mirror
11FOREIGN DIRECT INVESTMENT AND ECONOMIC TRANSFORMATION IN MYANMAR
(Figure 9) data, though in many years since 2001, the own data is higher on both the import and the export
side, which may suggest that misinvoicing has been used to channel funds out of Myanmar.
Figure 7: Total imports, Myanmar, 2001–2014 ($ millions)
25,000
20,000
15,000
10,000
5,000
-
2001 2002 2003 2004 2005 2006 2007 2008 2009 2010 2011 2012 2013 2014
Import (own) Import (mirror)
Source: Own data from the MMSIS. Mirror data from UN Comtrade, as compiled by the Atlas of Economic Complexity (for 2001-2010) and the
International Trade Centre (2011-2014).
Figure 8: Total exports and imports, own Myanmar data, 2001–2014 ($ millions)
18,000
16,000
14,000
12,000
10,000
8,000
6,000
4,000
2,000
-
2001 2002 2003 2004 2005 2006 2007 2008 2009 2010 2011 2012 2013 2014
Export (own) Import (own)
Source: CSO, MMSIS.
12FOREIGN DIRECT INVESTMENT AND ECONOMIC TRANSFORMATION IN MYANMAR
Figure 9: Total exports and imports, mirror data, 2001–2014 ($ millions)
30,000
25,000
20,000
15,000
10,000
5,000
-
2001 2002 2003 2004 2005 2006 2007 2008 2009 2010 2011 2012 2013 2014
Export (mirror) Import (mirror)
Source: UN Comtrade.
Figure 10 shows imports by source country, and as with exports, the overwhelming majority of imports
come from Asia, with China and Thailand being the two largest sources followed by Singapore.
Figure 10: Myanmar top import sources, 2014
Vietnam, 1.6% Others, 6.1%
Indonesia, 2.7%
Malaysia,
3.8% South Korea,
3.8%
India, 4.1%
China, 42.0%
Japan, 5.5%
Singapore,
10.0%
Thailand, 20.0%
Source: Observatory for Economic Complexity based on UN Comtrade.
2.3.1 Trade diversification
Looking at Myanmar’s exports in comparative perspective reinforces the view that diversification of
production is low and exports are mostly standardised products, that is, the country produces a limited
range of products exported by many other countries. Figure 11 below plots the position of countries in
relation to export product diversity of a country and export market ubiquity of a product. Product diversity
refers to the range of products exported by a country, while market ubiquity refers to the number of
competitor countries faced by a country in its export markets, or equivalently, the number of countries
exporting a particular product (Hausmann and Hidalgo, 2010; Hausmann et al., 2014). The expected
diversity-ubiquity relationship across national economies is negative: greater export diversity is associated
on average with lower ubiquity. Both diversity and ubiquity reflect a country’s capabilities, diversity directly
13FOREIGN DIRECT INVESTMENT AND ECONOMIC TRANSFORMATION IN MYANMAR
and ubiquity inversely, so that Myanmar and other quadrant (1) countries have low capabilities.
Industrialised countries are in the lower right quadrant (4).
Figure 11: Diversity and ubiquity of exports, 2012
Source: SET computations http://set.odi.org/
Another perspective comes from the IMF’s economic diversification index, which distinguishes between
extensive diversification (increases in the number of export products or partners) and intensive
diversification (more equal distribution of exports among existing products or partners) (IMF, 2014). An
increase in the index reflects lower diversification. Figure 12 below shows that Myanmar’s index has
increased since 2000, reinforcing the conclusion based on the Hausmann-Hidalgo index, that the country
has low capabilities. Myanmar’s extensive margin has decreased somewhat, while its intensive margin
has increased, indicating more concentration of existing export products.
Figure 12: Myanmar export diversification index
5
4.5
4
Export diversification index
3.5
3
2.5 Intensive margin
2 Extensive margin
1.5
1
0.5
0
1965 1975 1990 2000 2005 2010
Source: DFID–IMF Diversification Toolkit (http://www.imf.org/external/np/res/dfidimf/diversification.htm): Export Diversification Database as
compiled by the SET data portal.
Figure 13 compares Myanmar with a set of south-east Asian competitors and Bangladesh, relative to
which it performs reasonably well, though the usual caveat regarding data quality applies to Myanmar and
some of the comparators alike.
14FOREIGN DIRECT INVESTMENT AND ECONOMIC TRANSFORMATION IN MYANMAR
Figure 13: Export diversification index for selected countries, 2010
Vietnam
Thailand
Myanmar
Lao PDR
Cambodia
Bangladesh
0 1 2 3 4 5 6
Note: A lower index indicates higher diversification.
Source: DFID–IMF Diversification Toolkit (http://www.imf.org/external/np/res/dfidimf/diversification.htm): Export Diversification Database.
2.3.2 Trade in selected sectors
We look more directly now at trade in the selected sectors – garments, tourism and agriculture – to highlight
the potential for export growth in these sectors that would in turn contribute to overall growth and economic
transformation. Construction is not included as it is not an export sector.16
2.3.2.1 Garments
Garments is one of the few manufacturing sectors where Myanmar is part of global value chains.17 During
the 1990s, exports to the US and the European Union (EU) grew considerably (Figure 14), and in fact
garments had become the country’s main export by 2000, at which time natural gas exports had not yet
begun. Estimates of garment exports as a share of total exports in 2000 vary from 30% (OECD, 2014) to
almost 40% (Kudo, 2005), compared with 2.5% in 1990. Garment exports – 65% of which were supplied
by locally-owned private firms and 20% by foreign-owned (Kudo, 2012a)18 – grew in the 1990s despite
suspension from the Generalised System of Preferences (GSP) by the US in 1989 and by the EU in 1997,
but began to drop from 2000 in the expectation of US sanctions. At that time, 50% of Myanmar’s garment
exports went to the US, and 40% to the EU.
When sanctions were imposed in 2003, garments still provided over 20% of total Myanmar exports, but its
share then fell away steeply to just over 7.5 % in 2013 (Kudo, 2005, 2012a; OECD, 2014). Sanctions and
the absence of preferences led to substantial numbers of garment factory closures. Figure 15 shows the
effect of sanctions on exports to the US and the EU market. Exports to the US fell from $435 m. in 2001
to zero in 2004, and although exports to the EU rose from $399 m. in 2001 to $527 m. in 2004, they then
dropped to below $200 m. by 2009.19 The markets in Japan and South Korea partially offset these falls,
rising from close to zero in 2001 to over $300 m. by 2010. Garment exports have trebled in value terms
since 2010, and risen strongly as a share of total Myanmar exports (Figure 14). This has been driven by
continued export growth into the Asian markets, the relaxation of sanctions by the US in 2012, and the
EU’s restoration of the GSP preference in July 2013, since when the EU market has recovered strongly.
This is evidenced by the entry and later expansion of European garment value chain lead firms, together
with their Chinese suppliers, into Myanmar to establish export platforms into Europe, as will be discussed
in detail below. The US restored Myanmar’s GSP status in September 2016, which might yield similar
positive effects on garment exports (AFP and Barron, 2016).
16
Construction equipment and intermediate inputs are of course imported, but are not identified in the trade data as imports of the sector.
17
Useful introductions to global value chains in the garment sector are Gereffi and Memedovic (2003) and Staritz (2011).
18
The remaining 15% was supplied by state and military-linked firms, including the Union of Myanmar Economic Holdings (UMEHL).
19
The EU market was likely also affected by the threat of consumer action against Myanmar products, provoked by the US ban (Kudo, 2013).
15FOREIGN DIRECT INVESTMENT AND ECONOMIC TRANSFORMATION IN MYANMAR
In 2012, the EU took 16% of Myanmar garment exports, with Japan taking 50% and Korea 33%
(International Labour Organisation [ILO], 2015). Myanmar own data consistently present much lower
garment exports than the importing countries mirror data. Figure 14 suggests $1.05 billion of garment
exports in 2014 according to Myanmar Customs, while UN Comtrade data (using trading partners’ imports)
suggest a much larger figure of $1.38 billion in 2014 and $1.56 billion in 2015 (see Figures 14 and 15). In
2015, 37% of exports went to the Japanese market, 25% to South Korea, and 34.6% to the EU, with 2.7%
to the US (ILO, 2015). It is likely that the US and EU shares will increase substantially in the medium-term
as the US market grows following the entry of US firms such as The Gap in 2014, and the restoration of
GSP preferences on October 7 2016, as President Obama promised when meeting Aung San Suu Kyi in
September 2016). The decline caused by sanctions, and the potential for future growth is illustrated by the
fact that, in 2000, Myanmar garment exports to the US were eight times the value of those of Vietnam, but
in 2012, Vietnam’s total garment exports to the world market amounted to twenty times those of Myanmar.
Figure 14: Export of textile and textile articles ($ millions) (LH axis); share of total exports (RH
axis)
1,600 20%
1,400 18%
16%
1,200
14%
1,000
$million
12%
800 10%
600 8%
6%
400
4%
200 2%
- 0%
2001 2002 2003 2004 2005 2006 2007 2008 2009 2010 2011 2012 2013 2014
(p.a)
MM own data Mirror data Share of exports RHS
Sources: Own data from MMSIS & Myanmar Customs Department. Mirror data from UN Comtrade. Share of exports is for own data.
The global apparel market is highly segmented by product type as well as by quality, and there is a
common view that Myanmar’s export presence during the past decade in the Japanese and Korean
markets – where consumers emphasise quality more heavily than in the EU and US – has contributed to
significant improvement in production capabilities in the country. One illustration of this is the recent
change in the composition of garment exports: in 2013, 93% of exports were wovens which had
preferential access to the Japanese market, but as demand from the EU increased, there has been an
increase in exports of knits, which in 2014 comprised 18.7% of exports. Knits are more difficult to work
with than wovens, requiring specific skills from technical staff and production workers, as well as different
machines than wovens.
16FOREIGN DIRECT INVESTMENT AND ECONOMIC TRANSFORMATION IN MYANMAR
Figure 15: Myanmar garment exports by major market ($ millions)
1,600
1,400
1,200
1,000
800
600
400
200
-
2001 2002 2003 2004 2005 2006 2007 2008 2009 2010 2011 2012 2013 2014 2015
USA EU (28) Japan South Korea Total
Note: This graph only includes garment exports (HS codes 61 and 62).
Source: UN Comtrade, mirror data.
2.3.2.2 Tourism
Tourism (entry by foreign visitors) is a services export which contributes to economic transformation
through various channels, including the increased demand for low-skilled labour and the opportunities
offered to enterprises in the tourism ‘value chain’ resulting from tourism growth. Both of these (direct and
indirect) effects of tourism growth on economic transformation are particularly strong where tourist
attractions are based on natural resources (for example, beaches and coastal areas, mountains, game
parks) or on historical-cultural sites in remote or rural locations. Productivity is increased and
transformation enhanced as people in these areas are drawn out of subsistence activities into waged work,
and as markets are created for local enterprises in services (e.g. cleaning, catering and entertainment)
and manufacturing (e.g. handicrafts). Infrastructure built in these areas can serve to catalyse economic
activity beyond tourism (reflecting an induced effect of tourism growth). Growth in city-based tourism also
of course has considerable potential for low-skill job creation, and especially to draw low-skill labour in
informal enterprises into more formal, higher productivity activities and markets.
Official data on foreign tourism into Myanmar is collected and published by the Ministry of Hotels and
Tourism (MHT, various years), and also published by the UN World Tourism Organisation (UNWTO). 20
The ministry classifies visitors according to point of entry: air/sea (to Yangon, Mandalay and Naypyidaw)
or land (border gateways), with the latter accounting for roughly two-thirds of total entries.21 The ministry
data suggest that 97% of overland entrants are from Thailand (MHT, 2015), most of whom stay for less
than one day (ibid: 6).
Tourism inflows and export receipts have increased significantly since 2011, due to both relaxed land
border entry restrictions as well as the changed US and EU diplomatic stance towards Myanmar. Between
2006 and 2010, total international visitors to the country averaged 725,000 per annum, generating just
over $80 m. in receipts annually, equivalent to 1.33% of total exports on average over the five year period
(WDI). In 2013 (the most recent available MHT/UNWTO data for tourism export receipts), the number of
foreign visitors had trebled from the 2006-10 average: there were 2.04 m. visitors – 900,000 entering via
air/sea, and 1.4 m. overland – generating $934 m. in tourism export receipts, or 8.3% of total exports. By
2015 the number of foreign visitors had doubled to 4.7 m., of which 1.3 m. entered by air or sea (MHT,
2015). Estimates produced by the WTTC (2016) suggest tourism export receipts in 2015 amounted to
20
See UNWTO (2015) using data from the Myanmar Ministry of Hotels and Tourism. The same data is presented in World Bank, WDI. The
World Trade and Tourism Council (WTTC) presents different data based on estimates by Oxford Economics Ltd, and using concepts from the
Tourism Satellite Accounts project of the UN, OECD and UNWTO (WTTC, 2016).
21
Some international tourism data does not classify visitors staying for less than 24 hours as tourists. However UNWTO, WDI and WTTC all
include overland entrants in their ‘tourists’ data.
17FOREIGN DIRECT INVESTMENT AND ECONOMIC TRANSFORMATION IN MYANMAR
$1.89 billion ($1.2 billion in 2014), equivalent to 12.8% of total Myanmar exports (2013: 5.1% of total
exports, 2014: 9.5%). In sum, tourism is an export sector of rapidly growing importance for Myanmar.
By far the majority of foreign visitors entering Myanmar are from Thailand, which provided 74.5% of the
2015 total, comprising 15.7% of the total 1.3 million air/sea entrants in addition to almost all overland
entrants (MHT, 2015). The EU contributed 16.1% of air/sea entrants, and North America and Oceania
(Australia/New Zealand) a further 9.2%.
Chinese visitors comprised 148 000 (11.4%) 2015 air/sea entrants, the second largest source country after
Thailand. China formally closed its south west borders with Myanmar, Vietnam and Laos in 2005, due to
the rise in cross-border gambling, drug-running, and kidnapping and other criminal activities, and re-
opened them only at the end of 2013 (Gokunming, 2013). It is evident that both licit and illicit border trade
in goods, and thus also border-crossing, continued despite the closure. Despite the re-opened borders,
land border crossing between China and Myanmar may still be largely unofficial and unrecorded. Myanmar
tourist data report land crossings by ‘gateway’, but do not explicitly identify the neighbouring country of
each gateway. Officially recorded land entrants to the “Northern” border gateway in 2015 were only 69
739, while those to the “North-eastern” gateway were considerably larger at 674 901 (MHT, 2015). It is
unclear which of these refers to the border post between Ruili (Yunnan Province, China) and Muse (Shan
State, Myanmar).22
2.3.2.3 Agriculture
In the 1920s, Myanmar exported on average 2638 million metric tons of rice annually, and though annual
exports in the 1960s were only 46% of this level, it is a remarkable fact that during that decade Myanmar
was the world’s leading rice exporter. Subsequent government limitations on rice exports tied to food
security concerns cut exports, and during the 1990s average annual exports by volume were down to 244
000 tons, only 20% of the 1960s level (World Bank & LIFT, 2014).
These are telling statistics, given the significance of agriculture in both overall output and employment and
that rice comprises 43% of total agricultural output (FAO, 2013). It is of great significance therefore that
(sea-borne) rice exports began to revive from 2009 when the export regime began to be liberalised, and
grew rapidly from 2011 when further trade deregulation allowed transport of rice to the Chinese border
and lowered export taxes. Border (overland) rice trade with China increased from zero to 684 000 tons in
2012 and 747 000 tons in 2013 (World Bank & LIFT, 2014), and total rice exports have continued to rise,
reaching 1.365 million tons in FY 2014/15 (Xinhua, 2016).
Despite much higher transport costs for overland rice exports to China compared to sea trade23, the landed
cost of Myanmar rice in China is well below the wholesale price of Chinese domestic rice, because of
rising production costs in China and price supports provided to Chinese farmers for income distributional
reasons. Despite the growth of Myanmar rice exports to China over the past 5 years, significant
uncertainties remain. Though the rice was allowed into its market, China regarded Myanmar border rice
as below health and safety standards (and the trade was unrecorded in Chinese trade data). This is partly
due to Myanmar’s outdated milling capacity and transport infrastructure. Negotiations between the two
governments began in late 2014 – notwithstanding the tensions in Myanmar-China relations connected
with the Myitsone Dam and other large infrastructure and mining projects – over rice quality inspection
procedures and licensing of Myanmar processing facilities (McLaughlin, 2015). An MoU was signed in
February 2015 but new procedures and market arrangements are apparently not yet fully implemented.
Rice is not Myanmar’s only significant export crop. Exports of pulses – a less important food crop in
Myanmar – were liberalised in 1988, and Myanmar is now the world’s 2nd largest exporter of pulses24,
22
It is unclear whether there is a border crossing between Myitkyina (Akchin State, Myanmar) and Tengchong (Yunnan Province, China), which
Myanmar and Chinese citizens can use. Foreigners are restricted to Muse-Ruili.
23
Land and sea transport costs are $75-100 and $30-35 per ton respectively (World Bank & LIFT, 2014), though
24
Pulses (dry beans) are Myanmar’s 3rd largest food product by value, contributing $1.26 billion to GDP in 2012, compared with $7.13 billion
from rice and $1.54 billion from chicken (FAOSTAT, 2013). Pulse exports in 2012 were about one-fifth of output.
18You can also read