Fractional Brownian motion in DNA sequences of bacterial chromosomes: a renormalization group approach
←
→
Page content transcription
If your browser does not render page correctly, please read the page content below
ENSEÑANZA                                        REVISTA MEXICANA DE FÍSICA 56 (1) 69–74                                            JUNIO 2010

       Fractional Brownian motion in DNA sequences of bacterial chromosomes:
                         a renormalization group approach
                                            M.V. José, T. Govezensky, and J.R. Bobadilla
                                 Theoretical Biology Group, Instituto de Investigaciones Biomédicas,
                                             Universidad Nacional Autónoma de México,
                                             Ciudad Universitaria, 04510, D.F., México,
                                                   Tel.:/Fax: 01-52-55-5622-3894,
                                              e-mail: marcojose@biomedicas.unam.mx
                                      Recibido el 29 de junio de 2009; aceptado el 2 de febrero de 2010

A renormalization group (RG) approach shows that the relative dispersion of the distance series of a triplet for each half of most bacterial
chromosomes follows an inverse power-law as a function of the window size in a log-log plot. These straight lines indicate that when
each half of the bacterial chromosome is analysed a random monofractal is obtained. With this approach, inverse bilateral symmetry of
some triplets in the 4 bacterial chromosomes analyzed is also illustrated. Thus, DNA sequences of whole bacterial genomes contain both
long-range correlations and random components. In particular the RG approach captures a harmonic modulation of the underlying inverse
power-law. The frequency distributions of distances of triplets are also analyzed and they exhibit an oscillatory decaying pattern that displays
the well-known 3-base periodicity. It is concluded that the DNA fluctuations of the distance series of triplets are not completely random,
like Brownian motion, nor are they the result of processes with short-term correlations. Instead, the inverse power-law reveals that the DNA
distance series at any position is influenced by fluctuations that occurred hundreds or thousands of bases apart. This behavior is a consequence
of the fractional Brownian nature of the distance series of DNA.

Keywords: Frequency distributions of distances of triplets; bacterial chromosomes; statistical properties of DNA distance series; renormal-
ization group approach; scaling exponents; Hurst exponent.

El enfoque del grupo de renormalización (RG) muestra que la dispersión relativa de una serie de distancias de tripletes para cada mitad de
los cromosomas bacterianos sigue una ley de potencia inversa en función del tamaño de la ventana en una grafica log-log. Estas lı́neas rectas
indican que cuando la mitad de cada cromosoma bacteriano es analizado se obtiene un monofractal. Con este método se ilustra que ciertos
pares de tripletes exhiben una simetrı́a bilateral inversa en las 4 bacterias estudiadas. Asimismo, las secuencias de ADN de los genomas
de bacterias en su conjunto contienen correlaciones de largo alcance y componentes aleatorios. En particular, el enfoque RG captura una
modulación armónica de las leyes de potencia inversa. Se analizan también las distribuciones de frecuencias de las distancias de tripletes y
se presenta un patrón oscilatorio que muestra la conocida periodicidad de 3. Se concluye que las fluctuaciones de las series de distancia de
tripletes del ADN no son al azar, como en el movimiento Browniano, ni son el resultado de correlaciones de procesos a corto plazo. Por el
contrario, la forma de las leyes de potencia inversa revela que la serie de distancias en cualquier posición se ve influida por fluctuaciones que
tuvieron lugar a cientos o miles de bases de separación. Este comportamiento es consecuencia de la naturaleza fractal browniana de las series
de distancias de tripletes en las secuencias de ADN.

Descriptores: Distribución de frecuencias de distancias de tripletes; cromosomas bacterianos; propiedades estadı́sticas de series de distancias
de ADN; renormalización de grupos; exponentes de escalamiento; exponentes de Hurst.

PACS: 87.10.+e; 05.40.+J

1.    Introduction                                                         tive is to relate the set of equations on one scale to the set of
                                                                           equations on the other scale. In this way, the scaling proper-
The renormalization group (RG) analysis, introduced in field               ties of the system can be obtained. The premise of the RG is
theory and in critical phase transitions, is a very general                that exactly at a second order phase transition, the equations
mathematical and conceptual tool, which allows one to de-                  describing the system are independent of scale.
compose the problem of finding the macroscopic behavior
of a large number of interacting parts into a succession of                    The concept of RG is useful for systems that exhibit
simpler problems with a decreasing number of interacting                   the properties of scale invariance and self-similarities of the
parts, whose effective properties vary with the scale of ob-               observables at the critical point of the system [2]. The
servation [1]. The RG permits one to determine the scaling                 RG approach deals with the concept that a critical point
properties of a system. At the outset, a set of equations that             results from the aggregate response of an ensemble of el-
may describe the behavior of the system is assumed. Then                   ements. The two main transformations of the RG are
the length scale at which the system is being described is                 decimation and rescaling. When we go from the fine scale
changed. By moving away from the system, some of the de-                   to the coarse scale, the process is called decimation. The idea
tails are lost. At the new scale, the same set of equations is             of RG is to decimate the degrees of freedom, while rescaling
applied, but possibly with different coefficients. The objec-              so as to keep the same scale by calculating, for example, the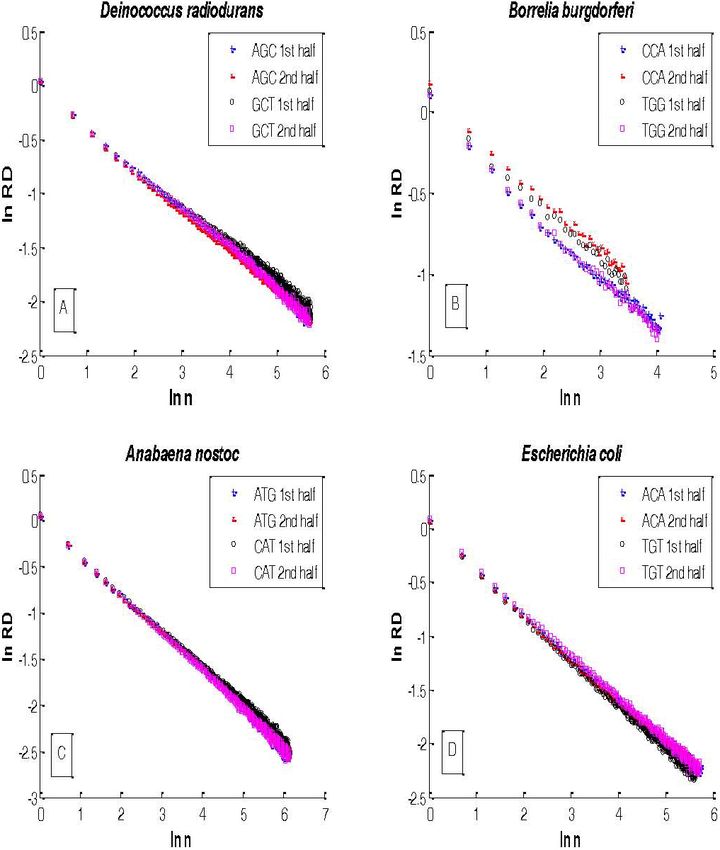
70                                         M.V. JOSÉ, T. GOVEZENSKY AND J.R. BOBADILLA

relative dispersion, the ratio of the standard deviation to the       tive value of the observable at two different scales depends
mean. The procedure can be repeated using groupings of two,           simply on the ratio of the two scales.
three, four and more data points. In this way the fractal di-             Sornette [2] has generalized the continuous fractal dimen-
mension that is independent of the degree of coarse-graining          sion into what he calls the Discrete Scale Invariance. Consid-
can be determined.                                                    ering the solution in (2) we get:
     The statistical analysis of DNA sequences has been stud-
ied for almost 60 years. Several properties have been un-                                           bd
                                                                                                       = 1 = ei2πn
veiled using different methods for their analysis. A non-                                           a
exhaustive selected list of some of the methods and main                   This leads to:
findings related to the statistical properties of DNA se-
quences is offered in Table I. The finding that several bac-                                         ln (a)     2πn
                                                                                               d=           +i        ,              (3)
terial chromosomes possess an inverse bilateral symmetry                                             ln (b)    ln (b)
(IBS) was demonstrated by means of the RG approach and
                                                                      which characterizes the system in terms of complex fractal di-
to our knowledge this was the first time that this approach
                                                                      mensions. The imaginary part of the fractal dimension trans-
was used for analyzing DNA sequences of whole bacterial
                                                                      lates itself into a log-periodic modulation decorating the lead-
genomes [3,23]. Furthermore, in a more recent work we have
                                                                      ing power law behavior.
shown that the scaling exponents for a given triplet in several
prokaryotes have remained unaltered throughout their evolu-
tion [24]. Then, there is a strong evidence of critical scale         3.    Aggregating data and relative dispersion
invariance in the scaling exponents which indicates that not                (Hurst exponent)
all information of ancestral organisms has been erased at least
for the last 3 billion years of evolution [24].                       Let us examine how the relative dispersion (RD) changes as
     In this work we present the basic ideas of the RG ap-            a function of the number of adjacent data elements we ag-
proach and give examples of how this procedure can be ap-             gregate. We start by aggregating n−adjacent data points,
plied for analyzing the entire genomes of 4 bacteria.                 so that the j− element in such an aggregation is given by
                                                                        (n)
                                                                      Yj = Ynj +Ynj−1 +Ynj−2 +...+Ynj−(n−1) . Here, Y rep-
                                                                      resents the distance between two identical triplets. In terms
2. Renormalization group                                              of these new data the arithmetic average is defined as the sum
The purpose of the RG is to translate into mathematical lan-          over the total number of data points, where the bracket [ ] de-
guage the concept that the sum is the aggregation of an en-           notes the closest integer value, and N is the original number
semble of defined sub-sums, each sub-sum defined by the               of data points, i.e.,
sum of sub-sums and so on. In other words, the RG ap-                                                   [N/n]
proach implies that a critical point results from the aggregate                          (n)         1   X (n)       (1)
                                                                                     Y         =              Y = nY
response of an ensemble of elements.                                                               [N/n] j=1 j
    Let us assume the renormalization group scaling relation:
                                                                          The variance for a monofractal time series is similarly
                               F (bx)
                       F (x) =                                (1)     given by [18]:
                                  a
                                                                                                   (n)                    (1)
This relation expresses the property of F (x) being self-affine,                         V ar(Y          ) = n2H V ar(Y         ),   (4)
i.e., the graph of F (x) on a scale bx has to be scaled down
by a factor 1/a to obtain the desired function on scale x.            where His the Hurst exponent, and the superscript on the av-
Whereas self-similarity refers to the fact that the shapes are        erage variable indicates that it was determined using all the
identical under magnification, self-affinity expresses the fact       original data without aggregation and the superscript on the
that F and x have to be scaled by different amounts for the           average variable indicates that it was determined using the
two views to become identical. Scale invariance means repro-          aggregation of data points. Thus the relative dispersion (RD)
ducing itself on a different time or space scale. An observable       for an aggregated data set is:
F which depends on a control parameter x is scale invariance                            q
                                                                                                    (n)
under the arbitrary change x → bx if there is a number a(b)                                V ar(Y )
such that Eq. (1) holds.                                                      RD(n) =          (n)
                                                                                             Y
     The solution to (1) is:                                                            q
                                                                                                        (1)
                                          ln (a)                                           n2H V ar(Y )
              F (x) = cxd     with   d=                       (2)                     =            (1)
                                                                                                            = nH−1 RD(1)         (5)
                                          ln (b)                                               nY
Power-laws are the hallmark of scale invariance as the ratio,         which is exactly an inverse power-law in the aggregation
(F (xb))/(F (x)) = bd , does not depend on x, i.e. the rela-          number for the Hurst exponent in the interval 0 ≤ H ≤ 1

                                                   Rev. Mex. Fı́s. 56 (1) (2010) 69–74
FRACTIONAL BROWNIAN MOTION IN DNA SEQUENCES OF BACTERIAL CHROMOSOMES: A RENORMALIZATION. . . 71
TABLE I. Analysis of DNA Sequences
Method Finding Reference
st nd
Frequency analysis Statistical confirmation of the 1 and 2 Parity Rules [4]
Positional Autocorrelation Function 3- and 10-11 base pair periodicities [5]
Correlation analysis 2nd Parity rule for n-tuples [6]
Fourier Spectra Long-range correlations in non-coding DNA sequences [7]
Detrending Fluctuation Analysis and Fourier Spectra Long-range correlations in non-coding DNA and lack of [8,9]
correlations in coding sequences
Multifractal spectra and wavelets analysis Self-similarity and multiple scalings in both coding and [9]
non-coding sequences
Indexes of base composition (C-G)/(C+G) Asymmetric substitution patterns coincide with Ori and [10]
Ter sites of chromosome replication (GC-skews)
Cumulative skew diagrams GC-skews [11,12]
Autocorrelation function Power-laws in long DNA sequences [13,14]
Markov models of sequence alignments Origin and nature of low- and high-order symmetric [15]
complementary DNA strands Long range correlations
in isochores
Log-log plots of standard deviation versus fixed window sizes Long range correlations in isochores [16]
Generalized Autocorrelation Long-range correlations of base composition at the 3 [17]
codon positions at distances which are multiples of 3
and anticorrelations for distances which are not multi-
ples of 3
Renormalization group approach Long-range correlations; inverse bilateral symmetry of [3,24]
whole bacterial chromosomes; critical scale invariance
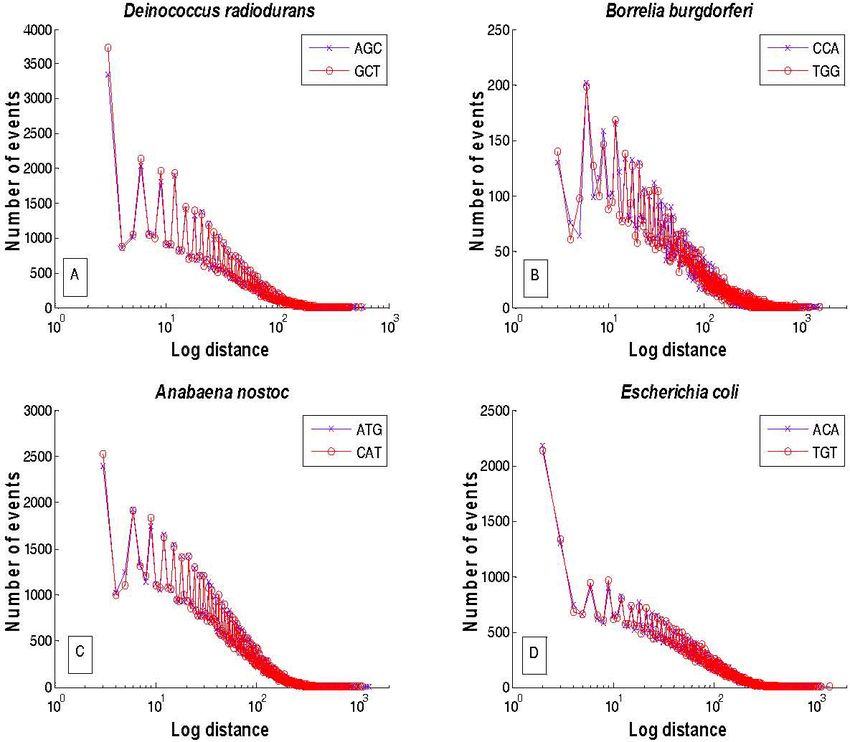
F IGURE 1. Log-linear plot of the frequency distribution of distances of (A) AGC (crosses) and GCT (empty circles) in D. radiodurans; (B)
CCA (crosses) and TGG (empty circles) in B burgdorferi; (C) ATG (crosses) and CAT (empty circles) in A. nostoc; (D) ACA (crosses) and
TGT (empty circles) in E. coli.
Rev. Mex. Fı́s. 56 (1) (2010) 69–7472 M.V. JOSÉ, T. GOVEZENSKY AND J.R. BOBADILLA
F IGURE 2. Aggregation analysis by chromosomal halves of the triplets (A) AGC and GCT in D. radiodurans; (B) CCA and TGG in B.
burgdorferi; (C) ATG and CAT in and TGT in E. coli. All fittings of Eq. (5) have correlation coefficients of r2 = [0.97 − 0.99].
It is well established [1819] that the exponent in such nitrogen-fixing cyanobacterium whose genome is very large
scaling equations is related to the fractal dimension, D of (∼6.4 Mb). E. coli is the most studied organism in biology
the underlying distance series by D = 2 − H. A simple and it is an enteric bacteria.
monofractal time series, therefore, satisfies the inverse pow- The complete sequences of D. radiodurans B.
erlaw relation for the RD given by Eq. (4), which can be burgdorferi, A. nostoc and E. coli. were retrieved
expressed by the linear regression relation [20]: from the NCBI, Genbank resource from the NIH
(http://www.ncbi.nlm.nih.gov) with the following corre-
ln RD(n) = ln (RD(1) ) + (1 − D) ln (n) (6) sponding accession numbers: NC 001263, NC 001318,
NC 003272; NC 000913.
4. Methods and results Instead of using the classical stochastic random walk
mapping rules of DNA (e.g. the purine–pyrimidine (RY)
We illustrate the RG approach with 4 bacteria: Deinococ- rule), the distance series of any triplet along chromosomal
cus radiodurans, Borrelia burgdorferi, Anabaena nostoc and halves were determined [3,23]. For a given triplet its ac-
Escherichia coli. D radiodurans is a bacterium that can tual position along the whole chromosome was determined
live through intense levels of radiation. A human being ex- and from this the actual distance series (distance measured in
posed to 1,000 rads of radiation energy, a dose delivered bases) of that particular triplet were obtained. In other words,
in the atomic explosions of Hiroshima and Nagasaki, dies we can directly visualize how a given triplet is distributed
within two weeks. At one million rads Deinococcus still sur- along the whole chromosome. In this work, we divide the
vives and at 3 million rads a very small number still endure. bacterial chromosomes into two non-overlapping halves ac-
The extraordinary genomic resilience of this impressive bac- cording to the location of the origin of replication usually
terium lies in its ability to repair broke DNA. B burgdorferi is denoted by “Ori”.
an spirochaete that produces Lyme disease, whose symptoms In Fig. 1 the frequency distributions of distances at which
are arthritis-like. A. nostoc is a filamentous (metazoan-like) some triplets (e.g. ATG and CAT which are reverse comple-
Rev. Mex. Fı́s. 56 (1) (2010) 69–74FRACTIONAL BROWNIAN MOTION IN DNA SEQUENCES OF BACTERIAL CHROMOSOMES: A RENORMALIZATION. . . 73
mentary of each other) are encountered along the bacterial that is the product of an inverse power-law and a modulation
chromosomes of the 4 studied bacteria are presented. Note function that varies as the logarithm of the aggregation num-
that the upper envelope of both distributions for each triplet in ber.
each bacterium occurs with a period of every 3 bases whereas In the literature it often appears that one has only two
the lower envelope occurs at distances different from the 3- choices, either a process is a monofractal or it is a multifrac-
base periodicity. These distributions are very similar for ev- tal. The latter applied to a distance series would imply that
ery pair of codons with its corresponding reverse comple- the fractal dimension changes over distances, ultimately lead-
mentary, and they display an oscillatory decaying pattern. ing to a distribution of fractal dimensions [20]. This is not
In Fig. 2 the results of the aggregation analysis of a given the situation here, however. The aggregated relative disper-
triplet and its reverse complementary for both halves of the sion indicates that the process has a preferential scale length,
chromosome of each bacterium are illustrated. The fitting of b, in addition to the monofractal behavior determined by the
the data using Eq. (5) produces straight lines whose slopes inverse power-law index d [3]. Thus there is the interleav-
lie between −0.5 < 1 − D < 0 in all bacteria indicating that ing of two mechanisms, one that is scale free and produces
the corresponding distance series follow an inverse power- the monofractal, and the other has equal weighting on a log-
law behavior and they are random monofractals. We also re- arithmic scale and is sufficiently slow as to not disrupt the
mark that log-periodic variation of the data about this power- much faster fractal behavior [3]. The tying together of the
law behavior can be observed if we amplify the behavior of long and the short distance scales is necessary in order to
the relative dispersion for large window sizes, as was clearly adaptively regulate the complex DNA sequences in a chang-
shown in a previous work (3). In Table I, the fractal dimen- ing environment. The log-periodic modulation of the inverse
sions for each pair of triplets for each bacterium is shown. power-law is a consequence of the correlation function satis-
Note that all scaling exponents lie between 1.51 (e.g. AGC in fying a renormalization group relation and having a complex
B. burgdorferi) and 1.68 (e.g. TTA, TAA and TGG in E. coli). fractal dimension [2].
In regard to the type of symmetry of the bacterial chromo-
somes, note, for example, that in D. radiodurans for the 1st
half of the chromosome the slope of the aggregation analysis TABLE II.
gives H = 0.37 and, for the 2nd half H = 0.36 Using the Triplet Half Anabaena Borrelia Deinococcus Escherichia
relation, D = 2 − H the corresponding fractal dimension of
nostoc burgdorferi radiodurans coli
AGC for the 1st half and for the 2nd half of the chromosome
are D = 1.63 and D = 1.64, respectively. These estimates first 1.59 1.51 1.63 1.61
AGC
are in turn obtained for the reverse complementary triplet of second 1.56 1.55 1.64 1.59
AGC which is the triplet GCT, whose fractal dimensions in first 1.54 1.55 1.65 1.63
the 2nd and in the 1st half of the chromosome are D = 1.65 GCT
second 1.60 1.58 1.62 1.62
and D = 1.62, respectively (see Table II). Since the scaling
first 1.63 1.59 1.59 1.68
exponent of a given triplet along one half of the chromosome TTA
is similar to the scaling exponent of the reverse complement second 1.61 1.60 1.61 1.66
in the other half, then the chromosome of D. radiodurans first 1.63 1.62 1.61 1.68
TAA
does posses inverse bilateral symmetry. This type of symme- second 1.57 1.60 1.61 1.65
try is also clearly observed for the triplets AGCGCT, ATG- first 1.59 1.65 1.58 1.61
CAT and CCA-TGG in A. nostoc, for TTA-TAA, ATG-CAT, ACA
second 1.57 1.60 1.56 1.62
and CCA-TGG in B. burgdorferi, for AGC-GCT, TTA-TAA,
TAG-CTA, and CCA-TGG in D. radiodurans, and for ACA- first 1.64 1.53 1.59 1.60
TGT
TGT in E. coli In any case, for a given triplet the relative second 1.59 1.67 1.61 1.61
dispersion has a dominant inverse power-law with an index first 1.57 1.68 1.60 1.62
ATG
given by d and is modulated by a function that varies log- second 1.58 1.65 1.64 1.60
arithmically with a fundamental period ln (b). The magni-
first 1.60 1.65 1.59 1.62
tudes of the fractal dimension D, reveal that there are long- CAT
range correlations in the distance series of a given triplet cor- second 1.58 1.68 1.60 1.66
responding to what is called fractional Brownian motion. A first 1.58 1.54 1.61 1.62
TAG
particular type of randomness, which seems to maximize the second 1.57 1.59 1.59 1.61
information content, is also displayed by the distance series first 1.59 1.55 1.58 1.65
of triplets. CTA
second 1.56 1.56 1.58 1.61
first 1.57 1.67 1.59 1.64
5. Conclusions CCA
second 1.59 1.67 1.62 1.65
In this work we have used a renormalization group approach first 1.57 1.67 1.60 1.66
TGG
to obtain an expression for the aggregated relative dispersion second 1.57 1.66 1.61 1.68
Rev. Mex. Fı́s. 56 (1) (2010) 69–7474 M.V. JOSÉ, T. GOVEZENSKY AND J.R. BOBADILLA
Sornette argues that the log-periodicity is a result of what The fractional Brownian nature in DNA sequences of
he calls Discrete Scale Invariance, that is, also a consequence bacterial chromosomes as obtained by the RG approach must
of renormalization group properties of the system. be clearly considered in sequence analysis and in any further
According to the renormalization group theory [1], the studies on the evolution of prokaryotes and eukaryotes.
nature of bacterial genomes pertains to a class of phenomena,
where events at many scales of length make contributions of Acknowledgments
equal importance. Any scaling analysis of DNA sequences
must take into account the entire spectrum of length scales M.V. José was financially supported by PAPIIT IN205307,
since we are facing a system near its critical point [24]. There UNAM, México and by the Macroproyecto de Tecnologı́as
seems to be nothing more deterministic than the sum or mul- para la Universidad de la Información y la Computación
tiplication of a large number of random variables [22]. (MTUIC).
1. K.G. Wilson, Scientific American 241 (1979) 158. 15. P.F. Baisnee, S. Hampson, and P. Baldi, Bioinformatics 18
2. D. Sornette, Critical Phenomena in Natural Sciences, Chaos, (2002) 1021.
Fractals, Self-organization and Tools (Springer, Berlin. 2000). 16. O. Clay, N. Carels, C. Douady, G. Macaya, and G. Bernardi,
3. M.V. José, T. Govezensky, and J.R. Bobadilla, Physica A 351 Gene 276 (2001) 15.
(2005) 477. 17. P. Bernáola-Galván, P. Carpena, R. Román-Roldán, and J.L.
4. V.V. Prabhu, Nucleic Acids Res. 21 (1993) 2797. Oliver, Gene 300 (2002) 105.
5. E.N. Trifonov and J.L. Sussman. Proc. Natl. Acad. Sci. USA 77 18. J.B. Bassingthwaighte, L. Liebovitch, and B.J. West, Fractal
(1980) 3816 Physiology (Oxford University Press, New York. 1994).
6. V.V. Prabhu. Nucleic Acids Res. 12 (1993) 2797. 19. B.J. West and L. Griffin, Chaos Solitons Fractals 10 (1999)
1519.
7. W. Li and K. Kaneko, Europhys. Lett. 17 (1992) 655.
20. B.J. West, V. Bhargava, and A. Goldberger, J. Appl. Phys. 60
8. C.K. Peng et al., Nature 356 (1992) 168.
(1986) 1089.
9. S.V. Buldyrevet et al., Phys. Rev. E 51 (1995) 5084.
21. J. Feder, Fractals (Plenum Press, New York. 1988).
10. A. Arneodo, E. Bacry, P.V. Graves, and J.-F. Muzy, Phys. Rev.
22. B.V. Gnedenko and A.N. Kolmogorov, Distributions for Sum
Lett. 74 (1995) 3293.
of Independent Random Variables (Addison Wesley, Reading
11. J.R. Lobry, Mol. Biol. Evol. 13 (1996) 660. MA. 1954).
12. A. Grigoriev, Nucleic Acids Res. 26 (1998) 2286. 23. J. Sánchez and M.V. José, Biophys. Biochem. Res. Comm. 299
13. M.V. de Sousa, Phys. Rev. E 60 (1999) 5932. (2002) 126.
14. W. Li, G. Stolovitzki, P. Bernáola-Galván, and J.L. Oliver, 24. M.V. José, T. Govezensky, J.A. Garcı́a, and J.R. Bobadilla,
Genome Res. 8 (1998) 916. PLoS ONE 4 (2009) 4340.
Rev. Mex. Fı́s. 56 (1) (2010) 69–74You can also read