FY21 Half Year Results - 18 February 2021 - Bell Direct
←
→
Page content transcription
If your browser does not render page correctly, please read the page content below
FY21 Half
Year Results
18 February 2021

                   1
Forward
             Important Notice
             The purpose of this presentation is to provide general information about Fortescue Metals Group
             Ltd (“Fortescue”). It is not recommended that any person makes any investment decision in relation

Looking      to Fortescue based on this presentation. This presentation contains certain statements which may
             constitute “forward-looking statements”. Such statements are only predictions and are subject to

Statements
             inherent risks and uncertainties which could cause actual values, results, performance or
             achievements to differ materially from those expressed, implied or projected in any forward-looking
             statements. No representation or warranty, express or implied, is made by Fortescue that the

Disclaimer   material contained in this presentation will be achieved or prove to be correct. Except for statutory
             liability which cannot be excluded, each of Fortescue, its officers, employees and advisers
             expressly disclaims any responsibility for the accuracy or completeness of the material contained in
             this presentation and excludes all liability whatsoever (including in negligence) for any loss or
             damage which may be suffered by any person as a consequence of any information in this
             presentation or any error or omission therefrom. Fortescue accepts no responsibility to update any
             person regarding any inaccuracy, omission or change in information in this presentation or any
             other information made available to a person nor any obligation to furnish the person with any
             further information.

             Additional Information
             This presentation should be read in conjunction with the Annual Report at 30 June 2020 together
             with any announcements made by Fortescue in accordance with its continuous disclosure
             obligations arising under the Corporations Act 2001 and ASX Listing Rules. Any references to
             reserve and resources estimations should be read in conjunction with Fortescue’s Ore Reserves
             and Mineral Resources statements released to the Australian Securities Exchange on 21 August
             2020. Fortescue confirms in the subsequent public report that it is not aware of any new information
             or data that materially affects the information included in the relevant market announcement and, in
             the case of estimates of mineral resources or ore reserves, that all material assumptions and
             technical parameters underpinning the estimates in the relevant market announcement continue to
             apply and have not materially changed. All amounts within this presentation are stated in United
             States Dollars consistent with the functional currency of Fortescue Metals Group Ltd, unless
             otherwise stated. Tables contained within this presentation may contain immaterial rounding
             differences.
                                                                                                                     2
World class
company       Long term
              sustainability
                                                                     Balance sheet
                                                                     strength

                                                          Wholly
                               Industry                   owned, fully
                               leading
                               cost       Vision          integrated
                                                          supply chain
                               position
                                           and
                                          Values

                                            Secure and
                                            reliable supplier
              Growth and                    of iron ore
                                                                         Enhanced
              development                                                returns to
                                                                         shareholders

                                                                                        3
Integrated mine to market infrastructure
Delivering sustained operational efficiencies

                                                4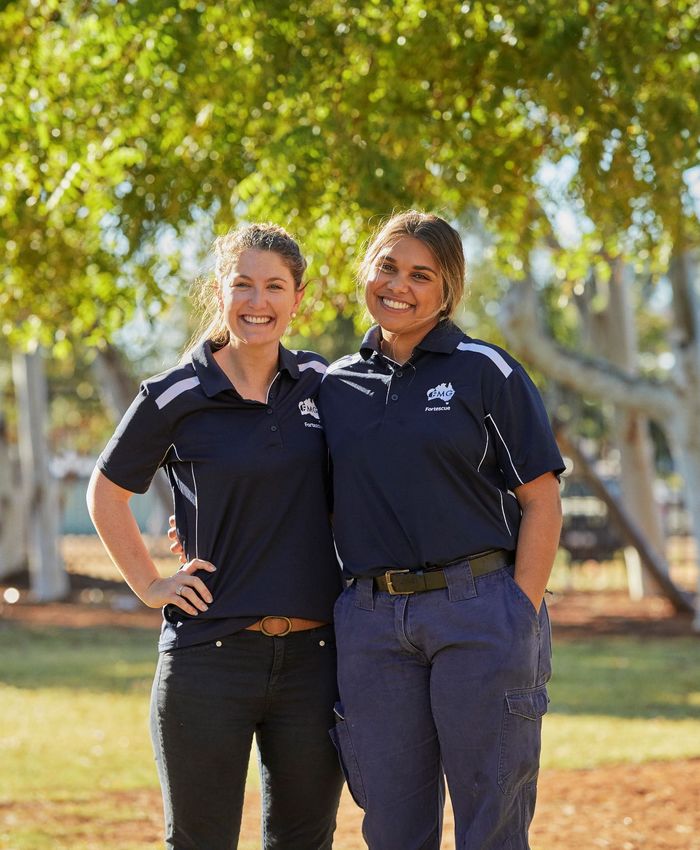
Our strategic focus
Underpinned by operational excellence Sustainability
and balance sheet strength Ensuring communities benefit
from Fortescue’s success
Optimising
Returns and growth from
our operations
Diversifying
Commodities that support
decarbonisation
Pursuing
Green energy opportunities
locally and internationally
5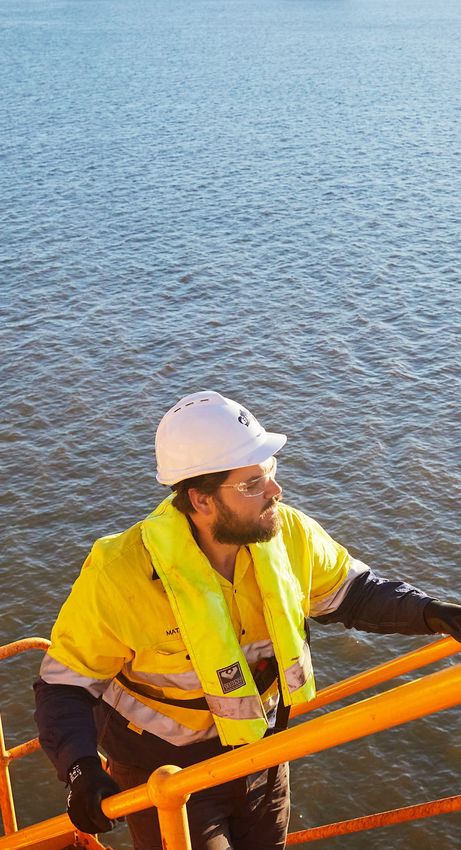
Approach to Sustainability
We are a global force, committed to empowering thriving communities
Setting Safeguarding the Creating positive
high standards environment social change
Employee health and safety Climate change action and Creating employment and
disclosure business opportunities for
Economic contribution Aboriginal people
Protecting biodiversity and
Workforce diversity Building sustainable
water resources
Protecting Aboriginal heritage communities
Tailings management
Ethical business conduct Human rights
6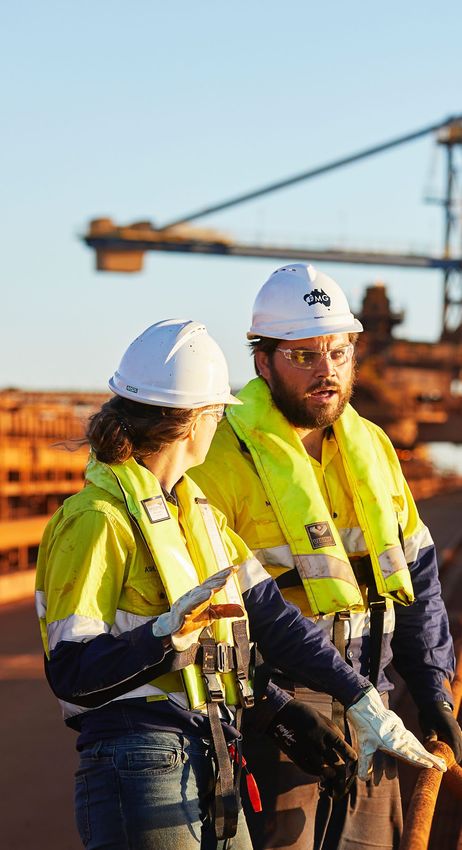
Setting high   Safety, diversity, integrity
standards
               2.1 TRIFR
               13% improvement from 30 June 2020

               20% female
               employment rate

               10% Aboriginal
               employment rate across total workforce

               Recognition
               Inclusion in the 2020 Dow Jones
               Sustainability Indices

                                                        7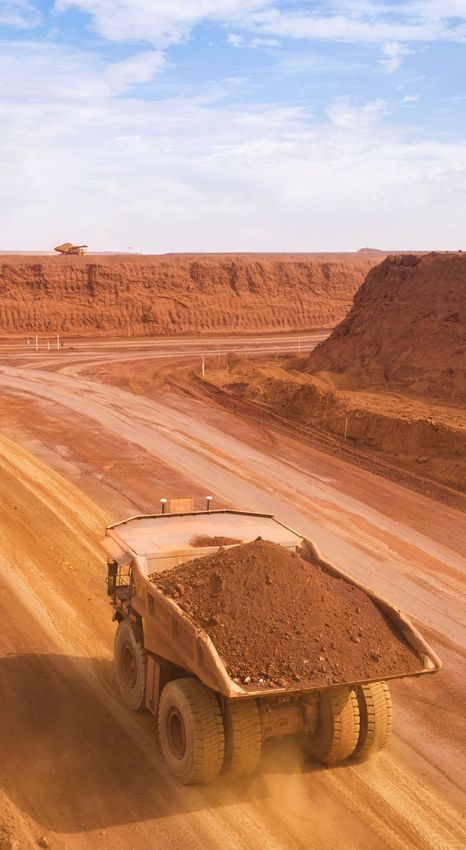
Protecting            Detailed processes for
Aboriginal heritage   engagement and heritage
                      management

                      Seven agreements
                      with Native Title Groups

                      Heritage avoidance
                      Primary objective

                      ~6,000 heritage sites
                      Protected and avoided

                      2.7 million ha of land
                      Ethnographically surveyed

                                                  8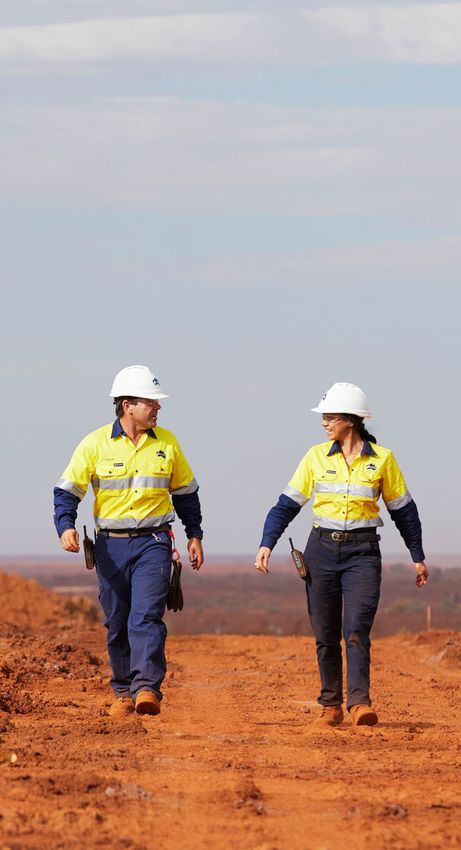
Safeguarding the   An ambitious, industry leading
environment        emissions reduction target

                   Net zero
                   Operational emissions by 2040

                   26% reduction
                   Scope 1 and Scope 2 emissions by 2030

                   Decarbonisation pathway
                   Energy infrastructure to increase use
                   of renewables

                   Technology and innovation
                   Hydrogen and battery electric solutions

                                                             9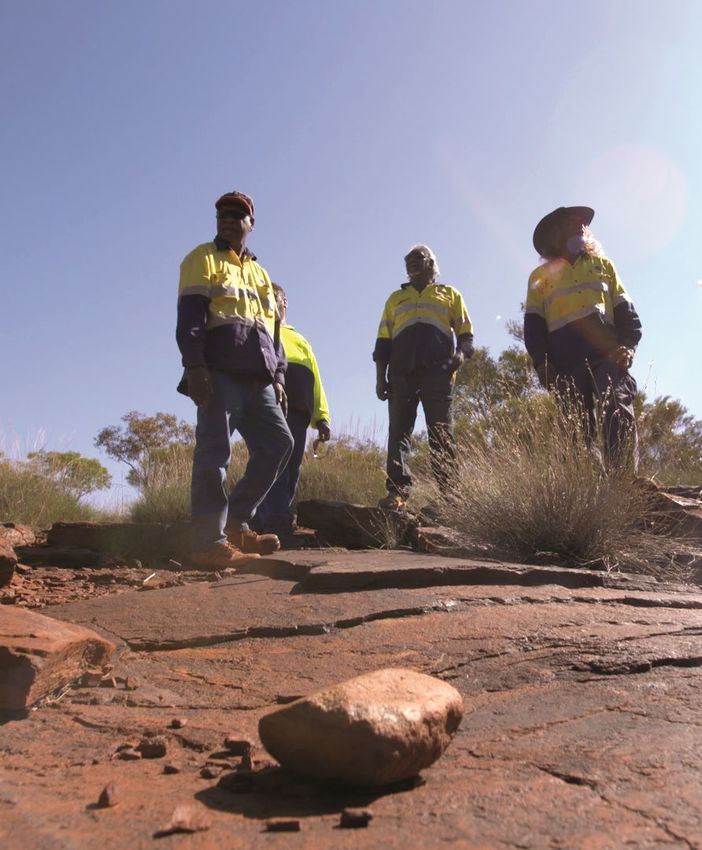
Pathway to decarbonisation
Underpinned by practical initiatives that will deliver goals in an
economically sustainable manner
Chichester solar gas Pilbara Energy Connect Hydrogen
hybrid project
US$100 million investment by US$250 million Pilbara Reduce carbon emissions and
Alinta Energy Transmission Project reliance on diesel in our
operations
60MW of solar generation 275km of high voltage
transmission lines Hydrogen mobility and
60km transmission line linking
US$450 million Pilbara improving domestic energy
Chichester operations with
security
Alinta Energy’s Newman Generation Project
gas-fired power station Export potential of green
150MW of gas fired
hydrogen from Australia
35MW battery facility generation, 150MW of
solar PV and large-scale Investment in new hydrogen
Displaces 100 million litres of battery storage technologies through key
diesel strategic partnerships
10Creating positive Building thriving communities and
social change empowering Aboriginal people
through training, employment and
business development
900 jobs
to Aboriginal people via VTEC since 2006
Fortescue’s Trade Up
Providing an accredited pathway to a trade
qualification
Billion Opportunities
A$3 billion in contracts to Aboriginal
businesses and joint ventures since 2011
11Safety and Empowering the Fortescue family to look out
unique culture for their mates on the journey to zero harm
Total Recordable Injury Frequency Rate
9.2
7.6
6.0
5.1
4.3
3.7
2.9 2.8
2.4
2.1
FY12 FY13 FY14 FY15 FY16 FY17 FY18 FY19 FY20 H1 FY21
12No cases of COVID-19 across Fortescue’s
Ongoing operational sites
response to
COVID-19 Incident Management Communications
Team Providing regular updates to
Regular meetings to review team members, contractors,
operations and latest suppliers and key stakeholders
government advice
Strict hygiene and Implementation of
physical distancing screening programs
PCR testing and mandatory
temperature testing
Support for interstate Mental health and
team members wellbeing
Assisted over 600 relocate to WA 24/7 support through the
temporarily or permanently Fortescue Chaplains and
Employee Assistance Program
13H1 FY21 Record half year shipments and first ore
operational celebrated at the Eliwana mine
highlights
90.7 $12.78
US
mt shipped /wmt
Record shipments C1 cost
2% on H1 FY20 No change
$114 90%
US
/dmt
Average revenue Average revenue realisation
42% on H1 FY20 7% on H1 FY20
14H1 FY21
financial
highlights
US
$9.3bn US
$6.6bn
Revenue Underlying EBITDA at a
71% margin
US
$4.1bn 47%
Net profit after tax Return on equity
US
$1.33
A
$1.47
Earnings per share Interim dividend
(A$1.84) Payout ratio of 80%
15H1 FY21
financial
$4.4bn $2.5bn
US US
highlights
Net operating cashflow Free cashflow
US
$4.0bn US
$110m
Cash on hand Net debt
21% 0.4x
Gross gearing Gross debt / EBITDA
16Shareholder returns Dividend policy to payout 50 to 80
per cent of full year NPAT, targeting
Highest single dividend in the top end of the range
Fortescue’s history
A
$1.47per share
Fully franked interim dividend
80% of H1 FY21 NPAT
Dividend payout ratio
Growth
Intention to allocate 10 per cent of
NPAT to fund renewable energy
growth through FFI, and 10 per cent to
other resource growth opportunities
17Revenue and earnings
Record half year revenue and earnings
Revenue (US$m) Underlying EBITDA NPAT
6,639
9,335 4,084
6,425 6,485 6,335 4,414 4,228 4,147 2,543 2,453
2,282
3,540
1,633
644
H1 H2 H1 H2 H1 H1 H2 H1 H2 H1 H1 H2 H1 H2 H1
FY19 FY19 FY20 FY20 FY21 FY19 FY19 FY20 FY20 FY21 FY19 FY19 FY20 FY20 FY21
18Underlying EBITDA
Strong price realisations, higher volumes and disciplined cost control
19Focus on Generating strong margins through the
cycle
margins
Prices and EBITDA margin (US$/dmt)
Underlying EBITDA Realised price
62 Platts CFR Index Average Underlying EBITDA
Average realised price
140
120
100
80
80
60
40
52
39
20 30
21 20
0
FY16 FY17 FY18 FY19 FY20 H1 FY21
20Strong cashflow generation
After reinvesting in the business and investing in growth
Net cash from operations (US$m) Capital expenditure Free cash flow
4,410
3,425 3,301
3,114
2,906
2,519
2,257 2,192
1,891
948 1,109
857
526 519 422
H1 H2 H1 H2 H1 H1 H2 H1 H2 H1 H1 H2 H1 H2 H1
FY19 FY19 FY20 FY20 FY21 FY19 FY19 FY20 FY20 FY21 FY19 FY19 FY20 FY20 FY21
21Capital expenditure
Increased investment in major projects
H1 FY21 Capital expenditure (US$m) FY20 Capital expenditure (US$m)
647
771
US US
US$1,890m US$1,966m
1,079
1,185
58
116
-
Sustaining and development capital Sustaining and development capital
Exploration and studies Exploration and studies
Major projects Major projects
22Balance sheet capacity
Maintain targeted investment grade credit metrics
Gross debt (US$m) Debt maturity profile excluding leases (US$m)
6,771 Syndicated Term Loan Senior Unsecured Notes
5,113 750 750
4,471 600 600
3,975 3,952 4,084
500
FY16 FY17 FY18 FY19 FY20 H1 FY21 CY20 CY21 CY22 CY23 CY24 CY25 CY26 CY27
Gross debt to EBITDA (x) Gross gearing (%)
2.1
Target 1-2x 45
Target 30-40%
31
1.2 29 27 28
0.9 21
0.7 0.6
0.4
FY16 FY17 FY18 FY19 FY20 H1 FY21 FY16 FY17 FY18 FY19 FY20 H1 FY21
H1 FY21 Gross debt to last twelve months EBITDA 23Disciplined capital allocation Aggregate earnings and cashflows FY14 – H1 FY21 1 Includes share buyback 2 From peak debt of US$12.7 billion at 30 June 2013, including lease payments 24
High returns   A profitable and capital efficient business
on capital
                                            Return on capital employed, ROCE1 (%)

                                                     ROCE                     Average ROCE
               45
                                                                                                                               46
               40

               35                                                                                          37
               30

               25
                                                                                       29

               20
                                               20
               15

               10
                           10                                      11
               5

               0
                          FY16               FY17                FY18                FY19                FY20             H1 FY21

                1ROCE is calculated as earnings before interest and tax divided by average capital (total assets minus current liabilities)
                H1 FY21 is last twelve months
                                                                                                                                              25
Targeting the top end of the dividend
Capital returns policy to payout 50-80 per cent of full year
a priority net profit after tax
Dividends (A$/share) and payout ratio (%)
2.00 77% 0.9
78% 1.76 80%
1.80 0.8
1.60 0.7
1.47
62%
1.40
0.6
52% 1.14
1.20
0.5
1.00
38% 36% 0.4
0.80
0.3
0.60 21% 21% 0.45
17% 16% 0.2
0.40
0.20 0.23
0.20 0.15 0.1
0.07 0.08 0.10
0.05
0
FY11 FY12 FY13 FY14 FY15 FY16 FY17 FY18 FY19 FY20 H1
FY21
Dividend Dividend - Declared Payout ratio
26Integrated operations
27Forefront of innovation
Delivering safety, productivity and efficiency benefits
Operational excellence Data and analysis Renewable energy
Optimising value from Driving informed Maximising
our asset base decision making opportunities
Current Current Current
• Autonomous haulage • Fortescue Hive • Solar energy
• Relocatable conveyors • Robotic Process Automation • Integration of renewables
• OPF upgrades and WHIMS • Battery storage
Under development
Under development • Advanced analytics and
• Additional equipment machine learning Under development
automation • Transformation of information • Hydrogen mobility
• Magnetite processing and decision support systems • Hydrogen refuelling
infrastructure
28Value chain
29Autonomous haulage
Operational Completion of Chichester Hub project
development projects >62 million kilometres safely travelled
183 trucks in operation
Wet High Intensity
Magnetic Separation
(WHIMS) plant
Maximising production rates
Enhancing the value of our ore
Extension of relocatable
conveyor
Extended to 10km
Located proximate to mining pits
Moved, lengthened or shortened as needed
30Eliwana Mine and Rail
Delivered in line with schedule at an industry-low capital intensity
Eliwana Ore Processing Facility Eliwana rail
31Marketing
Aligning with needs of customers and market;
strategy creating value through supply chain optimisation
Integrated operations Direct customer
and marketing engagement
Timely and coordinated supply Aligning our products with what
chain response to customer our customers need and value
needs in a dynamic market most
Commercial excellence Technical collaboration
Strong analytical capability Deepening our understanding
driving deep market insights and and ability to respond to current
value-added decision making and emerging industry trends
32Global steel demand exceeded expectations
With record crude steel production in China, as well as robust global recovery
China crude steel production (2020) Pig iron production Steel margins (2H 2020)
(mt) RMB/t
(mt)
85
1000
100
80 900
95
90 800
75
85 700
70
80 600
65 500
75
70 60 400
65 300
55
60 200
50
55 100
50 45 0
Jan Feb Mar Apr May Jun Jul Aug Sep Oct Nov Dec Jan Feb Mar Apr May Jun Jul Aug Sep Oct Nov Dec
China ROW 2019 2020 Rebar Profit HRC profit
Source: World Steel Association, China NBS, Platts
33Supporting strong iron ore demand
China’s iron ore imports increase to 1.7bn tonnes in calendar year 2020
YoY China iron ore imports Iron ore stocks Iron ore prices
(days of consumption)
(mt)
120
100
200
90
100 180
80 160
80 70 140
60 120
60 50 100
40 80
40
30 60
20 40
20
10 20
- 0 0
Jan 19 Apr 19 Jul 19 Oct 19 Jan 20 Apr 20 Jul 20 Oct 20 Jan 19 Apr 19 Jul 19 Oct 19 Jan 20 Apr 20 Jul 20 Oct 20
Brazil Australia India Others Port Inventory Mill Inventory Platts 62% CFR Index
Source: China Custom, Mysteel, Platts 34Fortescue’s average realised price of US$114/dmt
Strong or 90% of the Platts CFR index
realisations
$126.1
$95.3 $91.1
$91.4
Jan 19 Apr 19 Jul 19 Oct 19 Jan 20 Apr 20 Jul 20 Oct 20
Platts 62% Fe Index Half yearly Platts price SSF (Portside) FB (Portside)
92% 91%
89%
86% 86% 86%
83% 82%
Q3 FY19 Q4 FY19 Q1 FY20 Q2 FY20 Q3 FY20 Q4 FY20 Q1 FY21 Q2 FY21
Fortescue Realised Price (%) Platts 62% Fe Index 35Growth and
development
36Detailed review complete, further
Iron Bridge technical and commercial
assessment underway
Magnetite Project
Up to US$3.0 billion
Total capital estimate subject to validation
through further technical assessment and
Joint Venture approval
22mtpa
Production capacity; first production
revised to second half of calendar year
2022, subject to review and JV approval
67% Fe
High grade, low impurity concentrate
product
37Exploration Western Australia
Extensive tenement footprint
Focus on copper and
commodities that support
decarbonisation Australia
NSW 3,000km2 tenure
SA 15,000km2 tenure
South America
Argentina 450,000ha of tenements
Ecuador 135,000ha of tenements
Colombia, Chile, Peru
Other international
opportunities
Portugal, Kazakhstan
38Fortescue Future Renewable energy driving new
Industries green industries
Assessing
A portfolio of renewable energy and
green industry opportunities
Maintaining
Fortescue’s disciplined capital allocation
framework and dividend policy
Funding
Renewable energy growth
throTargeting 10% of full year NPAT
to fund renewable energy growth
39Building on our Leveraging Fortescue’s value
track record chain and project development
capabilities
Rapid development
Ability to safely develop large, complex
projects quickly and at low cost
Innovative culture
Adapting technology and innovation to
drive safety and productivity improvements
Stakeholder engagement
Working with local stakeholders to ensure
communities thrive
40FY21 guidance
178 – 182 mt
Iron ore shipments
US$13.50 –
US$14.00/wmt
C1 cost based on assumed
exchange rate of AUD:USD 0.75
US$3.0 –
US$3.4 billion
Capital expenditure at the upper
end of the range
4142
43
You can also read