Ni2Fe3 Metal Catalyst and Cellulose Ratio Impact on Pyrolyzed Bio-Oil - MATEC Web of Conferences
←
→
Page content transcription
If your browser does not render page correctly, please read the page content below
MATEC Web of Conferences 333, 09003 (2021) https://doi.org/10.1051/matecconf/202133309003
APCChE 2019

 Ni2Fe3 Metal Catalyst and Cellulose Ratio Impact on Pyrolyzed
 Bio-Oil
 Siyi LI and Jeffrey S. CROSS*
 Energy Science and Engineering, Department of Transdisciplinary Science and Engineering, Tokyo Institute of Technology, 2-12-1,
 Ookayama, Meguro, Tokyo 152-8552, Japan

 Abstract Carbon neutral bio-oil is needed to replace liquid fossil fuels in order to reduce CO2
 emissions and global warming. However, the quality of bio-oil produced from biomass contains
 too much sugar, which is undesirable. Investigating a new method to reduce sugar concentration
 by changing the ratio between cellulose and catalyst is necessary because other methods all
 require additional costs. In this study, the Ni2Fe3 and cellulose have been chosen as the model
 catalyst and model biomass compound, respectively. Five different ratios have been chosen for
 investigation, 4:1, 2:1, 1:1, 1:2 and 1:4 (weight ratio= cellulose: catalyst) The cellulose pyrolysis
 experiments results show the bio-oil yield increases as the catalyst amount or ratio is increased
 initially and then decreased. The 2:1, 1:1, 1:2 shows the highest yields among the five different
 ratios. From GC-MS analysis, the sugar reduction increases initially and then decreases. Based
 on both results, the best cellulose/catalyst ratio was 2:1 or 1:1, which is attributed to optimized
 heat conduction.

 1. Introduction can improve product oil by reducing sugar and oxygen
 content. However, there are few works focusing on
 Renewable liquid fuels are needed in order to reduce finding how the ratio between biomass model
 CO2 emissions and global warming. The production of compounds and catalyst influence the component of bio-
 bio-oil as a transportation fuel is a potential answer oil. There is a clear need to choose a suitable catalyst and
 (Muis et al., 2010; Krajačić et al., 2011; Shafiei and biomass in order to investigate this relationship. Based
 Salim, 2014; Charfeddine and Kahia, 2019). Bio-oil is on our knowledge, an easy to recover and recycle
 produced through contemporary biological processes, homogenous cluster catalysts is the best choice to
 typically involving renewable feedstocks such as produce bio-oil efficiently.
 biomass and possibly by anaerobic digestion. Bio-oil can A cluster is an ensemble of bound atoms or
 also be derived directly from domestic resources, molecules that are intermediate in size between a
 industrial and commercial waste. molecule and a bulk solid. The metal cluster can also be
 Bio-oil produced through pyrolysis of biomass has used as a catalyst (such as Ru3(CO)12, Au cluster, etc.);
 a high oxygen content (e.g., sugars), low energy density, they sometimes also bound to some other metal or
 and it is hard to use for vehicles directly. Until now, cluster (Oguri et al., 2013). The cluster catalyst has
 various methods and techniques were used to remove excellent properties, the absence of large bulk phases
 sugar in order to reduce oxygen content. For example, leads to a high surface-to-volume ratio, which is
 pretreat the reactant before the experiment, Like Torr’s advantageous in any catalyst application as this
 group (Xin et al., 2019) used pretreatment pine wood to maximizes the reaction rate per unit amount of catalyst
 do the pyrolysis experiment, put the wood in 1 wt% material, which also minimizes cost.
 acetic acid solution for 4 h. The result shows that this Considering potential large-scale applications,
 method could remove more than 10% sugar. Pressure catalysts made of cheap and earth-abundant elements are
 distillation is also a useful method to remove sugar, crucial for economically viable energy conversion
 reducing oxygen content. For example, reduced pressure processes. Instead of using rare earth or expensive
 distillation was performed to obtain distilled bio-oil by metals, it is better to focus on making catalysts with
 Zheng’s group (Zheng and Wei, 2011). Through this nickel and iron in order to build a new type of catalytic-
 method, they reduce the sugar content from 0.9% to cluster.
 0.1%. Besides, some groups used supercritical solvents In this study, cellulose was chosen as the reactant
 to remove oxygen, like Savage’s group (Duan and for pyrolysis, because it is the major component of
 Savage, 2011) that upgraded the crude algal bio-oil using biomass and often used as a model compound. Then, the
 supercritical water method (SCW). The SCW method Ni2Fe3 cluster catalyst will be chosen as the catalyst

 *
 Corresponding author: cross.j.aa@m.titech.ac.jp
© The Authors, published by EDP Sciences. This is an open access article distributed under the terms of the Creative Commons Attribution License 4.0
(http://creativecommons.org/licenses/by/4.0/).
MATEC Web of Conferences 333, 09003 (2021) https://doi.org/10.1051/matecconf/202133309003
APCChE 2019

 model (based on our group's previous result). Five the reactor to the condenser. The vapors were condensed
 different ratios between cellulose and catalyst have been using cold water by the condenser. The bio-oil was
 chosen to investigate the relationship between the collected and analyzed by GC-MS. The amount of bio-
 cellulose/catalyst ratio and bio-oil component. The ratios oil and char and coke were weighed, and then the
 are 4:1, 2:1, 1:1, 1:2 and 1:4. The final goal of this study amount of gas was calculated by subtracting the amount
 is to discern how the ratio influences bio-oil composition of bio-oil and char & coke from the initial feed (Figure
 in order to assess its economic feasibility. 1).

 2. Experimental Method 2.3 XRD and SEM test

 2.1 Catalyst preparation XRD analysis of catalysts was conducted by X-ray
 Diffractometer (Mini Flex 600). 45 kV and 15 mA were
 The biomass feed, 38 μm powdered cellulose from Wako used for the X-ray tube operation. The scan range (2
 Pure Chemical Industries, and cellulose was directly theta) of the XRD pattern was collected from 5° to 90°
 used without any modification. using filtered Cu radiation.
 The Ni2Fe3 catalyst is prepared by the sol-gel Images of catalysts were obtained by a scanning
 method, which method is appropriate to get cluster electron microscope (VE-9800) operated at 10 kV. The
 structural (De et al.,1996; Jayaprakash et al., 2015). The catalyst was firstly immersed in alcohol. Then the
 chemicals were citric acid, Fe(NO3)3·9H2O, ethylene samples were loaded and dried on a copper grid (carbon-
 glycol, and Ni(NO3)2·6H2O, as also purchased from coated) before the test.
 Wako Pure Chemical Industries. The mol ratio between
 Metal ion (Ni, Fe) and citric acid is 1:1.2. The
 2.4 GC-MS analysis method
 preparation of catalysts was performed at room
 temperatures following: 5.81 g Fe(NO3)3·9H2O and 12.1 In order to identify organic compounds and analyze the
 g Ni(NO3)2·6H2O was dissolved in 30 ml of distilled component of the bio-oil samples, GC–MS equipment
 water and stirred for 5 hours. Then 5 ml of ethylene was used to analyze bio-oil samples. The analysis was
 glycol and 11.1 g citric acid was added in a beaker. Then performed on a GC-2010 Plus equipped with a GC–MS-
 the transparent solution was stirred for 15 hours at which QP2010 SE mass-detector made by Shimadzu. The
 time the solution became uniform. The transparent sol column type was Stabilwax-DA 30 m x 0.25 mm, 0.25
 was dried at 110⁰C in an oven for 20 hours. Then using a μm diameter. The analysis was run with a 10:1 split
 furnace and calcined at 700⁰C to burn off hydrocarbons entry. The oven temperature was held at 40°C for 5 min
 under 95% N2 and 5% H2 mix gas. Finally, the catalysts and then ramped to 50°C at 1°C/min. Next, it was
 were crushed into powder in a mortar and pestle. After ramped to 130°C at 2°C/min. Finally, the temperature
 repeating this process many times, enough catalyst was was ramped to 260°C at 4°C/min and held for 10 min.
 obtained. The compounds were identified by comparing the mass
 spectra to NIST 11 MS library of compounds using the
 2.2 Pyrolysis method GC–MS software. A similarity threshold of over 80 was
 used to identify the compounds. All GC–MS
 Cellulose (4 g) was loaded in a 50 mm diameter quartz experiments were conducted in duplicates, and the
 reactor with a different mass of catalyst (1 g, 2g, 4g, 8g, standard deviations were calculated.
 16g, respectively). Then the entire system was purged
 with flowing nitrogen gas for 7 min in order to expel all
 air. Afterward, the reactor was heated to the set
 temperature (450°C) with a heating rate of 45°C/min.
 Then the nitrogen gas carried the pyrolyzed vapors from

 Figure 2. XRD patterns of unused and used catalysts
 Figure 1. Experimental set-up for pyrolysis experiment

 2
MATEC Web of Conferences 333, 09003 (2021) https://doi.org/10.1051/matecconf/202133309003
APCChE 2019

 Figure 4. Bio-oil, gas and coke yields from pyrolysis of
 cellulose for different ratio
 for producing cluster structures. It should be noted that
 previous literature on the bimetallic catalysts (Ni, Fe)
 only exhibited a single peak indicating the formation of a
 Ni– Fe solid solution (Nie et al., 2014). The intensity of
 XRD peaks of the sample in Figure 2 reflects that the
 formed particles are crystalline and broad diffraction
 peaks indicate very small size crystallites.
 The SEM images are shown in Figure 3 of a typical
 particle with an uneven surface. From the images a), the
 particle size is nearly 800 nm, images b) shows the
 particle is more than 30 μm. It is easy to find that the
 particle size increases when adding more catalyst. When
 the catalyst ratio is high, the catalyst has little physical
 contact with the cellulose, which auto-aggregates at high
 temperatures.
 Figure 3. SEM images of a) before experiemnt b) ratio=1 :4
 after experiment catalyst particles 3.2 Pyrolysis results

 3. Results and Discussion 3.2.1 Yield results of pyrolysis
 The catalysts were mixed with the cellulose directly. The
 3.1 XRD and SEM analysis
 mass of bio-oil and coke were weighed, then the yields
 X-ray diffraction patterns of the unused catalysts and were calculated after each pyrolysis experiment. Figure 4
 used catalyst powder samples are shown in Figure 2 shows the bio-oil mass yields of different ratio. The gas
 (using 1:1 ratio as an example). Comparing the used yield is calculated by subtracting the mass of bio-oil and
 catalyst in the experiment and unused catalyst shows the coke from the initial mass of cellulose. Each experiment
 catalyst XRD pattern is unchanged by the pyrolysis was conducted more than one time to measure the
 experiments, and the catalyst could be recycled. repeatability.
 Meanwhile, there are not any spurious diffraction peaks The bio-oil yield from uncatalyzed cellulose
 found in the pattern, indicating no other impurity pyrolysis was 39.2% and had a standard deviation of
 component in catalysts and the sol-gel method is reliable 0.8%. The yield increase as the catalyst is added initially

 Table 1. Specific heat capacity (SHC) and heat conductivity coefficient (HCC) for cellulose, Ni metal, Fe metal and cellulose with
 1 1+ 2 2 �
 NiFe catalyst. (SHC , (kJ/kg.K); HCC (W/m. K)) � =
 2
 used to define the mix HCC of cellulose and
 SHC HCC (200°C) HCC (300°C) HCC (400°C)
 (kJ/kg.K) (W/m. K) (W/m. K) (W/m. K)
 Cellulose 1.6 0.23
 Ni 0.4 73.3 64.0 59.3
 Fe 0.4 61.6 54.7 48.9
 Cellulose+Ni2Fe3 (4:1) 13.4
 Cellulose+Ni2Fe3 (2:1) 22.2
 Cellulose+Ni2Fe3 (1:1) 33.3
 Cellulose+Ni2Fe3 (1:2) 44.3
 Cellulose+Ni2Fe3 (1:4) 53.1

 3
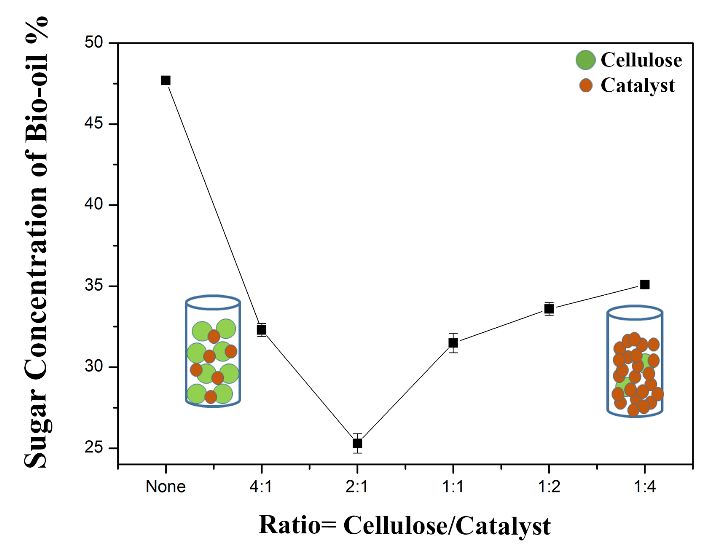
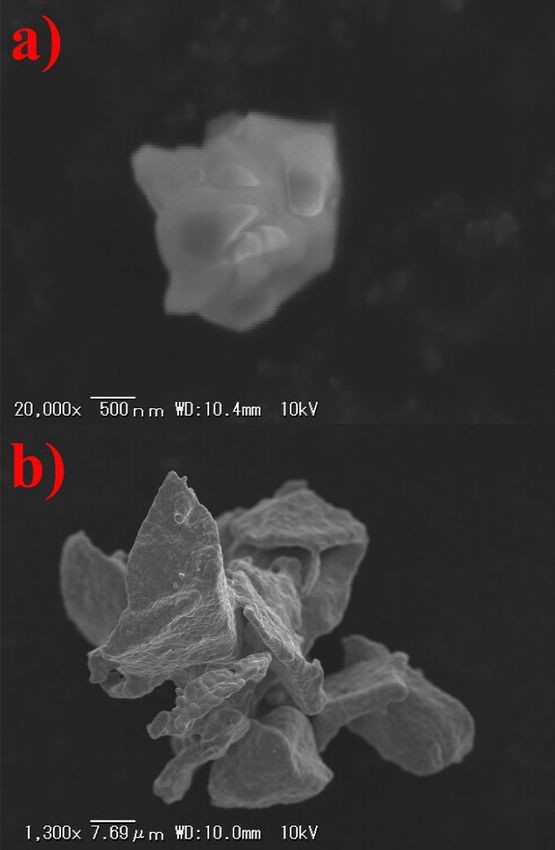
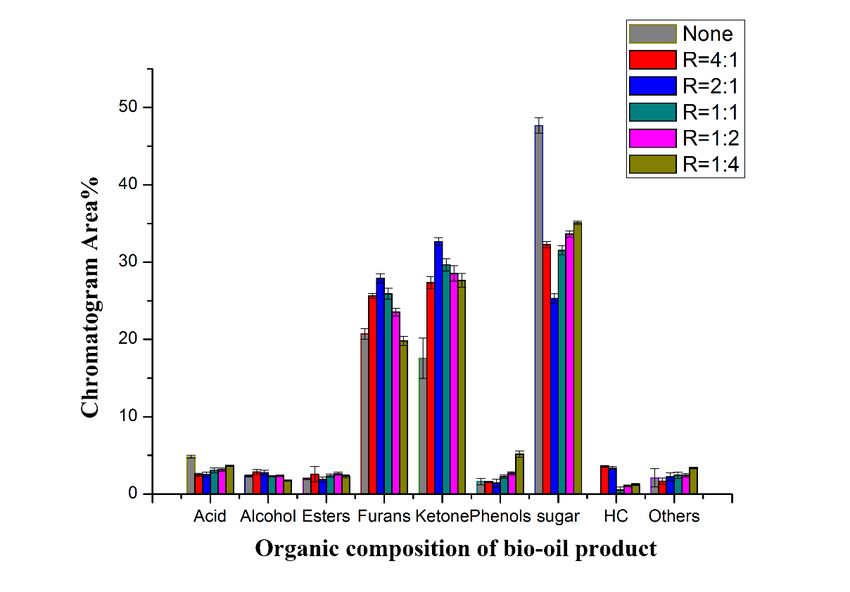
MATEC Web of Conferences 333, 09003 (2021) https://doi.org/10.1051/matecconf/202133309003
APCChE 2019

 and then decrease: 41.9% for cellulose/catalyst ratio is
 4:1; 43.1% for cellulose/catalyst ratio is 2:1; 46.7% for
 cellulose/catalyst ratio is 1:1; 46.9% for
 cellulose/catalyst ratio is 1:2; 39.3% for
 cellulose/catalyst ratio is 1:4. All the ratios used here
 could improve the yield of bio-oil, which is an important
 property, because other catalysts have shown to decrease
 the bio-oil yield, like ZSM-5, ZrO2 andTiO2, and silica
 (Stefanidis et al., 2014; Xia et al., 2015; Behrens et al.,
 2017).
 The reason for bio-oil yield increasing is the
 difference in specific heat capacity and heat conductivity
 coefficient. Specific heat capacity is the amount
 of heat energy required to raise the temperature of a
 substance per unit and the heat conductivity coefficient
 is used to measure the property of transferring heat. The
 specific heat capacity is 1.6 kJ/kg.K for cellulose, 0.44 Figure 6. The proposed relationship (inset) between sugar
 kJ/kg.K for Ni, 0.45 kJ/kg.K for Fe (The Engineering concentration of bio-oil and the
 ToolBox), respectively, which means no matter nickel
 provide sufficient reactive surface (figure inset).
 and iron both can increase its temperature quickly, the
 However, when the catalyst ratio is high, the catalyst has
 heated metal can help transfer heat uniformly for
 little physical contact with the cellulose, which auto-
 cellulose. Besides, heat conductivity coefficient is
 aggregates at high temperatures. A high catalyst ratio
 different (Madelung and White, 1991) (see Table 1), Ni
 will decrease the yield of bio-oil.
 and Fe is nearly 120 times that of cellulose, which means
 What conclusion can be drawn? It appears that the
 for cellulose without a catalyst, heat transfer is poor, so
 R=2:1, 1:1, 1:2 is better when producing bio-oil from
 some points will increase to high temperature in a short
 cellulose.
 time, which tend to produce gas. However, after adding
 Ni2Fe3 catalyst, the heat conductivity coefficient is 3.2.2 GC-MS results of cellulose results
 enhanced many times, which can help transfer heat well
 in order to produce more bio-oil (see Table 1). But if add GC-MS was used for analyzing all bio-oil samples
 too much catalyst, the HCC is really high, like 53.07 produced with the different ratios in order to know the
 W/m. K, the reaction may more like fast pyrolysis, component of the bio-oil. The results of the identified
 which means the major product is gas instead of liquid. peaks are shown in Table 2. On average, 3% of the peaks
 It is also possible some other reactions took place during were unidentified. All compounds were classified into
 the experiment in order to increase the yield, they will be different groups based on their functional group because
 investigated in future work. of Pyrolysis of cellulose can produce hundreds of
 From Figure 5, it is shown that the yield of bio-oil compounds. These groups were classified as acids,
 changes when the ratio is changing. R=1:2 shows the aldehydes, alcohols, furans, esters, hydrocarbons (HC),
 best bio-oil yield. The reason why the yield reduction is ketones, phenols, sugars, and others. Table 2 shows the
 impacted is that when the cellulose ratio is low, the major products of uncatalyzed cellulose were acids
 metal catalyst can help transfer heat uniformly and (4.9%), furans (20.7%), ketone (17.5%), and sugars
 (47.7%). In this study, phenolic compounds were also
 found in uncatalyzed cellulose pyrolysis, same as other
 researcher results (Behrens et al., 2017); Other main
 components of the bio-oils derived from noncatalytic
 and catalytic pyrolysis of cellulose are in good
 agreement with the literature results (Fabbri et al., 2007;
 Lu et al., 2011; Xia et al., 2015)
 In order to examine how the ratio between cellulose
 and catalyst influence the composition of the bio-oil,
 each functional group will be discussed herewith.
 Moreover, the data shows the relationship between the
 cellulose/catalyst ratio and the bio-oil composition in
 Figure 6 (Based on averaged data).
 First, in Table 2, the data indicate that HC was
 formed, which is an excellent component to improve the
 quality of bio-oil, although the percentage is small. No
 other similar published reports indicate producing HC
 Figure 5. The proposed relationship (inset reactant ratio) from cellulose reactants under a nitrogen ambient
 between bio-oil yield and the cellulose/catalyst environment to our knowledge.

 4
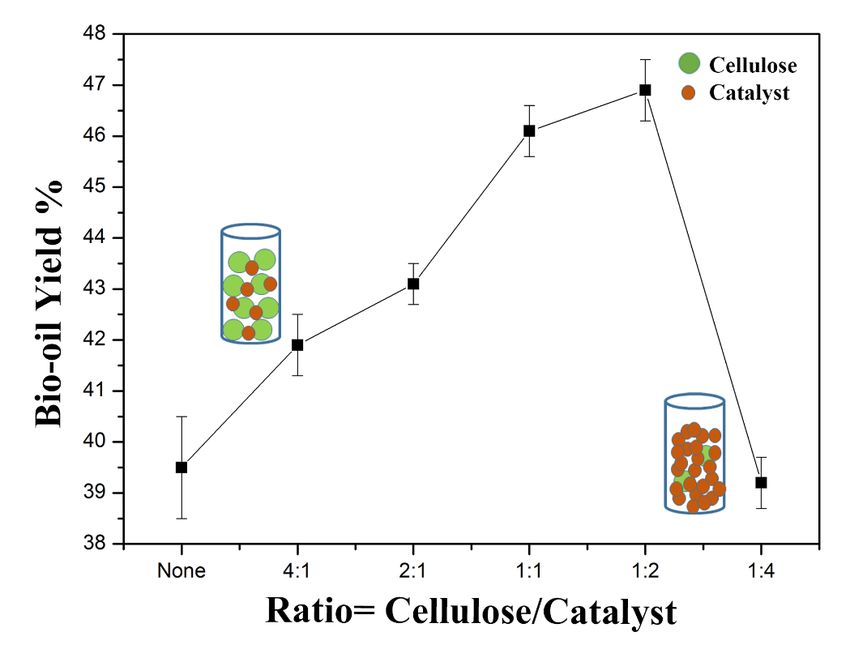
MATEC Web of Conferences 333, 09003 (2021) https://doi.org/10.1051/matecconf/202133309003
APCChE 2019

 Table 2. Composition of cellulose pyrolysis products with different cellulose/catalyst ratio (peak area% of identified peaks, HC
 is hydrocarbon compounds, unidentifiable compounds were put in others. R=Cellulose/Catalyst)

 Sample Acid% Alcohol% Esters% Furans% Ketone% Phenols% Sugar% HC% Others%

 None 4.9±0.2 2.3±0.1 2.0±0.1 20.7±0.7 17.5±2.6 1.7±0.4 47.7±0.2 0 2.1±1.2
 R=4:1 2.5±0.2 2.9±0.3 2.6±1.0 25.6±0.3 27.4±0.8 1.5±0.1 32.3±0.4 3.6±0.1 1.7±0.4
 R=2:1 2.5±0.3 2.8±0.3 1.9±0.3 26.9±0.6 30.7±0.5 1.4±0.5 28.3±0.6 3.3±0.2 2.2±0.5
 R=1:1 3.1±0.3 2.3±0.1 2.4±0.2 26.0±.0.7 29.7±0.8 2.2±0.2 31.5±0.6 0.5±0.4 2.4±0.4
 R=1:2 3.1±0.2 2.3±0.1 2.6±0.2 23.6±0.5 28.5±1.0 2.7±0.2 33.6±0.4 1.1±0.1 2.4±0.2
 R=1:4 3.6±0.1 1.8±0.1 2.3±0.2 19.1±0.6 27.6±0.9 5.2±1.4 35.1±0.2 1.2±0.1 3.7±0.1

 Figure 7. Chemical relative compositions of the bio-oil organic phases with different cellulose/catalyst ratios.

 Secondly, all catalysts reduced acid and sugar, Third, when the sugar decreases, the furan, and
 which is good for improving the quality of bio-oil. The ketone increase as shown in Figure 7. Cellulose/catalyst
 reason why reducing acid can improve the quality of bio- ratio of 2:1 shows the best property for increasing ketone
 oil is that the acid can reduce the bio-oil pH value, and and furan compounds because it removes the most mass
 make it corrosive to common metals such as aluminum, of sugar. Ketone compounds can change to other
 mild steel, brass and so on. Reducing sugar is important hydrocarbon compounds through various methods in
 because of its large oxygen content. These results agree order to improve the quality of bio-oil as the chemical
 well with other literature that the sugar content can be reaction advances (King et al., 2015; Mehta et al., 2015;
 reduced by reactions with catalysts (Wang et al., 2016; Ly et al., 2017). So it is important to increase the ketone
 Behrens et al., 2017). Figure 7 shows how the different amount for bio-oil.
 cellulose/catalyst ratios influence sugar production. The Finally, all ratios do not affect the alcohol, phenol,
 sugar reduction increasing as the catalyst is added and ester amounts. The phenol compounds are usually
 initially and then decreases. The reason is that more formed through the secondary reactions from cellulose
 catalysts can help cellulose decompose well and provide vapors (Stefanidis et al., 2014; Wang et al., 2016), that is
 enough surface for reaction, but too much catalyst will why it does not change a lot in this study.
 auto-aggregate at high temperatures, reducing the
 reactive surface. So a high catalyst ratio not only
 decreases the yield of bio-oil but influences the overall
 catalyst activity based on Figure 7. The ratio = 4:1, 2:1,
 1:1 is better for reducing sugar concentration.

 5
MATEC Web of Conferences 333, 09003 (2021) https://doi.org/10.1051/matecconf/202133309003
APCChE 2019

 4. Conclusion Saccharina Japonica Bio-oil Using Iron Phosphide
 Catalyst, Chem. Eng. J., 317, 302–308 (2017)
 The Ni2Fe3 cluster catalysts were prepared by the sol–gel
 Madelung, O. and G. White; Thermal Conductivity of
 method successfully and can be recycled. The results Pure Metals and Alloys, Springer, Berlin, Germany
 show that the cellulose/catalyst ratio will influence the (1991)
 yield and composition of the pyrolyzed bio-oil. The bio-
 oil yield increases as the catalyst is added initially and Mehta, M., M. H. Holthausen, I. Mallov, M. Perez, Z. W.
 then decreases, the R=2:1, 1:1, 1:2 is better for Qu, S. Grimme and D. W. Stephan. "Catalytic Ketone
 Hydrodeoxygenation Mediated by Highly Electrophilic
 producing bio-oil with high yield. The sugar reduction Phosphonium Cations." Angew. Chem. Int. Ed., 54,
 increases initially and then decreases, in the same 8250–8254 (2015)
 manner as the yield. Moreover, R= 4:1, 2:1, 1:1 is better
 for reducing sugar concentration. Based on the above Muis, Z. A., H. Hashim, Z. A. Manan, F. M. Taha and P.
 results, the best cellulose/catalyst ratio is 2:1 or 1:1. This L. Douglas; "Optimal Planning of Renewable Energy-
 Integrated Electricity Generation Schemes with CO2
 Ni2Fe3 cluster catalysts also shows a different reaction Reduction Target," Renewable Energy, 35, 2562–2570
 pathway when compared to other supported catalysts in (2010)
 the literature, directly catalyze biomass or catalyze the
 vapors, respectively. In the future, this ratio will be used Nie, L., P. M. de Souza, F. B. Noronha, W. An, T.
 with other metal cluster catalyst system. Sooknoi and D. E. Resasco; "Selective Conversion of m-
 Cresol to Toluene over Bimetallic Ni–Fe Catalysts," J.
 Mol. Catal. A: Chem., 388–389, 47–55 (2014)
 Reference
 Oguri, T., K. Shimamura, Y. Shibuta, F. Shimojo and S.
 Behrens, M., J. S. Cross, H. Akasaka and N. Ohtake; "A Yamaguchi; "Ab Initio Molecular Dynamics Simulation
 Study of Guaiacol, Cellulose, and Hinoki Wood of the Dissociation of Ethanol on a Nickel Cluster:
 Pyrolysis with Silica, ZrO2&TiO2 and ZSM-5 Catalysts," Understanding the Initial Stage of Metal-Catalyzed
 J. Anal. Appl. Pyrol., 125, 178–184 (2017) Growth of Carbon Nanotubes." J. Phys. Chem. C, 117,
 9983–9990 (2013)
 Charfeddine, L. and M. Kahia; "Impact of Renewable Lu, Q., Z. Wang, C.-Q. Dong, Z.-F. Zhang, Y. Zhang,
 Energy Consumption and Financial Development on Y.-P. Yang, and X.-F. Zhu; "Selective Fast Pyrolysis of
 CO2 Emissions and Economic Growth in the MENA Biomass Impregnated with ZnCl2: Furfural Production
 Region: A Panel Vector Autoregressive (PVAR) Together with Acetic Acid and Activated Carbon as By-
 Analysis," Renewable Energy, 139, 198–213 (2019) Products," J. Anal. Appl. Pyrolysis, 91, 273–279 (2011)
 Fabbri, D., C. Torri, and V. Baravelli; "Effect of Zeolites Shafiei, S. and R. A. Salim; "Non-renewable and
 and Nanopowder Metal Oxides on the Distribution of Renewable Energy Consumption and CO2 Emissions in
 Chiral Anhydrosugars Evolved from Pyrolysis of OECD Countries: A Comparative Analysis," Energy
 Cellulose: An Analytical Study," J. Anal. Appl. Policy, 66, 547–556 (2014)
 Pyrol., 80, 24–29 (2007)

 Duan, P. and P. E. Savage; "Upgrading of Crude Algal Stefanidis, S. D., K. G. Kalogiannis, E. F. Iliopoulou, C.
 Bio-Oil in Supercritical Water." Bioresour. Technol., M. Michailof, P. A. Pilavachi and A. A. Lappas; "A
 102, 1899–906 (2011) Study of Lignocellulosic Biomass Pyrolysis via the
 Pyrolysis of Cellulose, Hemicellulose and Lignin," J.
 Anal. Appl. Pyrol., 105, 143–150 (2014)
 De, G., L. Tapfer, M. Catalano, G. Battaglin, F.
 Caccavale, F. Gonella, P. Mazzoldi, and R. F. Haglund The Engineering ToolBox; "The Specific Heat of Metals
 Jr.; "Formation of Copper and Silver Nanometer and Metalloids (semimetals),"
 Dimension Clusters in Silica by the Sol–Gel Process," https://www.engineeringtoolbox.com/heat-capacity-
 Appl. Phys. Lett., 68, 3820 (1996) d_338.html
 Jayaprakash, J., N. Srinivasan, P. Chandrasekaran, and E. Wang, Z., R. Ma, W. Lin and W. Song; "Pyrolysis of
 K. Girija; "Synthesis and Characterization of Cluster of Cellulose under Catalysis of SAPO-34, ZSM-5, and Y
 Grapes Like Pure and Zinc-doped CuO Nanoparticles by Zeolite via the Py-GC/MS Method," Int. J. Green
 Sol–Gel Method," Spectrochim. Acta, Part A, 136, Energy, 13, 853–858 (2016)
 1803–1806 (2015)

 King, A. E., T. J. Brooks, Y.-H. Tian, E. R. Batista, and Xia, H., X. Yan, S. Xu, L. Yang, Y. Ge, J. Wang and S.
 A. D. Sutton; "Understanding Ketone Zuo; "Effect of Zn/ZSM-5 and FePO4Catalysts on
 Hydrodeoxygenation for the Production of Fuels and Cellulose Pyrolysis," Journal of Chemistry, 2015,
 Feedstocks From Biomass," ACS Catal., 5, 1223–1226 749875 (2015)
 (2015)
 Xin, X., S. Pang, F. de Miguel Mercader and K. M. Torr;
 Krajačić, G., N. Duić, Z. Zmijarević, B. V. Mathiesen, A. "The Effect of Biomass Pretreatment on Catalytic
 A. Vučinić, and M. da Graça Carvalho; "Planning for a Pyrolysis Products of Pine Wood by Py-GC/MS and
 100% independent Energy System Based on Smart Principal Component Analysis," J. Anal. Appl. Pyrol.,
 Energy Storage for Integration of Renewables and CO2 138, 145–153 (2019)
 Emissions Reduction," Appl. Therm. Eng., 31, 2073–
 2083 (2011) Zheng, J.-L. and Q. Wei; "Improving the Quality of Fast
 Pyrolysis Bio-oil by Reduced Pressure Distillation,"
 Ly, H. V., E. Galiwango, S.-S. Kim, J. Kim, J. H. Choi, Biomass Bioenergy, 35, 1804–1810 (2011)
 H. C. Woo and M. R. Othman; "Hydrodeoxygenation of
 2-furyl Methyl Ketone as a Model Compound of Algal

 6
You can also read