Supplementary results - The Royal Society of Chemistry
←
→
Page content transcription
If your browser does not render page correctly, please read the page content below
Electronic Supplementary Material (ESI) for Nanoscale.
This journal is © The Royal Society of Chemistry 2021

 Supplementary results
 Stiffening of DU145 Prostate Cancer Cells Driven by Actin Filaments –
 Microtubules Crosstalk Conferring Resistance to Microtubule-Targeting Drugs

 Authors:
 Andrzej Kubiak,a Matteo Chighizola,b Carsten Schulte,b Natalia Bryniarska,c Julita Wesołowska,d
 Maciej Pudełek,e Małgorzata Lasota,f Damian Ryszawy,e Agnieszka Basta-Kaim,c Piotr Laidler,f
 Alessandro Podestà,b* and Malgorzata Lekkaa*

 Affiliations:
 aDepartment of Biophysical Microstructures, Institute of Nuclear Physics, Polish Academy of
 Sciences, PL-31342 Kraków, Poland.
 b C.I.Ma.I.Na. and Dipartimento di Fisica “Aldo Pontremoli”, Università degli Studi di Milano,
 via Celoria 16, 20133 Milano, Italy.
 c Laboratory of Immunoendocrinology, Department of Experimental Neuroendocrinology, Maj
 Institute of Pharmacology, Polish Academy of Sciences, 12 Smętna St. 31-343 Kraków, Poland.
 dLaboratory of in vivo and in vitro imaging, Department of Experimental Neuroendocrinology,
 Maj Institute of Pharmacology, Polish Academy of Sciences, 12 Smętna St. 31-343 Kraków,
 Poland.
 e Department of Cell Biology, Faculty of Biochemistry, Biophysics, and Biotechnology,
 Jagiellonian University, Kraków, Poland.
 fChair of Medical Biochemistry Jagiellonian University Medical College, Kopernika 7, 31-034
 Kraków, Poland.

 Correspondence should be addressed to M.L. (Malgorzata.lekka@ifj.edu.pl) and AP
 (alessandro.podesta@mi.infn.it).
Content of the supplementary information: Supplementary Note 1: Proliferation rate of DU145 cells treated with MTDs Supplementary Note 2: Morphology of DU145 cell nucleus is affected by MTDs (Supplementary Figure S1; Supplementary Figure S3) Supplementary Note 3: Migratory properties of DU145 cells (Supplementary Figure S3) Supplementary Note 4: Time-dependent changes in mechanical properties of DU145 cells (Supplementary Table S1; Supplementary Figure S4) Supplementary Note 5: Mapping the mechanical properties of cells Supplementary Note 6. Finite-thickness correction (Supplementary Figure S5) Supplementary Note 7. Cross-sectional images of cytoskeleton around cell nucleus (Supplementary Figure S6) Supplementary Note 8. Affecting the organization of actin filaments (Supplementary Figure S7, Supplementary Figure S8, Supplementary Figure 9)
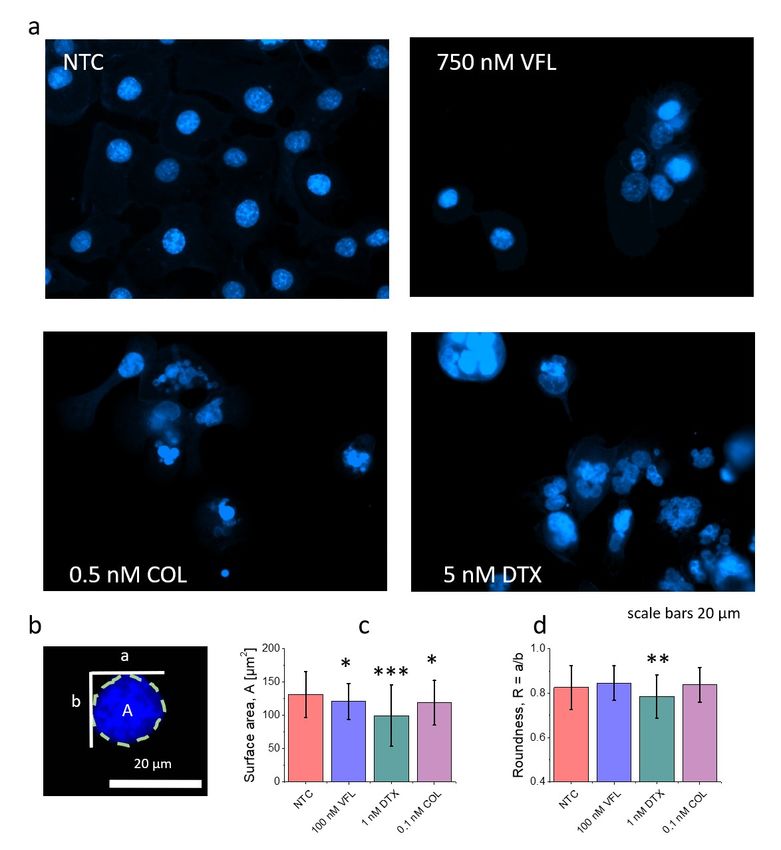
Supplementary Note 1: Proliferation rate of DU145 cells treated with MTDs
 To estimate how fast the number of cells increases, a linear regression was applied to
quantify roughly the proliferation rate (Fig. 1). Although for NTC cells, an exponential-like growth
can be observed, the linear fit was chosen to avoid an exponential fit to three points. As expected,
NTC cells had the highest proliferation rate, which was 4300 ± 1100 cells per hour (Pearson's'
coefficient = 0.939). For low doses of drugs, i.e., 100 nM VFL, 1 nM DTX, and 0.1 nM COL,
obtained rates were 3000 ± 270 cells per hours (Pearson's' coefficient = 0.992), 2270 ± 220 cells
per hour (Pearson's coefficient = 0.991) and 3340 ± 740 cells per hour (Pearson's'
coefficient 0.954), respectively.

Supplementary Note 2: Morphology of DU145 cell nucleus is affected by MTDs
 To investigate nuclear morphology fluorescence, microscopic images were analyzed in
ImageJ with package Fiji and Cookbook with Particle Analysis. At least 5 images for each group
for the following drugs concentrations: 100 nM and 750 nM for VFL, 1 nM and 5 nM for DTX,
0.1 nM and 0.5 nM for COL and control without addition of drug.
Although observed changes in microtubule organization correspond roughly with the results of
cell viability, we wanted to verify the morphology of the cell nucleus (Suppl. Fig. S1). At large
drug doses, regardless of the drug applied, cell nuclei were heavily irregular and defragmented, as
one can see in the Hoechst stained fluorescent images (Suppl. Fig. S1a). To evaluate nuclear
changes occurring at low doses, such as morphometric parameters as nuclear surface area and
roundness were estimated (Suppl. Fig. S1c&d). Obtained fluorescent images showed large
variations in the nucleus shape when low concentrations of MTDs are applied. In particular, for
DTX treated cells, the circularity and roundness show the lowest values. For cells treated with
COL and VFL, cell nuclei seem to be less affected by the MTDs action.
Suppl. Figure S1. Morphology of the cell nucleus is strongly affected by microtubule-targeted
drugs. a, High concentrations of VFL, DTX, and CL induce fragmentation of cell nuclei, especially
for DTX and COL. In low drug concentration, nucleus morphology is preserved
(b), however, DTX seems to have a stronger effect on the nucleus, as shown in morphometric
analysis of surface area (c) and roundness (d) for untreated and treated prostate DU145 cells.
Data are presented as a mean ± standard deviation calculated from n = 79-105 cells per condition.
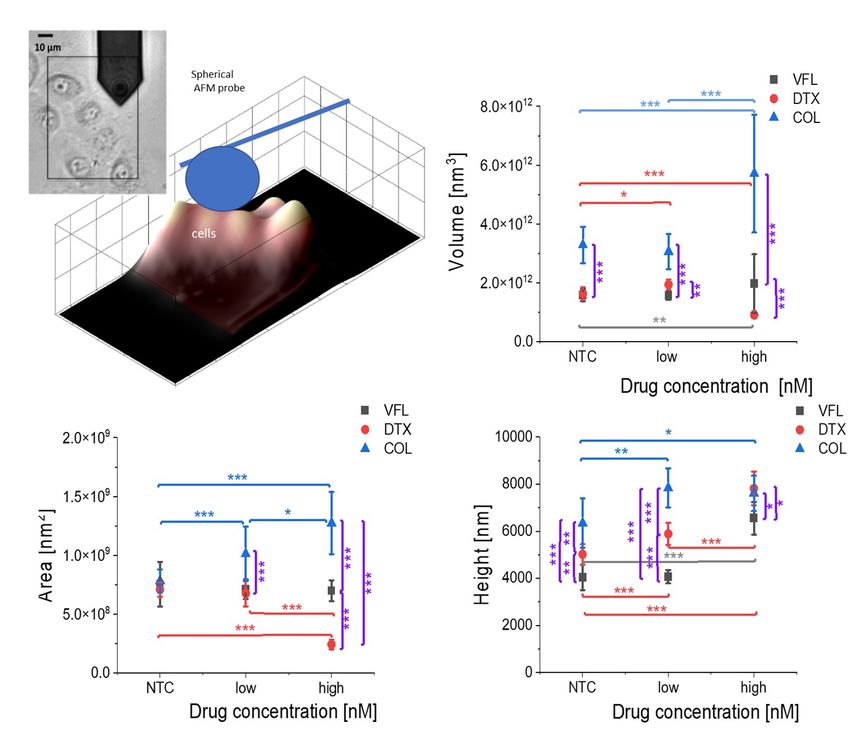
Statistical significance was estimated by unpaired t-Student test at the level of 0.05 (* p < 0.05,
** p < 0.01, *** p < 0.001).

To evaluate whether it is possible to observe nuclear changes in the AFM measurements, such
morphometric parameters as cell volume, surface, area and height were calculated based on the
recorded images of DU145 cell clusters (Suppl. Fig.2).

Suppl. Figure S2. Cells change their morphology in response to MTDs. AFM-based
morphometric parameters of DU145 clusters showing alterations in clusters volume, surface area,
and height induced by MTDs. Data are presented as a mean ± σE; n = 8-12 per condition.
Statistical significance was estimated by unpaired t-Student test at the level of 0.05 (* p < 0.05,
** p < 0.01, *** p < 0.001).
The obtained results show significant and opposing alterations of the cell volume and surface area
for DTX (decrease) and COL (increase), especially for the high doses. Such observation, observed
only in COL-treated cells, leads us to the conclusion that the swelling of cells treated with a high
concentration of drugs is characteristic of microtubule-disrupting agents. The height of the
analyzed cell clusters shows an increasing trend for all MTDs, although significant observations
were unique for high drug concentrations. Interestingly, in the low-dose (100 nM) VFL case, for
which pronounced deformability changes were recorded, volume, surface area, and height of cells
remained at the same level as the NTC cells. Thus, indicating cytoskeleton contribution in
mechanical features changes of 100 nM, VFL treated cells, rather than changes in their dimensions.

Supplementary Note 3: Migratory properties of DU145 cells
DU145 cells were incubated with the corresponding MTD drug. Their motility was estimated
immediately after drug administration. The cancer cells' movement was recorded using a time-
lapse Leica DMI6000B videomicroscopy system equipped with a temperature chamber (37°C, 5%
CO2), interference modulation contrast (IMC) optics, and a cooled, digital DFC360FX CCD
camera.1 Cell trajectories were recorded and used to calculate the cell displacement and speed
(Suppl. Fig. 3).
.Suppl. Figure S3. Migratory properties of DU145 cells upon MTDs treatment. An average value
of the (a) migration speed and (b) displacement was determined for cells treated with VFL, DTX,
and COL. Data are presented as a mean ± standard deviation; n = 30 cells per condition.
Statistical significance was estimated by unpaired t-Student test at the level of 0.05 (* p < 0.05,
** p < 0.01, *** p < 0.001).

Supplementary Note 4: Time-dependent changes in mechanical properties of DU145 cells
To measure the mechanical properties of DU145 cells, cells were seeded on glass coverslips (Ø =
25 mm) immersed in a Petri dish with internal Ø = 34 mm (TPP) at the density of 50 000/ml.
Measurements were carried out using atomic force microscopes: model Xe120 (Park Systems) and
working in a force spectroscopy mode. A rectangular cantilever ORC8 (Bruker) with a nominal
spring constant of 0.05 N/m, the opening angle of 36 ± 2⁰, and a radius of 15 nm were used.
Cantilever spring constants were calibrated by the use of the thermal noise method2. For
measurements, coverslips with cells were mounted in a transparent liquid cell and kept at room
temperature in the standard culture medium. Room temperature was not significantly harmful for
Du145 during experiments, which lasted up to 2 hours3. Keeping a temperature below 37°C
reduces the cell motility, which was beneficial for the elasticity measurements. 25 force curves
were acquired within an elasticity map of 5 × 5 points with a pixel size of 1 µm2, load force ~10
nN, and tip velocity of 8 µm/s. Each experiment was conducted in triplicate.
 The relative Young's modulus variations, calculated as ΔErel = (Edrug-ENTC)/ENTC, are
reported in Suppl. Table S1 and Suppl. Fig. S4. In our analysis, the maximum indentation was
500 nm. The final Young's modulus was calculated as the mean ± standard error (s.e.) from n =
80-96 cells measured for each group separately (Suppl. Table S1).
Suppl. Table S1. Young's modulus obtained for MTDs treated DU145 cells (s.e. – standard error,
n – number of cells measured; p-value was calculated using two tails unpaired Student t-test). The
relative Young's modulus variations are reported in both, Fig. 4 and Suppl. Fig. S4.

 time 24h 48h 72h
 MTDs E ± s.e. (n) [kPa] E ± s.e. (n) [kPa] E ± s.e. (n) [kPa]
 treatment
 Vinflunine (VFL)
 NTC 3.1 ± 0.2 (94) 2.2 ± 0.1 (93) 1.5 ± 0.1 (96)
 100 nM VFL 3.1 ± 0.3 (94) 2.3 ± 0.2 (60) 1.9 ± 0.1 (93)
 p = 0.9512 p = 0.632 p = 0.0016
 750 nM VFL 3.0 ± 0.2 (76) 2.7 ± 0.2 (88) 2.5 ± 0.2 (91)
 p = 0.7147 p = 0.0412 p = 0.0001
 Docetaxel (DTX)
 NTC 4.2 ± 0.3 (88) 2.9 ± 0.2 (88) 2.6 ± 0.1 (89)
 1 nM DTX 4.7 ± 0.4 (86) 4.8 ± 0.4 (83) 2.8 ± 0.2 (89)
 p = 0.3610 p = 0.0001 p = 2977
 5 nM DTX 4.4 ± 0.4 (83) 3.4 ± 0.3 (86) 2.8 ± 0.1 (87)
 p = 0.7280 p = 0.1085 p = 0.2971
 Colchicine (COL)
 NTC 3.3 ± 0.17 (90) 3.0 ± 0.15 (91) 2.2 ± 0.1 (90)
 0.1 nM COL 4.4 ± 0.3 (88) 2.9 ± 0.2 (86) 2.3 ± 0.1 (87)
 p = 0.0012 p = 0.7853 p = 0.4623
 0.5 nM COL 3.3 ± 0.2 (87) 2.0 ± 0.1 (88) 2.0 ± 0.2 (88)
 p = 0.9140 p = 0.0001 p = 0.2520
Suppl. Figure S4. Relative change ΔErel of the Young's modulus measured at the same time-point
for low (a-c) and high (d-f) MTDs doses. (g-i) Time-dependent ΔErel changes showing cell
stiffening or softening dependently of the MT drug, concentration, and time applied. Error bars
were calculated using the error propagation method. Statistical significance was estimated by
unpaired t-Student test at the level of 0.05 (* p < 0.05; ** p < 0.01).

Supplementary Note 5: Mapping the mechanical properties of cells: combined topographical
and mechanical mapping
 For acquiring maps of mechanical properties, DU145 cells were plated in the standard
experimental conditions on Ø = 40 mm glass-bottom dishes for cell culture (Willco Wells,
Amsterdam, Netherlands). Cells were maintained in DMEM without phenol red but supplemented
with 10% heat-inactivated FBS and 5 nM L-glutamate. Glass coverslips with cells were mounted
in transparent liquid cell and kept at room temperature in standard culture medium.
 Combined topographical and mechanical imaging was performed using a Bioscope
Catalyst AFM (Bruker). During the AFM measurements, the temperature of the medium was
maintained at 30°C using a perfusion stage incubator and a temperature controller (Lakeshore
3301, Ohio, USA). The choice of the temperature below 37°C was made to decrease the cellular
metabolism, which slows down also the cell motility, making it possible to acquire large maps
without disturbance due to strong movements of the cells during the measurements (acquisition of
one map takes 30-40 min).
 We used custom monolithic borosilicate glass probes consisting of spherical glass beads
with radii R in the range 4500–5500 nm, attached to ultra-soft silicon, tipless cantilevers
(Micromash HQ:CSC38/tipless/no Al) with elastic constant k = 0.02– 0.03 N/m, measured using
the thermal noise calibration4. Probes were fabricated and calibrated, in terms of tip radius,
according to an established custom protocol5.
 The topographical/mechanical maps were obtained, as described elsewhere6, from sets of
force curves, collected in Point and Shoot (P&S) mode, selecting the regions of interest from
optical images, exploiting the accurate alignment of the optical and AFM images obtained using
the Miro software module integrated in the AFM software. Each set of force curves consisted of
an N × M array of curves spatially separated by approximately 1.5 µm, each force curve containing
4096 points, with ramp length L = 6 μm, maximum load Fmax = 10 nN, ramp frequency f = 1 Hz.
Typical maximum indentation was 2-3 μm, larger than in the case of sharp pyramidal probes (max.
indentation 500 nm).
Suppl. Table S2. Young's modulus obtained for MTDs treated DU145 cells showing the mean value
of the median E extracted per each cluster; error represents the final error σE that take into
account the three main errors: the instrumental error σinst, the error associated to one single
cluster median value σmed and the deviation of the all clusters σmean, n – number of cell clusters
measured; p-value was calculated using the two-tails unpair Student t-test.
 VFL DTX COL
 whole-cell E ± σE [Pa] E ± σE [Pa] E ± σE [Pa]
 NTC 375.1 ± 23.2 (8) 429.0 ± 35.9 (11) 376.6 ± 37.6 (9)
 low 444.61 ± 24.4 (8) 407.9 ± 34.3 (12) 360.6 ± 79.6 (8)
 p = 0.0058 p = 0.6759 p = 0.8528
 high 447.1 ± 29.8 (7) 336.6 ± 25.5 (12) 436.8 ± 132.1 (7)
 p = 0.0755 p = 0.0456 p = 0.6321
 nuclear region (5-15%)
 NTC 346.6 ± 19.8 (8) 410.8 ± 32.7 (11) 422.9 ± 43.6 (9)
 low 466.5 ± 36.9 (8) 388.3 ± 41.0 (12) 470.5 ± 99.2 (8)
 p = 0.0125 p = 0.6760 p = 0.6536
 high 539.0 ± 44.9 (7) 394.4 ± 33.6 (12) 628.4 ± 167.9 (7)
 p = 0.0012 p = 0.7296 p = 0.2054
 nuclear region (20-40%)
 NTC 381.9 ± 13.2 (8) 378.7 ± 24.3 (11) 429.0 ± 38.2 (9)
 low 488.9 ± 22.7 (8) 341.8 ± 25.5 (12) 486.1 ± 60.6 (8)
 p = 0.011 p = 0.3093 p = 0.4271
 high 537.6 ± 44.8 (7) 340.0 ± 16.5 (12) 642 ± 107 (7)
 p = 0.0037 p = 0.1957 p = 0.0584
 cell periphery
 NTC 397.3 ± 29.9 (8) 401.4 ± 27.6 (11) 376.8 ± 35.9 (9)
 low 437.5 ± 24.2 (8) 403.4 ± 23.1 (12) 388.5 ± 79.3 (8)
 p = 0.3139 p = 0.9544 p = 0.8905
 high 398.3 ± 41.7 (7) 321.1 ± 24.8 (12) 536 ± 152 (7)
 p = 0.9841 p = 0.0416 p = 0.2702
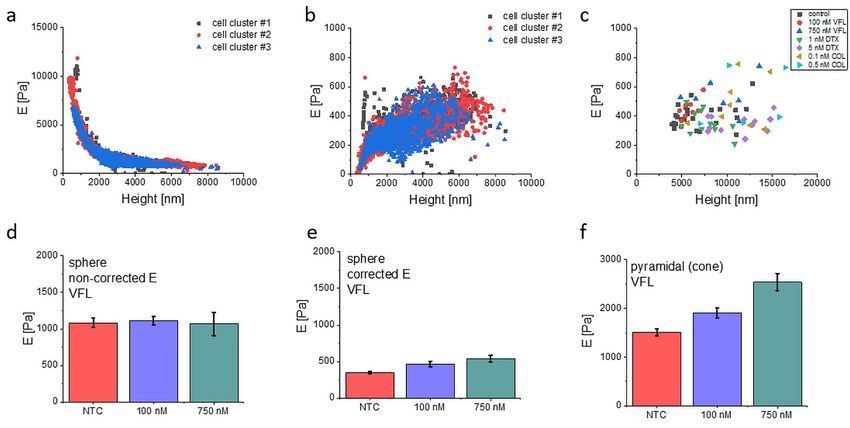
Supplementary Note 6. Finite-thickness correction
 To overcome issues linked to the influence of the underlying stiff support on the
mechanical properties of cells, finite thickness correction was applied to the obtained data shown
in Fig. 6 and in Suppl. Fig. S5.

The finite-thickness correction is needed when the requirement that the sample thickness is much
larger than the maximum indentation (h>>δ) is not satisfied. When indenting very compliant cells,
with maximum indentation δ well beyond 1 μm, the finite-thickness effect must be accounted for.
In this condition, the influence of the rigid substrate (the bottom of the glass dish from Wilco
Weels®) makes the elastic cell response stiffer, i.e., the measured Young's modulus is larger. This
effect increases when the sample becomes even thinner, like in the peripheral regions of the cell
body. As a rule of thumb, the condition 10-15 δ < h should be satisfied to neglect finite-thickness
effects, although the incidence of finite thickness also depends on the indenter's radius (see below).
It turns out that this effect is actually stronger for large colloidal probes, while it is usually
negligible for sharp AFM tips.

 We implemented the analytic correction developed by Dimitriadis et al.7 for spherical
probes, as described by Puricelli et al.6. Since cells adhere to the substrates using highly dynamical
focal adhesion complexes, following the advice of Gavara and Chadwick8, we used a correction
factor to the Hertz equation, which represents an average between the two conditions of perfectly
adherent and non-adherent cells:

 1 3
 9
 = 2 2[1 + 1.009 + 1.032 2 + 0.578 3 + 0.051 4]
 16

This is the effective equation for the correction of the finite-thickness effect.
Defining Δ( ) ≡ ∆( ( , ,ℎ)), with

 Δ = 1 + 1.009 + 1.032 2 + 0.578 3 + 0.051 4,

the finite-thickness corrected Hertz Model can be written as:
1 3
 9
 = 2 2
Δ( ) 16

 =
The variable ℎ combines the three critical lengths of the system, the radius of the probe R,
the indentation and the height of the sample h. Considering that for the Hertz model, the contact

 =
area between the probe and the sample is = , we have ℎ, meaning that the finite-
thickness effect does not depend directly on the ratio of the vertical lengths and h, but rather on
the ratio of the horizontal dimension of the contact area, i.e. the contact radius a, to the sample
height h. As a consequence, for a given indentation δ, the finite-thickness effects will be
significantly stronger for the colloidal probes, compared to the sharp ones.

 An example of the effects of the finite-thickness correction is shown in Suppl. Fig. S5.
The value of the Young's modulus extracted from each force curve is plotted as a function of the
local cell height for three different representative clusters of cells (control conditions), measured
in a single day. Data are shown without (Suppl. Fig. S5a), or with (Suppl. Fig. S5b), the finite-
thickness correction.

Suppl. Figure S5. Finite thickness correction for colloidal probes based on Dimitriadis et al. Data
are presented as Young's modulus extracted from single force curves, coming from three clusters
of cells of the control condition, using (a) standard Hertz model and (b) the finite -thickness
corrected Hertz model. (c) Young's modulus median value of single-cell clusters (Emd, see
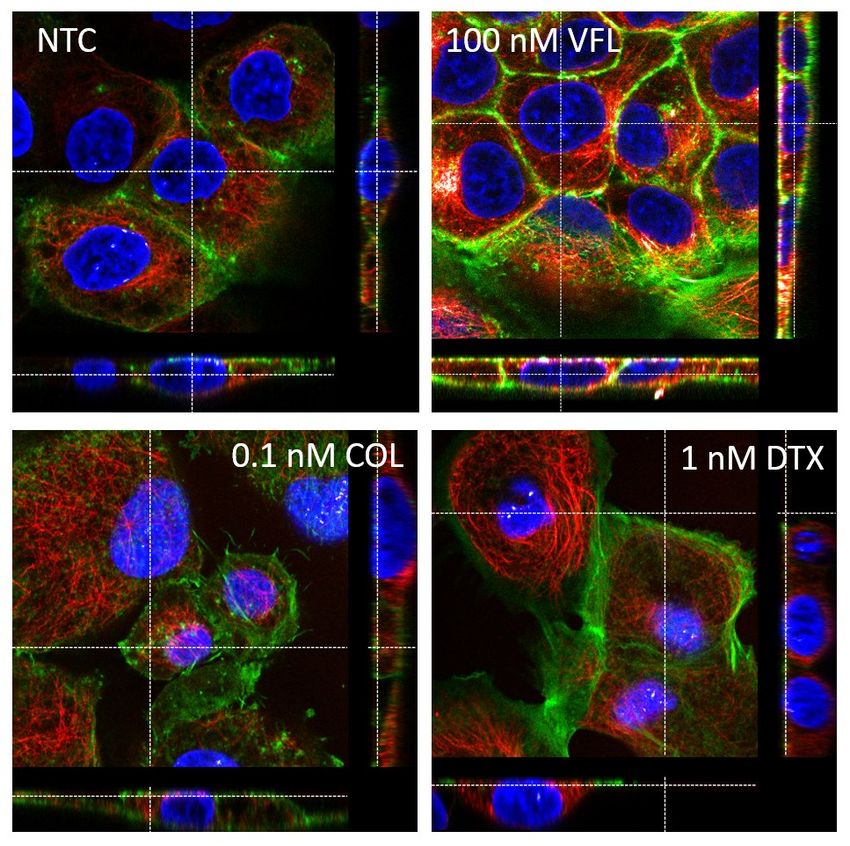
Materials and Methods). (d-e) median Young's modulus ± σE; n = 3 clusters per condition. (f)
mean Young's modulus ± standard error; n = 76-94 cells per condition.

To verify that the results of the mechanical analysis are not affected by the change in the height of
the cells inside the clusters (for example, the thickening of cells could determine a loss of
sensitivity to the inner region of the cells, for the same maximum indentation, or to a redistribution
of organelles in the cytoplasmic region), we plotted the median of Young's modulus from the inner
cells body (nuclear region, deep indentation) of each cluster versus the mean cluster height (Suppl.
Fig. S5c). There is no evidence of any correlation between the height of the cluster or the cell and
Young's modulus, which led us to exclude that our analysis is significantly biased by the
morphological changes of the cells. It is clear from the comparison of Suppl. Fig. S5a and S5b
that the measured Young's modulus increases as the cell height decreases, leading to severe
overestimation of the intrinsic (effective) value of a cell modulus. In our experimental conditions,
only with cell heights of approximately 20-30 μm would make the finite-thickness effect
negligible.

 The effect of the rigid substrate underneath the cells is to hide the fine mechanical
modifications that take place inside the cells body upon the action of the drug, resulting in a loss
of sensitivity. Since we have shown that the morphological properties, particularly the height of
the cells, change upon the treatment with the drugs, the application of the finite-thickness
correction and with pyramidal probes is important to compare results obtained at different drug
concentrations. This is shown in Suppl. Fig. S5d-f, where the results obtained with VFL with and
without the finite-thickness correction are shown. Without the correction, apart from a rigid shift
to higher Young's modulus, the differences between the three conditions are lost; with the
application of the correction, instead, the differences are evident, and the same trend is observed
as with the pyramidal probes.

Supplementary Note 7. Cross-sectional images of cytoskeleton around the cell nucleus.
To examine the localization of MT and actin filaments around the cell nucleus of MTD-treated
DU145 cells, confocal images of a slice recorded at the height of 3.6 µm were compared
(Suppl. Fig. S6)
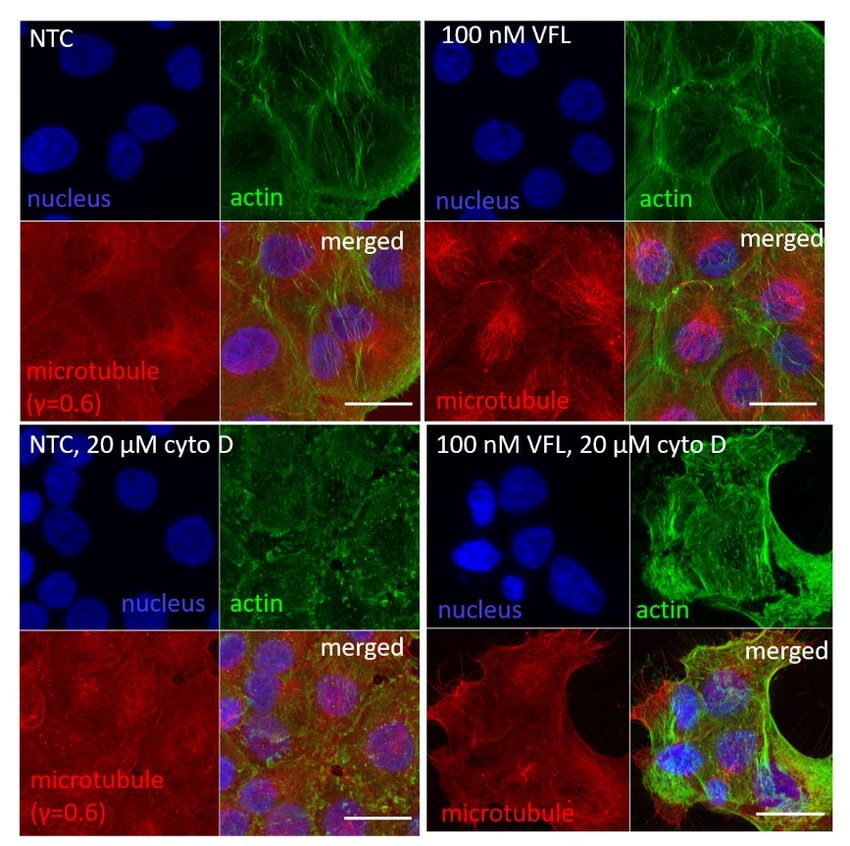
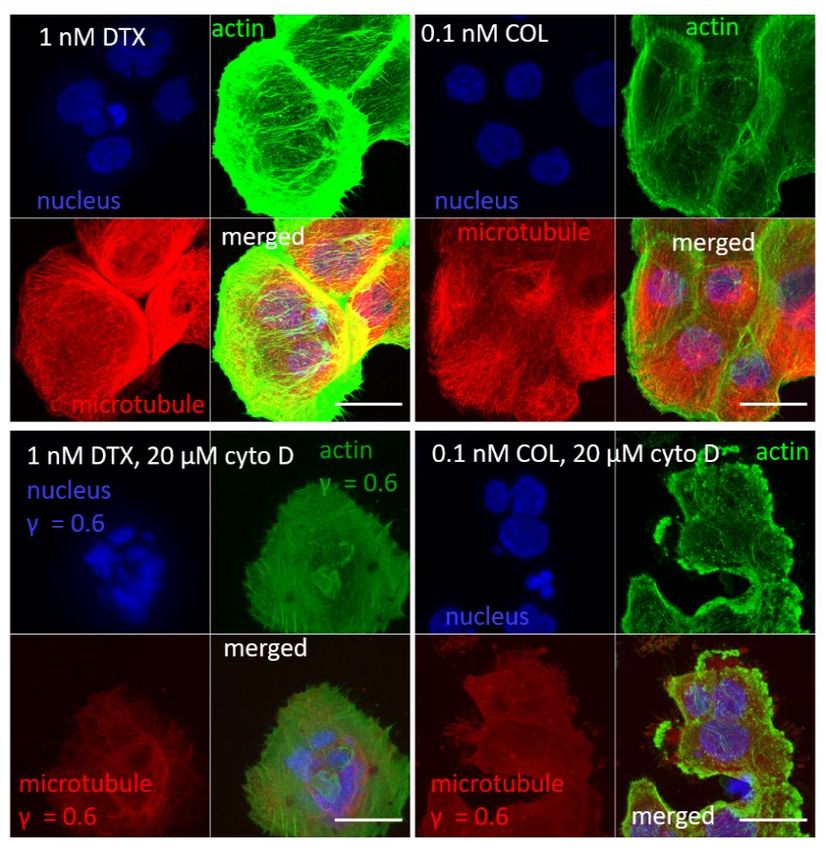
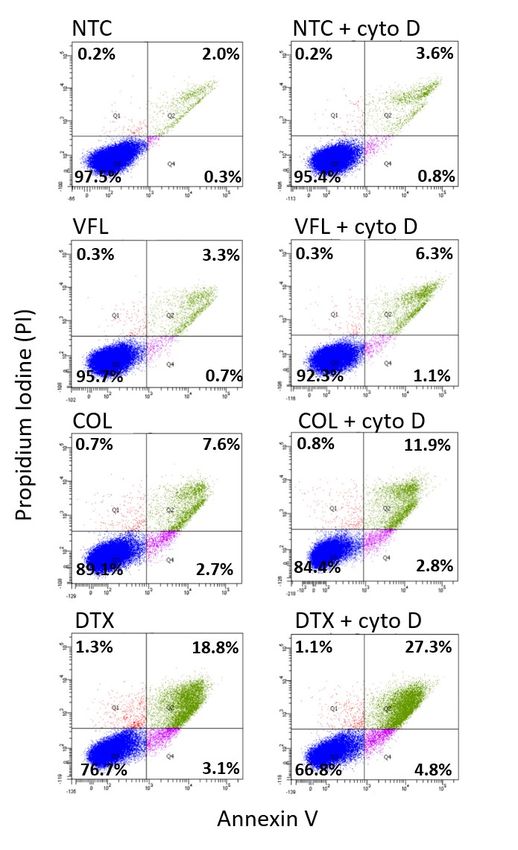
Suppl. Figure S6. Cross-sections through cell nuclei (in blue) of the MTD-treated DU145 cells.
In VFL-treated cells, the actin filaments (in green) dominated, while for other cases, the MT (in
red) presence was more pronounced.

Supplementary Note 8. Affecting the organization of actin filaments
To depolymerize the actin filaments, cells were treated with 20 µM cytochalasin D (cyto D) added
to cell culture for 30 minutes. In the case of MTD-treated cells, cyto D was applied after cells'
treatment with the corresponding MTD drug. Cell viability assays, confocal microscopy were
applied as described in the Materials and Methods.
Suppl. Figure S7. Induction of cell death in cytochalasin D treated cells. (Left panel) The number
of dead DU145 cells increased depending on the MTDs drugs (VFL, Col, DTX) compared to NTC
cells. (Right panel) A more pronounced increase of the cell death followed by the incubation with
20 µM cytochalasin D for 30 minutes.
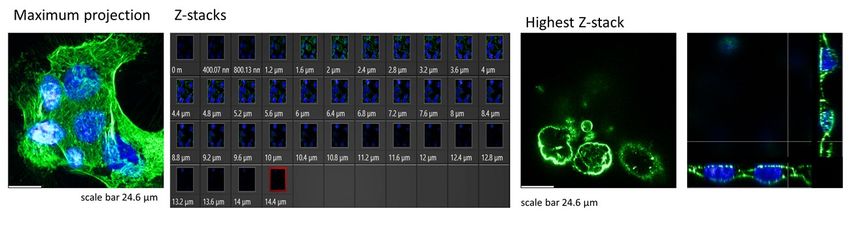
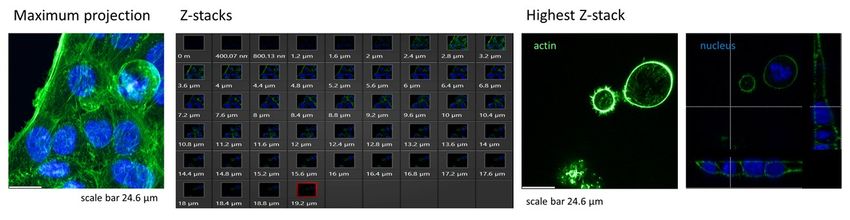
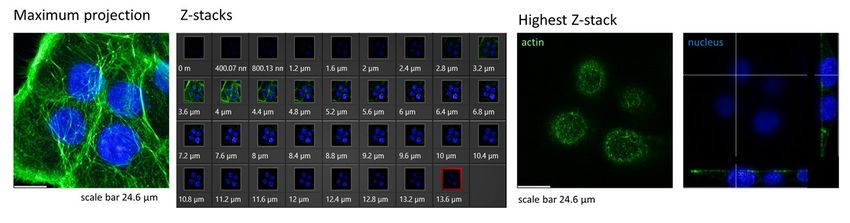
a)

 b)
Suppl. Figure S8. Confocal images recorded at the same conditions showing the effect of 20 µM
cytochalasin D on DU145 cells. Scale bar 25 µm.
To check the actin filaments' organization over the cell nucleus, the cross-section from the highest
Z-stack position was prepared after analyzing a whole group of the recorded Z-stacks
(Suppl. Fig. S9).

a)

b)

c)

d)
Suppl. Figure S9. Fluorescent images of actin filaments (in green) and cell nuclei (in blue)
showing a maximum intensity projection, all recorded Z-stacks, the F-actin organization, and
cross-sections through cell nuclei for the highest Z-stack position (marked with red square in the
Z-stacks collection). (a) NTC DU145 cells, (b) NTC treated with 20 µM cytochalasin D, (c) VFL-
treated DU145 cells, (d) VFL-treated cells after cytochalasin D (20 µM).
References:
1. Luty, M. et al. Fenofibrate augments the sensitivity of drug-resistant prostate cancer cells
 to docetaxel. Cancers (Basel). 11, (2019).
2. Butt, H. J. & Jaschke, M. Calculation of thermal noise in atomic force microscopy.
 Nanotechnology 6, 1–7 (1995).
3. Lekka, M. et al. Elasticity of normal and cancerous human bladder cells studied by
 scanning force microscopy. Eur. Biophys. J. 28, 312–316 (1999).
4. Butt, H. J., Cappella, B. & Kappl, M. Force measurements with the atomic force
 microscope: Technique, interpretation and applications. Surface Science Reports 59, 1–
 152 (2005).
5. Indrieri, M., Podestà, A., Bongiorno, G., Marchesi, D. & Milani, P. Adhesive-free
 colloidal probes for nanoscale force measurements: Production and characterization. Rev.
 Sci. Instrum. 82, (2011).
6. Puricelli, L., Galluzzi, M., Schulte, C., Podestà, A. & Milani, P. Nanomechanical and
 topographical imaging of living cells by atomic force microscopy with colloidal probes.
 Rev. Sci. Instrum. 86, 033705 (2015).
7. Dimitriadis, E. K., Horkay, F., Maresca, J., Kachar, B. & Chadwick, R. S. Determination
 of elastic moduli of thin layers of soft material using the atomic force microscope.
 Biophys. J. 82, 2798–2810 (2002).
8. Gavara, N. & Chadwick, R. S. Determination of the elastic moduli of thin samples and
 adherent cells using conical atomic force microscope tips. Nat. Nanotechnol. 7, 733–736
 (2012).
You can also read