Gas and Power with solid performance, disappointing results at SGRE weigh down Siemens Energy Group
←
→
Page content transcription
If your browser does not render page correctly, please read the page content below

Gas and Power with solid
performance, disappointing
results at SGRE weigh down
Siemens Energy Group
Christian Bruch, President and CEO Siemens Energy
Maria Ferraro, CFO Siemens Energy
Analyst presentation Q2 FY22
Berlin, May 11, 2022

Siemens Energy is a trademark licensed by Siemens AG.   Unrestricted © Siemens Energy, 2022
Disclaimer

INFORMATION AND FORWARD-LOOKING STATEMENTS This document contains statements related to our future business and financial performance, and future events or
developments involving Siemens Energy that may constitute forward-looking statements. These statements may be identified by words such as “expect,” “look forward to,”
“anticipate” “intend,” “plan,” “believe,” “seek,” “estimate,” “will,” “project,” or words of similar meaning. We may also make forward-looking statements in other reports, prospectuses,
in presentations, in material delivered to shareholders, and in press releases. In addition, our representatives may from time to time make oral forward-looking statements. Such
statements are based on the current expectations and certain assumptions of Siemens Energy´s management, of which many are beyond Siemens Energy´s control. These are
subject to a number of risks, uncertainties, and other factors, including, but not limited to, those described in disclosures, in particular in the chapter “Report on expected
developments and associated material opportunities and risks” in the Annual Report. Should one or more of these risks or uncertainties materialize, should acts of force majeure,
such as pandemics, occur, or should underlying expectations including future events occur at a later date or not at all, or should assumptions prove incorrect, Siemens Energy´s
actual results, performance, or achievements may (negatively or positively) vary materially from those described explicitly or implicitly in the relevant forward-looking statement.
Siemens Energy neither intends, nor assumes any obligation, to update or revise these forward-looking statements in light of developments which differ from those anticipated. This
document includes supplemental financial measures – that are not clearly defined in the applicable financial reporting framework – and that are or may be alternative performance
measures (non-GAAP-measures). These supplemental financial measures should not be viewed in isolation or as alternatives to measures of Siemens Energy´s net assets and
financial position or results of operations as presented in accordance with the applicable financial reporting framework in its consolidated financial statements. Other companies
that report or describe similarly titled alternative performance measures may calculate them differently. Due to rounding, numbers presented throughout this and other documents
may not add up precisely to the totals provided and percentages may not precisely reflect the absolute figures.

                                                                                                                                                              Analyst Call | Q2 FY22   2
2022-05-11       Siemens Energy is a trademark licensed by Siemens AG.                                                                               Unrestricted © Siemens Energy, 2022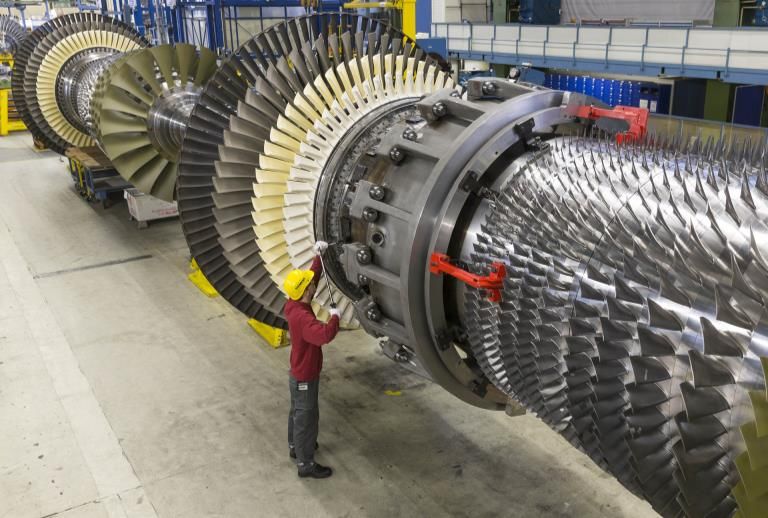
CEO section
Christian Bruch, CEO

                                                                              Analyst Call | Q2 FY22   3
2022-05-11   Siemens Energy is a trademark licensed by Siemens AG.   Unrestricted © Siemens Energy, 2022
Key Messages

Highlights / Lowlights
• SGRE profit warning (April 19, 2022)
• Solid performance in Gas and Power (GP)
• Siemens Energy stopped all new business activities in Russia
                                                                                                          Q2 FY22 Financial Performance
Market Environment                                                                                        • Orders: (27.5)% comp.2 at €7.9bn
• Solid order environment across all businesses at GP                                                     • Order backlog at new high of €89.3bn
• SGRE market dynamics remain challenging                                                                 • Revenue: (1.7)% comp.2 at €6.6bn; book-to-bill of 1.20
• War in Ukraine and Covid-19 exacerbating existing supply chain constraints                              • Adj. EBITA before SI: €(21)m (down from €288m)
                                                                                                          • Adj. EBITA margin before SI: (0.3)% (Q2 FY21 4.4%)
Revised Guidance FY221
                                                                                                          • FCF pre tax: €(351)m (down from €433m)
SE           • Low end of previous guidance ranges for comparable2 revenue
               development (neg. 2% to pos. 3%) and for Adj. EBITA margin
               before SI (pos. 2% to pos. 4%)
GP           • Low end of previous guidance ranges for comparable2 revenue
               development (pos. 1% to pos. 5%) and for Adj. EBITA margin
               before SI (pos. 4.5% to pos. 6.5%)
SGRE         • Revenue decline of (2)% to (9)% comp.2 (unchanged)
             • Low end of previous guidance range with negative 4%
1 Assuming no further major financial impacts from COVID-19 and charges related to legal and regulatory
matters (including sanctions) | 2 comparable: excluding currency translation and portfolio effects                                               Analyst Call | Q2 FY22   4
2022-05-11                                                                                                                              Unrestricted © Siemens Energy, 2022
Renewed risk assessment under the new CEO leads to a reset
             of expectations
             •   Operational problems are bigger than expected due to internal challenges
                 (maturity of product design of the 5.X, manufacturing ramp up process,
                 NCCs, project execution) and supply chain constraints
             •   Outlook continuously deteriorated over the last 12 months
             •   Root causes for underperformance identified; solid foundations available
                 to build turn-around

             Turnaround plan by new CEO initiated
SGRE         •   Dedicated short-term task forces launched with exclusive focus on
                 mitigating ongoing challenges: Siemens Gamesa 5.X, Procurement
             •   Cross-functional set-ups to ensure holistic approach to problem solving;
                 best-in-class talent mobilized
             •   Commercial discipline:
                  •   Selectivity: Further cost volatility risk protection clauses implemented
                      in contracts
                  •   Reinforced new project approval process
                  •   Closer alignment between Procurement and Sales
             •   Enhanced focus across organization on containing internal costs
                                                                                Analyst Call | Q2 FY22   5
2022-05-11                                                             Unrestricted © Siemens Energy, 2022
War in Ukraine effects revenue and profitability, Gas
and Power business in Russia under review
• All new business development activity in Russia stopped since beginning of the war
• c. €300 – €400m loss of revenue in FY22 (based on the current sanction regime)
Current status • High double digit/low triple digit (€m) impact due to missing profit contribution from
loss of revenue in FY22
• Increasing EBIT volatility going forward due to elimination of hedge accounting for
Russian Ruble
• Dynamic development of sanctions regime might trigger additional impact on
Potential aggravation revenue and Adj. EBITA
• Gas and Power business base in Russia under Review
Exacerbation effects on • Limited direct sourcing from Russia
supply chain constraints • Indirect impacts through rising raw material and logistics costs
Analyst Call | Q2 FY22 6
2022-05-11 Unrestricted © Siemens Energy, 2022Supply chain constraints lead to higher costs
and under-absorption in GP
Current Challenges Impact (roughly €100m impact on profitability)
€10.5bn of purchasing volume includes
• Copper: 15,000 – 20,000 tons
Raw Material Costs • Electrical steel: 100,000 tons
• Aluminum: 10,000 – 15,000 tons
• Stainless Steel: 6,000 – 7,000 tons
• €400m logistics cost
Material Availability
Lack of material availability leads to factory under-absorption
Shorter cycle Transmission product business mostly affected
Logistics
Mitigation measures
Procurement instruments (like long term contracts, hedging, supplier bundling, etc.)
Wage inflation
Price escalation clauses in service business
Pass-through mechanisms in projects
Synchronous contracting with customers/suppliers
Increase in inventory
Improving pricing power
Analyst Call | Q2 FY22 7
2022-05-11 Unrestricted © Siemens Energy, 2022Version 18
Q2 FY22 awards and milestones
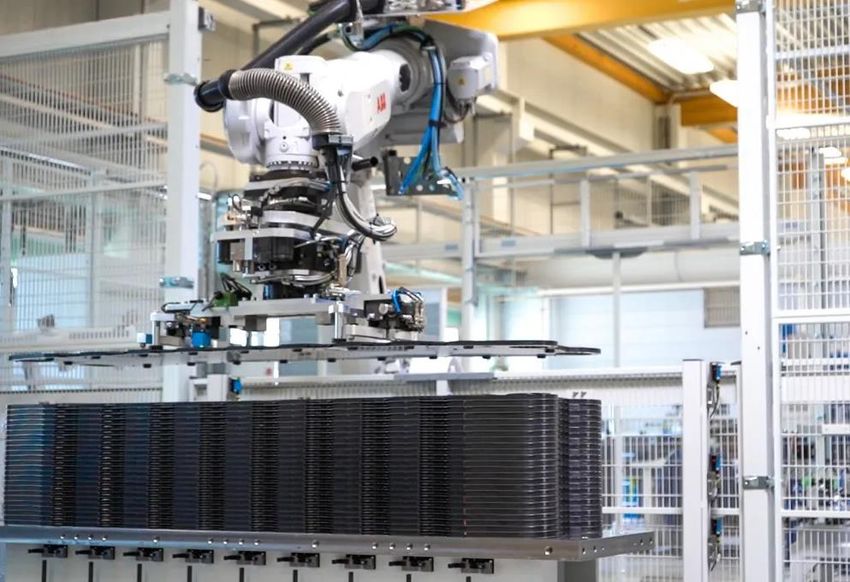
Power generation with low Transport and storage Reducing the CO2 footprint &
or zero emissions of energy energy consumption in
industrial processes
Picture to be
replaced
Efficient and future-proof power Increased supply security Production of electrolysers on an
generation technologies Siemens Energy supplies HVDC system industrial scale
Four combined-cycle gas turbine units for first power link between the UK and 2023 Start of production in Berlin with
meet growing energy demand in Greater Germany ("NeuConnect interconnector") capacity in the gigawatt range
Bay Area in China
Analyst Call | Q2 FY22 8
2022-05-11 Unrestricted © Siemens Energy, 2022CFO section
Maria Ferraro, CFO
Analyst Call | Q2 FY22 9
2022-05-11 Siemens Energy is a trademark licensed by Siemens AG. Unrestricted © Siemens Energy, 2022Siemens Energy Group: Strong order intake results in record order backlog
Q2 FY22
Orders (in €bn) Revenue (in €bn) Adj. EBITA before SI (in €m)
(25)% / (27)%1
10.5
+2% / (2)%1
7.9 n/a
6.5 6.6
288
2.2 2.4 10%
4.3 4.2 (3)%
(21)
4.4% (0.3)%
Q2 FY21 Q2 FY22 Q2 FY21 Q2 FY22
Q2 FY21 Q2 FY22
Services New Unit
Order Backlog2 Book-to-Bill Ratio Free Cash Flow3
€89bn 1.20 €(351)m
Q1 FY22: €87bn Q2 FY21: 1.62 Q2 FY21: €433m
1 xx% / xx% = nominal / comparable (excluding currency translation and portfolio effects) | 2 As of March 31, 2022 | 3 Free Cash Flow pre tax Analyst Call | Q2 FY22 10
2022-05-11 x.x% Adj. EBITA margin before Special Items Unrestricted © Siemens Energy, 2022Siemens Energy Group: SGRE weighs on performance
Q2 FY22
Orders (in €bn) Revenue (in €bn) Adj. EBITA before SI (in €m)
(25)% / (27)%1
10.5 +2% / (2)%1 n/a
9.1 288
8.3 7.9 8.2
7.3
5.9 6.5 6.0 6.6
54
(46) (63) (21)
4.4% +2.9%
0.7% (0.6)% (1.1)% (0.3)%
Q2 FY21 Q3 Q4 Q1 Q2 FY22 Q2 FY21 Q3 Q4 Q1 Q2 FY22 Q2 FY21 Q3 Q4 Q1 Q2 FY22
• GP: Significant order growth across all • GP: Moderate increase driven by service • GP: Strong performance driven by more
businesses business service business, operational improvements
• SGRE: Sharply below the exceptionally • SGRE: Significantly down as operational and savings from restructuring measures
high prior-year period’s level problems and supply chain constraints held • SGRE: Adj. EBITA loss driven by continued
back revenue in wind turbine business operational problems and further pressure on
raw material and logistic costs
1 xx% / xx% = nominal / comparable (excluding currency translation and portfolio effects) Analyst Call | Q2 FY22 11
2022-05-11 x.x% Adj. EBITA margin before Special Items Unrestricted © Siemens Energy, 2022Net Cash Position remains solid
Net cash/(Net debt) as of March 31, 2022 (in €m)
5,030 5,131 FY22 expected cash-out
101
SGRE: €2.8 bn
• Restructuring (>€200m)
SE excl. SGRE: €0.5 bn
(3,327)
• Non carve-out countries(c. €200m)
(189)
1,615
(725)
(89) 801
Cash and cash Receivables from Total Long- and short- Payables to Net cash/ Pension Credit Adjusted Net
equivalents Siemens Group liquidity term debt Siemens Group (Net debt) provisions guarantees cash/(Net debt)
from financing from financing
activities activities
SGRE Siemens Energy excl. SGRE Siemens Energy
Undrawn credit lines of €2.5bn1 Undrawn credit lines of €3.0 bn1 €10.6 bn liquidity available (€5.1 bn cash and €5.5 bn undrawn facilities)
1 As of March 31, 2022; No major maturity towers, no covenants attached
Analyst Call | Q2 FY22 12
2022-05-11 Unrestricted © Siemens Energy, 2022Gas and Power1: Solid performance in Q2 FY22
Q2 FY22
Orders (in €bn) Revenue (in €bn) Adj. EBITA before SI (in €m)
+34% / +29%²
6.7 +6% / +3%² +42%
4.2 4.4 266
5.0
1.7 1.9 8% 188
2.5 5%
2.4
Q2 FY21 Q2 FY22 Q2 FY21 Q2 FY22 4.5% 6.0%
Services New Unit Q2 FY21 Q2 FY22
Order Backlog3 Book-to-Bill Ratio Free Cash Flow4
€57bn 1.52 €200m
Q1 FY22: €54bn Q2 FY21: 1.21 Q2 FY21: €515m
1 Beginning with fiscal year 2022, GP segment’s Real Estate Portfolio, formerly shown under Reconciliation to Consolidated Financial Statements, is assigned to
segment GP. Related prior year information has been reclassified to conform to the current year presentation | 2 xx% / xx% = nominal / comparable (excluding
currency translation and portfolio effects) | 3 As of March 31, 2022 | 4 Free Cash Flow pre tax Analyst Call | Q2 FY22 13
2022-05-11
2022-02-09 x.x% Adj. EBITA margin before Special Items Unrestricted © Siemens Energy, 2022Gas and Power1: Strong orders and profitability
Q2 FY22
Orders (in €bn) Revenue (in €bn) Adj. EBITA before SI (in €m)
+34% / +29%²
+6% / +3%²
6.7 +42
6.2 5.9 5.4 266
5.0 4.6 4.4 225 242
4.4 4.2 4.1 188
153
4.5% 4.9% 2.9% 5.8% 6.0%
Q2 FY21 Q3 Q4 Q1 Q2 FY22 Q2 FY21 Q3 Q4 Q1 Q2 FY22 Q2 FY21 Q3 Q4 Q1 Q2 FY22
• Strong growth across all businesses • Revenue increase driven by Transmission • Strong performance driven by more
supported by both the new unit and and Industrial Applications service business, operational
service businesses • The improvement mainly came from the improvements and savings from
• Demand in the Americas reporting region service business restructuring measures
was especially strong • Impacts related to the war against
Ukraine were limited
1 Beginning with fiscal year 2022, GP segment’s Real Estate Portfolio, formerly shown under Reconciliation to Consolidated Financial Statements, is assigned to segment GP. Related
prior year information has been reclassified to conform to the current year presentation | 2 xx% / xx% = nominal / comparable (excluding currency translation and portfolio effects) Analyst Call | Q2 FY22 14
2022-05-11 x.x% Adj. EBITA margin before Special Items Unrestricted © Siemens Energy, 2022Financial 1 Execution of cost out programs; additional measures to
mitigate negative impacts from war and Covid-19
Priorities for
FY22
2 Continuous tight management of net working capital;
strong focus on liquidity
More transparency – new reporting structure from
3 October 1, 2022
Analyst Call | Q2 FY22 15
2022-05-11 Unrestricted © Siemens Energy, 2022Financial Outlook and Framework
Actuals Outlook Mid-term target
FY20 FY21 FY22 FY23
Revenue €18.1bn €18.4bn
1%-5%
Gas and Power
(low end of the range)
% Change y-o-y2 (3.1)% 1.5%
Adj. EBITA before Special Items €254m €849m
4.5%-6.5% 6%-8%
(low end of the range)
% Margin before Special Items 1.4% 4.6%
Cumulative mid-to-high triple digit euro million amount in
Restructuring costs3 €133m €360m
FY20-23
Revenue €27.5bn €28.5bn
(2)%-3%
Siemens Energy
Flat to 3%1
(low end of the range)
% Change y-o-y2 (4.7)% 3.7%
Adj. EBITA before Special Items (€17)m €661m
2%-4% under reassessment ≥8%
(low end of the range) (pre. 6.5%-8.5%) Margin reported4
% Margin before Special Items (0.1)% 2.3%
Tax rate Medium-term tax rate 25%-30%
1 Rolling 3-year average total revenue growth, excluding portfolio and currency effects | 2 FY20 nominal change compared to FY19; FY21 nominal change
compared to FY20; FY22 comparable change compared to FY21 | 3 Included in Special Items definition | 4 Adj. EBITA not adjusted for Special Items Analyst Call | Q2 FY22 16
2022-05-11 Unrestricted © Siemens Energy, 20221 Deliver on the fundamentals at GP; support turnaround
at SGRE
Management
Priorities for 2 Focus on supply chain, logistics and raw materials
FY22
3 Refine operating model and shape organization towards
the three pillars
4 Focus the company on sustainable growth elements
Analyst Call | Q2 FY22 17
2022-05-11 Unrestricted © Siemens Energy, 2022We are #TeamPurple #WeEnergizeSociety
Meet us at our CMD
May 23-24, 2022
in Berlin
Siemens Energy is a trademark licensed by Siemens AG. Unrestricted © Siemens Energy, 2022Questions &
Answers
Christian Bruch and Maria Ferraro
Analyst Call | Q2 FY22 19
2022-05-11 Siemens Energy is a trademark licensed by Siemens AG. Unrestricted © Siemens Energy, 2022Financial Calendar
2022
May 11 May 23-24 June/July Aug 8 Nov 16
Q2 FY22 Capital Market Day Conferences and Q3 FY 22 Q4 FY22
roadshows
Contact Investor Relations
Michael Hagmann Tobias Hang
Harald Albrecht
Head of Investor Relations tobias.hang@siemens-energy.com
albrecht.harald@siemens-energy.com
michael.hagmann@siemens-energy.com +49 172 5744423
+49 174 1766254
+49 173 2669650
Siemens Energy AG
Lisa Class Otto-Hahn-Ring 6
Thomas Forstner-Sonne
Team Assistant 81739 Munich, Germany
thomas.forstner@siemens-energy.com
lisa.class@siemens-energy.com investorrelations@siemens-energy.com
+49 172 7497108
+49 89 6362 5358 www.siemens-energy.com/investorrelations
Analyst Call | Q2 FY22 20
2022-05-11 Siemens Energy is a trademark licensed by Siemens AG. Unrestricted © Siemens Energy, 2022Appendix
Analyst Call | Q2 FY22 21
2022-05-11 Siemens Energy is a trademark licensed by Siemens AG. Unrestricted © Siemens Energy, 2022Special Items
Reconciliation of Adj. EBITA before Special Items
In €m Q2 FY21 Q2 FY22 H1 FY21 H1 FY22 Gas and Power
Gas and Power1
• Personal Restructuring costs (severance)
Adj. EBITA before Special Items 188 266 456 508 Takes into account progress on existing programs
Restructuring and integration costs (47) 0 (43) (9) and new restructuring measures
Stand-alone costs (17) (12) (71) (25)
• Stand-alone costs
Strategic portfolio decisions 47 (20) 20 19 Reflects costs associated with the setup of the
Special Items (18) (32) (93) (15) new company. Sharp reduction y-o-y
Adj. EBITA 170 234 363 492
• Strategic portfolio decisions
Prior year included a positive one-time effect
SGRE related to aeroderivative gas turbines previously
Adj. EBITA before Special Items 113 (278) 231 (585) written-off
Special Items2 (71) (24) (118) (35)
Adj. EBITA 42 (301) 113 (620)
Siemens Energy
Adj. EBITA before Special Items 288 (21) 654 (84)
Special Items (91) (56) (214) (50)
Adj. EBITA 197 (77) 439 (135)
1 Beginning with fiscal year 2022, GP segment’s Real Estate Portfolio, formerly shown under Reconciliation to Consolidated
Financial Statements, is assigned to segment GP. Related prior year information has been reclassified to conform to the
current year presentation | 2 equals integration and restructuring cost as reported by SGRE Analyst Call | Q2 FY22 22
2022-05-11 Unrestricted © Siemens Energy, 2022Net Income Transition
Siemens Energy
In €m Q2 FY21 Q2 FY22 H1 FY21 H1 FY22
170 234 363 492
Financial result
Gas and Power
Impacted by interest expenses and currency effects
SGRE 42 (301) 113 (620)
Reconciliation to Siemens Energy (14) - (34) 2 Tax
Adj. EBITA 197 (77) 439 (135) €60m income tax expenses which include effects
from the non-recognition of deferred tax assets at
Adj. EBITA margin 3.0% (1.2)% 3.4% (1.1)% SGRE
Amortization of intangible assets acquired in
business combinations and goodwill (97) (96) (194) (192)
impairments
Financial result from operations1 9 (20) 27 (18)
Financial result2 (32) 1 (69) (18)
Income before income taxes 77 (192) 203 (362)
Income tax (expenses/gains) (46) (60) (74) (130)
Net income 31 (252) 130 (492)
Attributable to
Non-controlling interests 7 (96) 42 (211)
Shareholders of Siemens Energy AG 24 (156) 88 (281)
1 Financial result from operations, as subpart of financial result, is included in Adjusted EBITA | 2 Financial result = (Interest
income - Interest expenses +/- Other financial income (expenses), net). Analyst Call | Q2 FY22 23
2022-05-11 Unrestricted © Siemens Energy, 2022Cash Flow Statement
Siemens Energy
In €m Q2 FY21 Q2 FY22 H1 FY21 H1 FY22
Net income 31 (252) 130 (492)
CAPEX
Amortization, depreciation and impairments 355 399 699 734
Change in operating net working capital • Increase by €58m y-o-y driven by both segments
Contract assets 39 121 (167) 388 Free Cash Flow pre tax
Inventories (193) (538) (257) (1,282) • GP: Below prior-year‘s level due to a negative
Trade receivables 392 (152) 189 (157) swing y-o-y associated with derivatives
Trade payables 172 160 (105) (120)
• SGRE: Negative free cash flow pre tax sharply
Contract liabilities (89) 517 640 1,422 increased y-o-y mainly driven by the lower result
Others (247) (479) (915) (690) and an increase in receivables
Cash flow from operating activities 462 (225) 213 (198)
Additions to intangible assets and property, plant
(201) (259) (389) (434)
and equipment
Free cash flow 260 (484) (175) (632)
Income taxes paid (172) (133) (220) (212)
Free Cash Flow pre tax 433 (351) 45 (420)
thereof Gas and Power1 515 200 657 922
thereof SGRE (32) (560) (392) (1,356)
1 Beginning with fiscal year 2022, GP segment’s Real Estate Portfolio, formerly shown under Reconciliation to
Consolidated Financial Statements, is assigned to segment GP. Related prior year information has been reclassified to
conform to the current year presentation Analyst Call | Q2 FY22 24
2022-05-11 Unrestricted © Siemens Energy, 2022Nominal versus comparable growth rates
Siemens Energy
In €m Q2 FY21 Q2 FY22 % nom. % comp.1 H1 FY21 H1 FY22 % nom. % comp.1
Gas and Power2 5,034 6,743 34.0 29.0 10,200 12,633 23.9 20.2
SGRE 5,500 1,198 (78.2) (78.8) 7,781 3,670 (52.8) (53.6)
Reconciliation to Siemens Energy (14) (33) (29) (65)
Total Orders 10,520 7,908 (24.8) (27.5) 17,951 16,238 (9.5) (11.9)
Gas and Power2 4,171 4,424 6.1 3.1 8,459 8,564 1.2 (1.5)
SGRE 2,336 2,177 (6.8) (10.5) 4,631 4,006 (13.5) (16.8)
Reconciliation to Siemens Energy (19) (19) (66) (32)
Total Revenue 6,484 6,582 1.5 (1.7) 13,024 12,538 (3.7) (6.6)
1 comparable: excluding currency translation and portfolio effects | 2 Beginning with fiscal year 2022, GP segment’s Real Estate Portfolio, formerly shown under Reconciliation to Consolidated
Financial Statements, is assigned to segment GP. Related prior year information has been reclassified to conform to the current year presentation Analyst Call | Q2 FY22 25
2022-05-11 Unrestricted © Siemens Energy, 2022Disaggregation of revenue
Siemens Energy
In €m Q2 FY21 Q2 FY22 % change H1 FY21 H1 FY22 % change
Types of activities in Gas and Power
New units 2,408 2,533 5.2 4,908 4,900 (0.2)
Service contracts 1,738 1,872 7.7 3,484 3,632 4.2
Types of business in SGRE
Wind turbines 1,902 1,662 (12.6) 3,801 3,062 19.4
Operation and maintenance 434 515 18.7 830 943 13.6
Types of business in Gas and Power
Transmission 1,241 1,358 9.4 2,491 2,656 6.6
Generation 1,776 1,795 1.1 3,623 3,484 (3.8)
Industrial applications 1,125 1,236 9.9 2,267 2,366 4.4
Other /Consolidation 5 16 10 26
Note: Q2 figures presented on this slide are based on external revenue
Analyst Call | Q2 FY22 26
2022-05-11 Unrestricted © Siemens Energy, 2022Version 18
Gas and Power: Development by businesses
Q2 FY22
in % nom. y-o-y Q1 FY22 Q2 FY22
Gas and Power +++ +++
Grading system
Order
Generation +++ +++
growth >10% +++
Industrial Applications +++ +++ 5% - 10% ++
0% - 5% +
Transmission ++ +++
0% - (5)% -
Gas and Power - ++ (5)% - (10)% --
> (10)% ---
Revenue
Generation -- +
growth
Industrial Applications
- ++
Transmission + ++
Analyst Call | Q2 FY22 27
2022-05-11 Unrestricted © Siemens Energy, 2022Profit and Loss Statement (I)
Siemens Energy
In €m Q2 FY21 Q2 FY22 H1 FY21 H1 FY22
Revenue 6,484 6,582 13,024 12,538
Cost of sales (5,471) (5,859) (11,009) (11,093)
Gross profit 1,013 723 2,015 1,445
Gross profit margin 15.6% 11.0% 15.5% 11.5%
Research and development expenses (289) (265) (525) (491)
R&D as percentage of revenue (4.5)% (4.0)% (4.0)% (3.9)%
Selling ang general administrative expenses (629) (648) (1,262) (1,313)
SG&A as percentage of revenue (9.7)% (9.8)% (9.7)% (10.5)%
Other operating income 17 16 51 35
Other operating expenses (28) (65) (38) (80)
Income (loss) from investments accounted for using the equity method, net 24 46 30 59
Interest income 6 11 13 22
Interest expenses (30) (37) (61) (69)
Other financial income (expenses), net (7) 28 (21) 30
Income (loss) before income taxes 77 (192) 203 (362)
Income tax (expenses/gains) (46) (60) (74) (130)
Net income (loss) 31 (252) 130 (492)
Attributable to
Non-controlling interests 7 (96) 42 (211)
Shareholders of Siemens Energy AG 24 (156) 88 (281)
Analyst Call | Q2 FY22 28
2022-05-11 Unrestricted © Siemens Energy, 2022Profit and Loss Statement (II)
Siemens Energy
In €m Q2 FY21 Q2 FY22 H1 FY21 H1 FY22
Gas and Power1 4,171 4,424 8,463 8,564
SGRE 2,336 2,177 4,631 4,006
Reconciliation to Siemens Energy (23) (19) (70) (32)
Total Revenue 6,484 6,582 13,024 12,538
Gas and Power1 188 266 456 508
SGRE 113 (278) 231 (585)
Reconciliation to Siemens Energy (12) (9) (31) (7)
Adj. EBITA before Special Items 288 (21) 654 (84)
Adj. EBITA margin before Special Items 4.4% (0.3)% 5.0% (0.7)%
Gas and Power1 (18) (32) (93) (15)
SGRE (71) (24) (118) (35)
Reconciliation to Siemens Energy (2) (0) (3) (0)
Special Items (91) (56) (214) (50)
1 Beginning with fiscal year 2022, GP segment’s Real Estate Portfolio, formerly shown under Reconciliation to Consolidated Financial Statements, is assigned to
segment GP. Related prior year information has been reclassified to conform to the current year presentation Analyst Call | Q2 FY22 29
2022-05-11 Unrestricted © Siemens Energy, 2022Statement of Financial Position
Siemens Energy
In €m Sep. 30, 2021 Mar. 31, 2022
Goodwill and other intangible assets 13,099 13,288
Property, plant and equipment and other non-current assets 7,645 7,940
Inventories 6,146 7,552
Trade and other receivables 5,110 5,377
Contract assets 4,913 4,630
Cash and cash equivalents 5,333 5,030
Other current assets 1,895 2,431
Total assets 44,141 46,248
Total equity attributable to shareholders of Siemens Energy AG 14,958 15,387
Non-controlling interests 262 2
Total equity 15,220 15,389
Provision for pensions and similar obligations 830 725
Long-term and short-term debt 2,728 3,327
Trade payables 5,764 5,756
Contract liabilities 10,350 11,936
Other current and non-current liabilities 9,250 9,114
Total liabilities 28,921 30,859
Total equity and liabilities 44,141 46,248
Adjusted net cash / (net debt) (unaudited) 1,596 801
Analyst Call | Q2 FY22 30
2022-05-11 Unrestricted © Siemens Energy, 2022Profit Bridge from SGRE to SE disclosure
Q2 FY22
Profit Bridge from SGRE1 to SE2 disclosure (in €m)
Integration & Consolidation Adj. EBITA
Restructuring EBIT (as Financial and accounting Adj. EBITA (before
EBIT (underl.) Cost PPA effects reported) PPA effects3 Income differences (as reported) Special Items4 Special Items)
(304) (301) (278)
(385)
27 0 24
(24)
(57) 57
(14.0)% (17.7)% (13.8)% (12.8)%
1 Disclosure (as of May 5, 2022) | 2 Disclosure (as of May 11, 2022) | 3 PPA = Amortization of intangible assets acquired in business combinations and goodwill impairments
4 Equals integration and restructuring cost as reported by SGRE Analyst Call | Q2 FY22 31
2022-05-11 Siemens Energy is a registered trademark licensed by Siemens AG. Unrestricted © Siemens Energy, 2022Transfer of centrally held Real Estate services to Gas and Power segment
Summary prior year reclassification
Gas and Power
In €m Q1 FY21 Q2 FY21 Q3 FY21 Q4 FY21 FY21
Orders
Quarter (as reported in FY21) 5,166 5,030 4,453 6,231 20,880
Quarter restated1 5,166 5,034 4,455 6,233 20,888
Change due to restatement 0 4 2 2 8
Revenue
Quarter (as reported in FY21) 4,292 4,167 4,577 5,350 18,386
Quarter restated1 4,292 4,171 4,579 5,353 18,395
Change due to restatement 0 4 2 3 9
Adj. EBITA
Quarter (as reported in FY21) 191 169 84 (67) 377
Quarter restated1 193 179 78 (79) 361
Change due to restatement 1 10 (6) (12) (16)
1 Beginning with fiscal year 2022, GP segment’s Real Estate Portfolio, formerly shown under Reconciliation to Consolidated Financial Statements, is
assigned to segment GP. Related prior year information has been reclassified to conform to the current year presentation Analyst Call | Q2 FY22 32
2022-05-11 Unrestricted © Siemens Energy, 2022Transfer of centrally held Real Estate services to Gas and Power segment
Summary prior year reclassification
Gas and Power
In €m Q1 FY21 Q2 FY21 Q3 FY21 Q4 FY21 FY21
Adj. EBITA before SI ext.
Quarter (as reported in FY21)
267 187 231 165 849
Quarter restated1
268 188 225 153 834
Change due to restatement 1 1 (6) (12) (15)
Free Cash Flow
Quarter (as reported in FY21) 101 481 384 240 1,206
Quarter restated1 142 515 422 289 1,369
Change due to restatement 41 34 38 49 163
1 Beginning with fiscal year 2022, GP segment’s Real Estate Portfolio, formerly shown under Reconciliation to Consolidated Financial Statements, is
assigned to segment GP. Related prior year information has been reclassified to conform to the current year presentation Analyst Call | Q2 FY22 33
2022-05-11 Unrestricted © Siemens Energy, 2022You can also read