October 10, 2014 General Presentation - SBM Offshore
←
→
Page content transcription
If your browser does not render page correctly, please read the page content below

General Presentation
October 10, 2014

© SBM Offshore 2014. All rights reserved. www.sbmoffshore.com
Disclaimer

                  Some of the statements contained in this presentation that are not historical facts are
                  statements of future expectations and other forward-looking statements based on
                  management’s current views and assumptions and involve known and unknown risks
                  and uncertainties that could cause actual results, performance, or events to differ
                  materially from those in such statements. Such forward-looking statements are subject
                  to various risks and uncertainties, which may cause actual results and performance of
                  the Company’s business to differ materially and adversely from the forward-looking
                  statements.

                  Should one or more of these risks or uncertainties materialize, or should underlying
                  assumptions prove incorrect, actual results may vary materially from those described in
                  this presentation as anticipated, believed, or expected. SBM Offshore NV does not
                  intend, and does not assume any obligation, to update any industry information or
                  forward-looking statements set forth in this presentation to reflect subsequent events or
                  circumstances.

IR - 06/08/2014                                                                                               2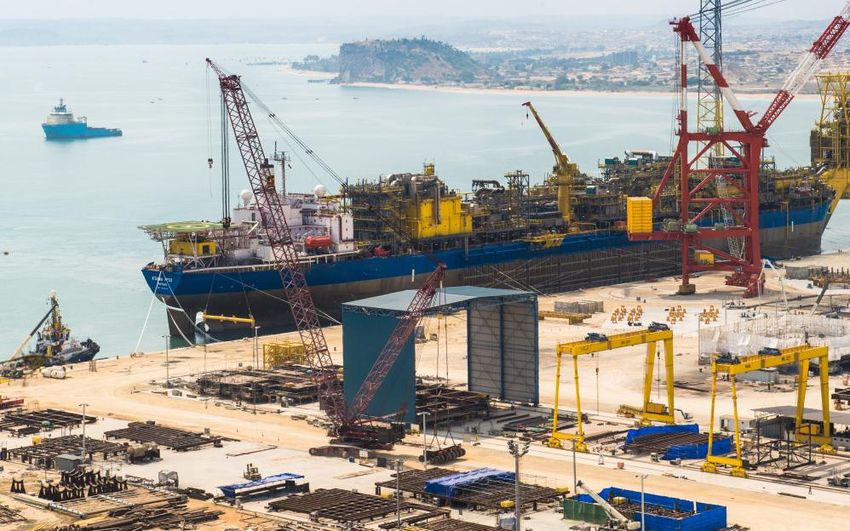
1H 2014 in Review
99% IFRS
0.06 Directional(1)
Fleet Revenue Revenue
LTIFR US$1,729 mn
Uptime Up 29%
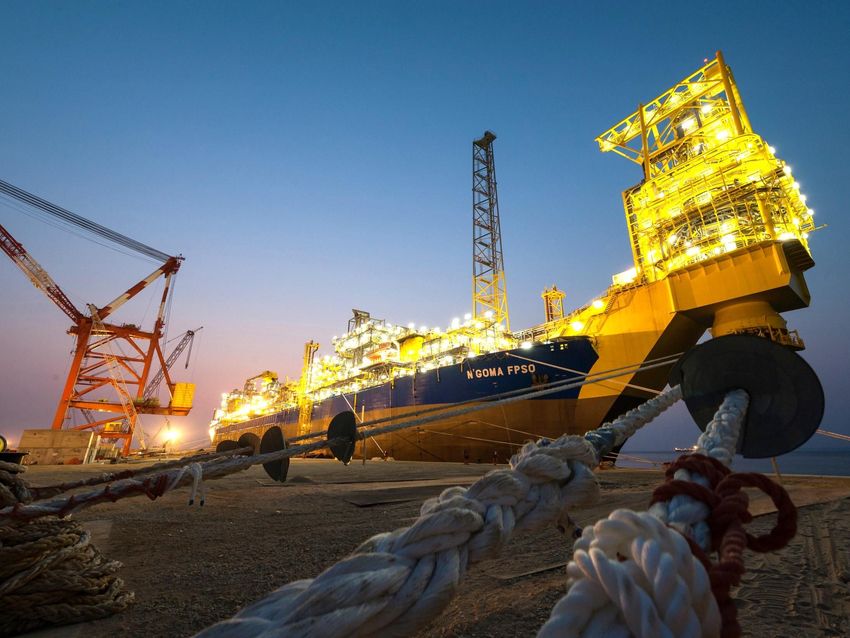
N’Goma Kikeh
US$1.85 bn Floating brownfield
lifting project
completed financing Solutions extension
delivered
US$21.5 bn US$240 mn
IFRS 10
& 11
Brazil Directional(1) settlement
Backlog provision
IR - 06/08/2014 (1) Directional view is a non-IFRS disclosure, which assumes all lease contracts are classified as operating leases and all vessel joint ventures are proportionally consolidated. 3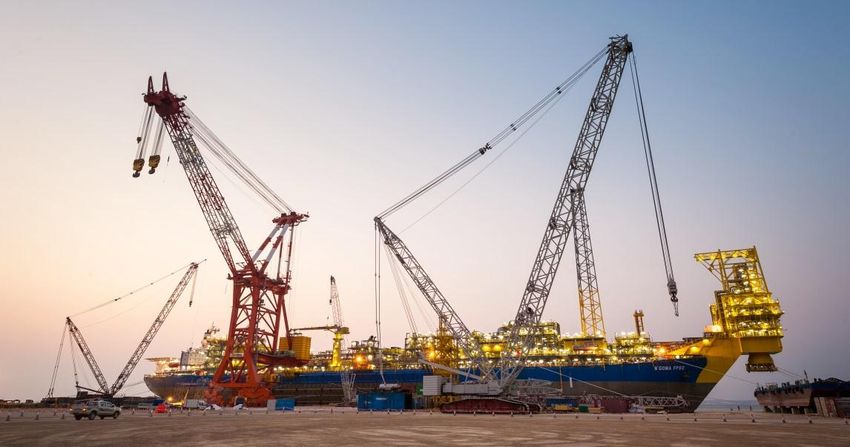
No.1 FPSO Player Worldwide

                  The Company                                                                                                           Lease Fleet
                   5 Execution Centres                                                                                                     10 FPSOs; 4 FPSOs under construction
                   10 Operational Shore Bases                                                                                              2 FSOs
                   5 Representative Offices                                                                                                1 Semi Sub
                   10,983 Employees                                                                                                        1 MOPU

                  Financials in US$ billion                                                                                             Performance 1H2014
                   2014 Directional(1) Guidance                                               3.3                                          251 years of operational experience
                   Directional(1) Backlog (30/6/2014)                                       21.5                                           99% Uptime
                   Market Cap (as of 5/8/2014)                                                 2.8                                         1.16 MM bbls throughput capacity/day
                                                                                                                                           6,948 Tanker Offloads

IR - 06/08/2014   (1) Directional view is a non-IFRS disclosure, which assumes all lease contracts are classified as operating leases and all vessel joint ventures are proportionally consolidated.   4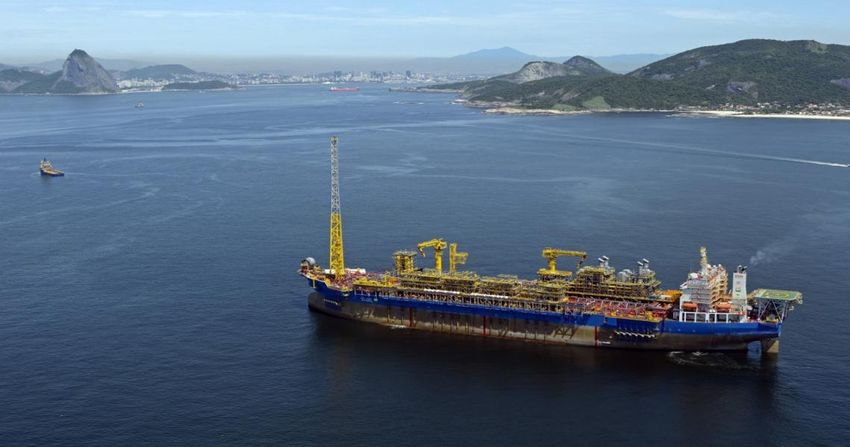
Delivering the Full Product Lifecycle

                                     Engineering                 Procurement
                        50 years of industry firsts              Integrated supply chain
                        Leading edge technology                  Global efficiencies
                                                                 Local sourcing

               Product Life Extension                                   Construction
             Leader in FPSO relocation                                  Strategic partnerships
                World class after sales                                 Unrivalled project experience

                                       Operations                Installation
                  160+ years of FPSO experience                  Dedicated fleet
                         99%+ production uptime                  Unparalleled experience
                  Largest international FPSO fleet               Extensive project capability

IR - 06/08/2014                                                                                         5
Agenda
1H 2014 Review
Macro View
1H 2014 Financials
Outlook

                     6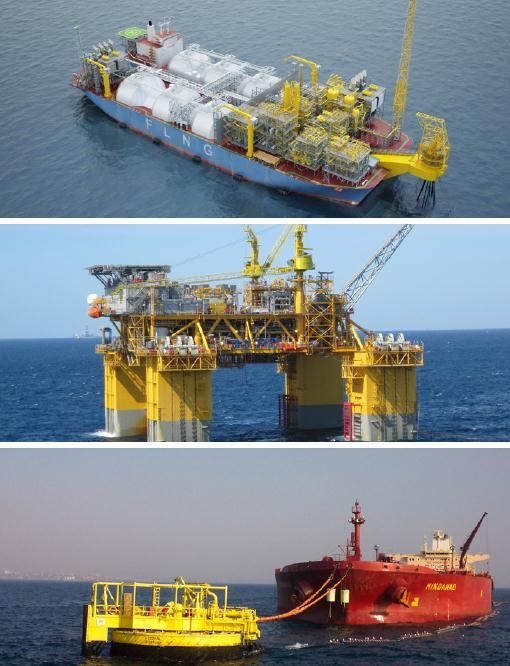
Total Overview
                                                                                                                                                                                                                (US$ millions)

                                                                                                                                                  Lease & Operate                                Turnkey               Other
           Revenue
                                          Directional(1)                                                                                                                    IFRS
                                                                                                                                           2,797

                                                                                                                                                                                                       2,164
                          1,729                                                 1,634
                                                                                                                                 2,275
                                                                                                                                                                                            1,744
                  1,208                                              1,146

                  521                                                  488                                                        522                                                         419

                     1H 2014                                               1H 2013(2)                                                   1H 2014                                                   1H 2013(2)
           EBIT
                                          Directional(1)                                                                                                                    IFRS

                                                                                                                                              201

                                                                                                                                  316                                                                      74
                           -41
                  107                                                               -8
                                                                                                                                                                                              265
                  139                                                  177                                                        171

                                                                      -164                                                                                                                   -170
                  -288                                                                                                            -287
                                                                       -22                                                                                                                    -22

                     1H 2014                                               1H 2013(2)                                                   1H 2014                                                   1H 2013(2)
                                  (1) Directional view is a non-IFRS disclosure, which assumes all lease contracts are classified as operating leases and all vessel joint ventures are proportionally consolidated.
IR - 06/08/2014                   (2) Restated for comparison purposes.                                                                                                                                                          7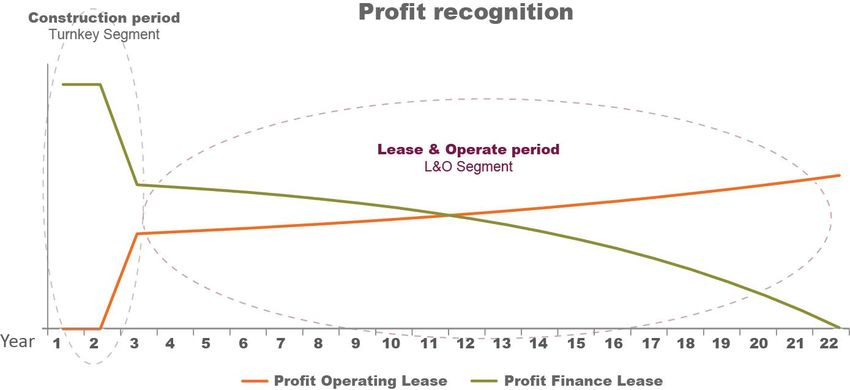
Compliance

                  • Findings of internal investigation published April 2, 2014

                  • Progress achieved in dialogue with relevant authorities

                  • Provision of US$240 million taken in 1H14 financial
                    statements

                  • More information on progress of the investigation will be
                    reported in due course

IR - 06/08/2014                                                                        8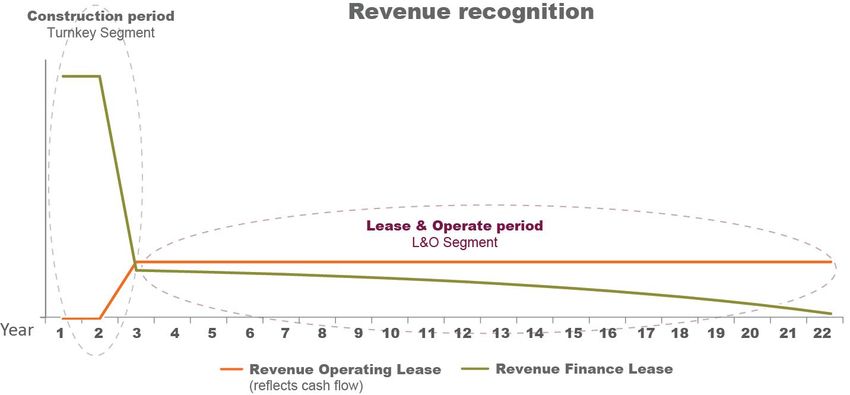
HSSE Results

   •        Two fatalities regrettably occurred                                     HSSE Results
            in 1H14
                                                                                                      0.6
   •        Recordable injury and lost time
            injury frequency improved by 35%                                                          0.5
            and 40% compared to 2013

                                                                                   Injury Frequency
   •        Potentially severe incident                                                               0.4
            frequency reduced by 80% since
            2011                                                                                      0.3

   •        Offshore GHG emissions reduced
                                                                                                      0.2
            by 20% compared to last year:
                  –   Better than industry average                                                    0.1
                      (OGP) for 1H14
                                                                                                      0.0
   •        Offshore energy consumption and
                                                                                                            2007     2008           2009           2010          2011         2012   2013    1Q     2Q
            oil discharged from produced water                                                                                                                                              2014   2014
            improved compared to last year:
                                                                                                            LTIF                                TRIF(1)                         High potential near miss
                  –   Better than industry average                                                          LTIF / quarter                      TRIF / quarter                  HPNM / quarter
                      (OGP) for 1H14
   •        No spills reportable under OGP
            (over 1 bbl) for 1H14

IR - 06/08/2014               (1) Total Recordable Injury Frequency = number of lost time injuries, restricted work and medical treatment cases per 200,000 exposure hours.                                9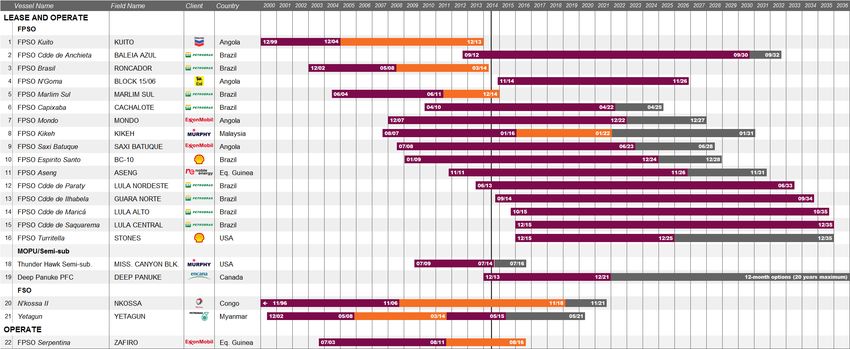
Agenda
1H 2014 Review
Macro View
1H 2014 Financials
Outlook

                     10
Enduring Appeal of Deepwater
The Next Phase of the Cycle Deepwater Project Costs
• Three key supply growth buckets Marine
Transportation
5%
U.S. Shale Oil Plateau by 2020
FPSO
Iraq Outlook uncertain
12%
Deepwater Secular growth story
• Deepwater is the most important
growth area
Subsea
– High volume of new field discoveries 41% Offshore
Drilling
– Strong portfolio of not-yet-approved 32%
projects
– Drilling dayrates off their peak Offshore
Engineering
– Robust project economics support 10%
production investment
Project emphasis on profitability, cost-control and diligent
portfolio development
IR - 06/08/2014 Source: Citi Research, July 10, 2014; Goldman Sachs, May 16, 2014. 11What’s Changed?
2000-2012 2013 & Beyond
Rapid growth in the Deepwater frontier Experience from past (complex) projects
Technology & local capabilities stretched to Improved upfront project scoping / more
the limit; poorly developed supply chain front-end engineering; avoid re-scoping
Tight offshore marine contracting market Better supply-chain capacity & management
Overly Lack of
Downward trend in Improved profitability
Playing optimistic on project
cost and timing for client &
catch-up time, effort maturation &
overruns contractor
and budget development
Slow Down to Speed Up!
IR - 06/08/2014 12FPSO Awards
Historical and Estimated Awards 2014-2015 Commentary
16 Market Estimates
• 10-14 awards per year
14 13
12 12
12 SBM’s View
10 • 12 awards in 2014 and 13 awards in 2015
10
– 8 awarded through 15/09/2014
8 7
• 17 awards remaining through the end of 2015,
6 – 11 have begun the tender phase
4 o SBM currently tendering 3 projects
– 6 projects in pre-tender phase
2
o 5 are targeted by SBM
0 Includes 4 Petrobras projects
2011 2012 2013 2014E 2015E
Targeted Lost / Declined Non-Targeted
• SBM maintains its view on award delays
Targeted Won Market Estimate
From 2011-2013, SBM won 6 of the 11 targeted FPSO awards
IR - 06/08/2014 13Pre-Award Activity
16 15
Ex: Carryover of 2
14 projects from 2010 13(1)
to 2011 (across all
project types)
12
10 10
10
8 7
6
4
2
0
2011 2012 2013 2014E 2015E
Turret ITT FPU FEED/ITT Petrobras ITT Previous Year Carryover
Apart from Petrobras tenders, generally all FEED/ITT work is
(partially) compensated
IR - 06/08/2014 (1) Petrobras ITT are Tartaruga Verde e Mestiça and Libra EPS. 14Floating Production
North America FPSO
• GOM – BP Kaskida Asia Pacific • Presalt Angola and Brazil
• GOM – BP Tiber
• CNOOC China – Liu Hua TLP/FPSO
• GOM – Anadarko Shenandoah - Semi • Mexico Deepwater
• Mexico – Pemex FPSO
• Lower Tertiary (GOM)
• East Africa
FPU (TLP/Semi)
• Leverage in-house IP &
proprietary components
• GoM, China
Brazil
Africa FLNG
• QGEP - Atlanta
• Maersk Angola – Chissonga
• 8-10 Petrobras prospects
• Cobalt Angola – Cameia
• SBM Mid-Scale solution,
• Anadarko – Wahoo
• Hess Ghana – Pecan developing the value chain
• Shell – BM-S-54
• Cobalt Angola – Orca
• Repsol – Pao de Acucar
• Statoil Tanzania – Block 1
• Asia, West & East Africa
Good FPSO prospect pipeline with niche opportunities
IR - 06/08/2014 15Turrets, Moorings & Installation
Europe/Mediterranean Large Complex Turrets
• Chevron UK – Rosebank FPSO
• Statoil Norway – Castberg FPSO
• Bespoke solutions
• Noble Israel – Leviathan FLNG • Cyclonic & frontier areas
• Harsh environment, Arctic
• Long design life
Asia Pacific Other Turret Opportunities
Americas
• Premier Falklands – Sealion FSO
• Woodside/Shell – Browse FLNG
• Standardised solutions, lower
• Exxon – Scarborough FLNG
• Inpex Indonesia – Masela FLNG complexity:
• PTT Australia – Cash Maple FLNG
– Shallow water FPSOs,
FSOs, FSRUs
Africa
• ENI Mozambique – Block 4 FLNG Offshore Installation
• In-house installation capacity
Broad portfolio of Turret prospects
B
IR - 06/08/2014 16Competitive Landscape Small Conversions – Large Conversions – 200,000 bbls / day IR - 06/08/2014 17
Agenda
1H 2014 Review
Macro View
1H 2014 Financials
Outlook

                     18
IFRS 10 & 11 – Impact Assessment
(US$ billions)
Production Units Financial Consolidation
Brazil
Old 8 9 Angola
22
Units Rest of the World
Old Out In New
5
Brazil
New 6 Angola
15
Units 9 Proportional
N’Kossa II
Saxi Batuque
Yetagun
Cdde Ilhabela
Either 100% or
Rest of the World Consolidation 0%
Mondo Cdde Paraty
N’Goma Cdde Maricá
Kikeh Cdde Saquarema
Sanha Espirito Santo
Kuito Brasil
(FY2013) Old Out In New
Revenue $ 4.8 $ (0.4) $ 0.2 $ 4.6
Assets 7.1 (0.3) 1.9 8.7
Loans 2.9 (0.2) 0.9 3.6
IR - 06/08/2014 Note: There were no changes for the accounting of MOPU Deep Panuke, Semi-sub Thunder Hawk or FPSOs Aseng, Capixaba, Cidade de Anchieta, Marlim Sul, Turritella and Serpentina. 19IFRS 10 & 11 – Directional(1) Changes
(US$ billions)
Production Units Financial Consolidation
Brazil Out
Old 8 9 Angola
22
Units Rest of the World
Old New
5
Brazil
New 8 9 Angola
22 Mostly
Units 20% Capixaba Proportional
Rest of the World Proportional No Changes
40% Aseng Consolidation
Consolidation
5
(FY2013) Old Out In New
Revenue $ 3.45 $ (0.08) $ – $ 3.37
IR - 06/08/2014 (1) Directional view is a non-IFRS disclosure, which assumes all lease contracts are classified as operating leases and all vessel joint ventures are proportionally consolidated. 20Underlying Directional(1) Performance
(US$ millions)
Directional(1) Revenue Directional(1) Gross Margin Directional(1) EBIT
1,729 352 15 337
225 184
1H 2014
-41
Reported Exceptional items Underlying Reported Exceptional items Underlying
Directional(1) Revenue Directional(1) Gross Margin Directional(1) EBIT
300 392
1,634
300 292
1H 2013(2)
92
-8
Reported Exceptional items Underlying Reported Exceptional items Underlying
(1) Directional view is a non-IFRS disclosure, which assumes all lease contracts are classified as operating leases and all vessel joint ventures are proportionally consolidated.
IR - 06/08/2014 (2) Restated for comparison purposes. 21Turnkey P&L
(US$ millions)
Directional(1)
1H 2014 1H 2013* Variance
Revenue 1,208 1,146 62
Gross Margin 199 245 (46)
EBIT 107 177 (70)
Depreciation, amortisation and impairment 7 7 –
EBITDA 114 184 (70)
* Restated for comparison purposes
Directional(1) Comments
Projects In Cidade de Maricá and Cidade de Saquarema
Projects Out OSX-2, Skarv, FRAM and Cidade de Paraty
1H13: Strong on back of successful completion of OSX-2, FRAM and Cidade de Paraty
EBIT
1H14: EBIT margin more in line with 2H13; additional overheads and investment programmes
Underlying EBIT Margin 1H13: 15.5% 2H13: 9.6% 1H14: 8.9%
IR - 06/08/2014 (1) Directional view is a non-IFRS disclosure, which assumes all lease contracts are classified as operating leases and all vessel joint ventures are proportionally consolidated. 22Lease & Operate P&L
(US$ millions)
Directional(1)
1H 2014 1H 2013* Variance
Revenue 521 488 33
Gross Margin 152 (153) 305
EBIT 139 (164) 303
Depreciation, amortisation and impairment 129 140 (11)
EBITDA 268 (24) 292
* Restated for comparison purposes
Directional(1) Comments
Vessels In Cidade de Paraty, Deep Panuke and Kikeh (Siakap North-Petai)
Vessels Out P-57, Sanha, Frade and Kuito
1H13: $300 million charges on Yme and Deep Panuke
EBIT
1H14: Reflects higher maintenance costs
Underlying EBIT Margin 1H13: 27.9% 2H13: 23.8% 1H14: 23.8%
IR - 06/08/2014 (1) Directional view is a non-IFRS disclosure, which assumes all lease contracts are classified as operating leases and all vessel joint ventures are proportionally consolidated. 23Group P&L
(US$ millions)
Directional(1)
1H 2014 1H 2013* Variance
Revenue 1,729 1,634 95
Gross Margin 352 92 260
Overheads (153) (100) (53)
Other operating income (240) – (240)
EBIT (41) (8) (33)
Depreciation, amortisation and impairment 139 147 (8)
EBITDA 98 139 (41)
Net financing costs (47) (42) (5)
Income from associated companies (16) (6) (10)
Income tax expense 6 12 (6)
Net Income attributable to shareholders (98) (44) (54)
* Restated for comparison purposes
Directional(1) Comments
Overheads See next page
Net financing cost Cidade de Paraty and Deep Panuke; amortisation of existing loans; lower avg. cost of debt
IR - 06/08/2014 (1) Directional view is a non-IFRS disclosure, which assumes all lease contracts are classified as operating leases and all vessel joint ventures are proportionally consolidated. 24Overheads Breakdown
(US$ millions)
Expense Bridge
$175
$15 $153
$150 $37
$125
$100
$100
$75
$50
$25
$0
1H 2013 One-off Items Incl. Underlying Variation 1H 2014
Improvement
Programmes(1)
Increase mostly driven by non-recurring events
IR - 06/08/2014 (1) Odyssey 24 transformation programme; investments in technology. 25Group Balance Sheet
(US$ millions)
30-Jun-14 31-Dec-13(1) Variance Comment
Property, plant and equipment 2,013 2,055 (41) Modest capex compared to depreciation
Investments in associates and other Redemption of Aseng and Cidade de
2,483 2,635 (152)
financial assets Paraty
Construction contracts 3,903 2,221 1,682 Four FPSOs under construction
Dec. ‘13 real estate disposal proceeds;
Trade receivables and other assets 1,380 1,573 (192)
mark-to-market financial instruments
Cash and cash equivalents 154 208 (54) Separate slide
Total Assets 9,933 8,692 1,241
Group and NCI results; mark-to-market;
Total equity(2) 2,917 2,887 30
equity converted in shareholder loan (NCI)
Loans and borrowings 4,456 3,608 848 Drawdown on bridge loans
Settlement provision, pension, warranty
Provisions 433 143 290
fund and others
Increase of accruals related to FPSOs
Trade payables and other liabilities 2,127 2,054 73
under construction
Total Equity and Liabilities 9,933 8,692 1,241
(1) Restated for comparison purposes.
IR - 06/08/2014 (2) Total equity includes amount attributable to non-controlling interests. 26Development of Group Cash Position
(US$ millions)
Cash Flow Bridge
$2,500
$84 -$1,430
$118 $4
$1,260 $30
$2,000
$1,500
$1,000
$554 -$602
$500
$208 -$72
$154
$0
Cash Cash from New Loans Equity Investment Other Real Estate Investments Loan Interest Cash
31-Dec-13 Operations Funding Funding Disposal OL and FL Redemption Paid 30-June-14
from Loans
Partners
IR - 06/08/2014 27Group Loans & Borrowings
(US$ millions)
1H14 vs. FY13 Debt Summary Comparison
$6,000
$5,000
$4,456
$4,000 $3,608
$3,180
$3,000 $2,632
$2,000
$1,000
$0
1H14 1H14 FY13 FY13
IFRS Proportional IFRS Proportional
Bridge Loans Revolving Credit Other Project Finance
IR - 06/08/2014 28Directional(1) Backlog
(US$ billions)
US$ 21.5 bn
(as of June 30, 2014)
1H14 Revenue
Lease & Operate Backlog
Remaining Backlog
1.5
1.0
0.5
0.0
$19.4 bn
2016
2014
2015
2016
2017
2018
2019
2020
2021
2022
2023
2024
2025
2026
2027
2028
2029
2030
2031
2032
2033
2034
2035
2036
Turnkey Backlog 1H14 Revenue
Remaining Backlog
3.0
2.0
1.0
0.0
2014 2015 2016
$2.1 bn
Lease & Operate
L&O Average Portfolio Duration: 14.7 years(2)
Turnkey
(1) Directional view is a non-IFRS disclosure, which assumes all lease contracts are classified as operating leases and all vessel joint ventures are proportionally consolidated.
IR - 06/08/2014 (2) Assumes the exercise of all lease extensions. 29Funding
• Undrawn Credit Facilities + Cash = US$1,093 mn
• Deep Panuke: US$400 mn bridge to USPP
• Cidade de Maricá project finance: US$1.45 bn
• Average cost of debt: 1H14 4.2% vs. FY13 5.3%
IR - 06/08/2014 30Financial Ratios
(US$ millions)
30-Jun-14 31-Dec-13(1) Change Comment
Bridge loan for Cidade de Maricá, Cidade
Debt 4,456 3,608 24%
de Saquarema and Deep Panuke
Cash 154 208 -26% Separate slide
Increased debt load for projects under
Net Debt 4,302 3,400 27%
construction
Total Equity 2,917 2,887 1% 1H14 results and NCI shareholder loan
Increased debt load and equity impacted
Net Debt : Equity 147% 118% 2,900bps
by $240 mn settlement provision
Increased balance sheet and stable
Solvency Ratio 27.5% 30.2% 270bps
equity because of settlement provision
The Company remains firmly within its covenants
IR - 06/08/2014 (1) Restated for comparison purposes, except for the Solvency Ratio. 31Agenda
1H 2014 Review
Macro View
1H 2014 Financials
Outlook
32Scheduled for Delivery
• Vessel arrived at offshore site in
Angola
• Lifting campaign completed at
Paenal
• Delivery expected in 3Q14
FPSO N’Goma (12 year L&O contract)
• Topside integration completed at
Brasa yard
• Vessel has left the quayside
• Delivery expected in 4Q14
Cidade de Ilhabela
IR - 06/08/2014 (20 year L&O contract) 33Project Overview
Project 2011 2012 2013 2014 2015 2016 POC
Type(1) 30/06/14 Percentage
of Completion
FPSO N’Goma FLFloating Solutions
Current: Focus on top-end segment
• FPSOs
• Turret Moorings
• Turnkey Sale or Lease & Operate
Future: Leverage core competencies
• Floating LNG (FLNG)
• Semisubmersible & TLP production units
IR - 06/08/2014 352014 Guidance
• Directional(1) Revenue guidance confidently reiterated:
US$3.3 billion
Turnkey: US$2.3 billion
Lease & Operate: US$1.0 billion
• As the market develops, the Company will adapt
accordingly
Demand-driven management of fixed cost structure
Further develop core competencies to position SBM for
the market upturn
IR - 06/08/2014 (1) Directional view is a non-IFRS disclosure, which assumes all lease contracts are classified as operating leases and all vessel joint ventures are proportionally consolidated. 36Appendix
© SBM Offshore 2014. All rights reserved. www.sbmoffshore.com
37IFRS 10 & 11 – JV Accounting
• IFRS 10 & 11 consolidation standards for joint ventures (JVs) introduced
January 1, 2014
• Ends proportional accounting of JVs
Full consolidation of fully controlled JVs (mostly Brazilian FPSOs)
Equity accounting of jointly controlled JVs (mostly Angolan FPSOs)
• IFRS Balance Sheet impacts:
Inclusion of JVs partner’s share in relatively young Brazilian fleet
Disappearance of most of the African assets and loans
Total asset value increased by approximately US$1.6 billion
Net debt increased from US$2.7 billion to US$3.4 billion
• Limited impact on IFRS Revenue and almost nil to net income attributable to
shareholders
• 2013 Pro-forma financial statements provided with 1H 2014 earnings release
IR - 06/08/2014 38IFRS 10 & 11 – Directional(1) Impact
• New IFRS 10 & 11 eliminates the revenue SBM generates in the project
phase from its JV partners in investees fully consolidated (Brazil)
• Consequently, Directional(1) reporting from 2014 onwards will not only
classify all leases as operating leases but:
Will be based on proportional consolidation of all Lease & Operate
contracts
• The impact on Directional(1) Revenue and results will be very limited:
FPSOs Aseng (60% SBM Share) and Capixaba (80% SBM share)
previously fully consolidated will now be proportionally consolidated
2013 Directional(1) negative impact of US$72 million on revenue and
US$35 million on EBIT
IR - 06/08/2014 (1) Directional view is a non-IFRS disclosure, which assumes all lease contracts are classified as operating leases and all vessel joint ventures are proportionally consolidated. 39IFRS 10 & 11
Lease
New Old
Joint Ventures Contract SBM Share % New IFRS Old IFRS
Directional(1) Directional(1)
Type
FPSO N’Goma FL 50% Proportional Proportional Equity Proportional
FPSO Saxi Batuque FL 50% Proportional Proportional Equity Proportional
FPSO Mondo FL 50% Proportional Proportional Equity Proportional
FPSO Cdde de Ilhabela FL 62.25% Proportional Proportional Full consolidation Proportional
FPSO Cdde de Maricá FL 56% Proportional Proportional Full consolidation Proportional
FPSO Aseng FL 60% Proportional Full consolidation Full consolidation Full consolidation
FPSO Cdde de Paraty FL 50.5% Proportional Proportional Full consolidation Proportional
FPSO Cdde de Saquarema FL 56% Proportional Proportional Full consolidation Proportional
FPSO Kikeh(2) FL 49% Proportional Proportional Equity Proportional
FPSO Capixaba OL 80% Proportional Full consolidation Full consolidation Full consolidation
FPSO Espirito Santo OL 51% Proportional Proportional Full consolidation Proportional
FPSO Brasil OL 51% Proportional Proportional Full consolidation Proportional
Yetagun OL 75% Proportional Proportional Full consolidation Proportional
N’kossa II OL 50% Proportional Proportional Equity Proportional
Note: Deep Panuke, Thunder Hawk and FPSOs Turritella, Cidade de Anchieta,
and Marlim Sul are fully owned by SBM therefore fully consolidated
(1) Directional view is a non-IFRS disclosure, which assumes all lease contracts are classified as operating leases and all vessel joint ventures are proportionally consolidated.
IR - 06/08/2014 (2) Kikeh lease classification changed from OL to FL effective 1Q14. 40Group Loans & Borrowings
(US$ millions)
Net Book Value as of 30 June 2014
Proportional
Full Amount IFRS
(Business Ownership)
PROJECT FINANCE FACILITIES DRAWN
FPSO Capixaba relocation $ 119 $ 119 $ 95
FPSO Kikeh 33 – 16
FPSO Espirito Santo 136 136 69
FPSO Aseng 172 172 103
FPSO Cidade de Paraty 923 923 466
Normand Installer 66 – 33
FPSO Cidade de Anchieta 460 460 460
FPSO Cidade de Ilhabela 1,017 1,017 633
FPSO N’Goma 523 – 262
BRIDGE LOANS
Bilateral credit facilities (Maricá and Saquarema) 445 445 445
Bilateral credit facilities (Deep Panuke) 400 400 400
REVOLVING CREDIT FACILITY
Revolving credit facility 128 128 128
OTHER
Other long-term debt 655 655 70
Net book value of loans and borrowings $ 5,077 $ 4,456 $ 3,180
IR - 06/08/2014 41Project Direction – Context
• SBM Offshore seeking to provide analysts and investors with clarity on
business performance above and beyond statutory IFRS disclosure
• SBM Offshore’s business model combines turnkey sales, construction and
lease and operate projects, making it a challenge to model
• IFRS finance lease accounting adds complexity by separating revenue
recognition from cash flows
• IFRS accelerates recognition of revenues, profit and equity well before any
rents are paid by client
• Increasing number of contracts classified as finance leases, with IASB
intention to make all leases finance leases
• In this context, SBM Offshore is extending its reporting to a non-GAAP
operating lease presentation more in line with operating cash flows…
• …leading to increased transparency and understanding of SBM Offshore’s
performance…
• …through disclosure of Directional(1) Backlog and a Directional(1) Income
Statement as part of the Financial Review
IR - 06/08/2014 (1) Directional view is a non-IFRS disclosure, which assumes all lease contracts are classified as operating leases and all vessel joint ventures are proportionally consolidated. 42Operating Lease vs Finance Lease IR - 06/08/2014 43
Operating Lease vs Finance Lease

IR - 06/08/2014                                      44
Directional(1) – The Way Forward
• Turnkey segment becomes a pure construction business.
Revenue and Gross Margin consist of:
Direct sales contracts (FPSO OSX 2, Turrets for Prelude, Quad 204
and Ichthys)
Sales to JV partners (FPSO Cidade de Ilhabela, FPSO N’Goma,
FPSO Cidade de Maricá and Saquarema)
• Lease and Operate segment becomes a pure long-term cash
business. Revenue and Gross Margin consist of SBM’s share of
Lease and Operate contracts (Bareboat + OPEX)
• 2013 transition period to promote Directional(1) Reporting as the
main indicator for company performance and variance analysis
• 2014 guidance based on Directional(1) results
IR - 06/08/2014 45SBM Lease Fleet Portfolio
L&O Portfolio Average Duration: 14.7 years(1)
Initial Lease Period Confirmed Extension Contractual Extension Option
IR - 06/08/2014 (1) Assumes the exercise of all lease extensions. 46© SBM Offshore 2014. All rights reserved. www.sbmoffshore.com © SBM Offshore 2014. All rights reserved. www.sbmoffshore.com
47You can also read