Vincom Retail Joint Stock Company 2Q2020 Performance
←
→
Page content transcription
If your browser does not render page correctly, please read the page content below

Vincom Retail Joint Stock Company
             2Q2020 Performance

                           28 July 2020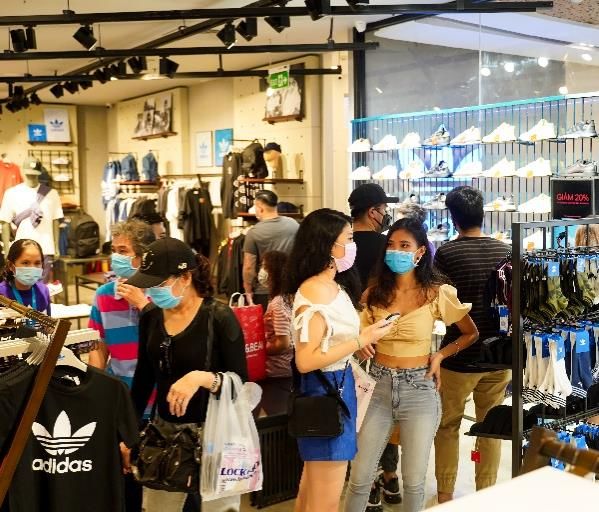
Disclaimer
IMPORTANT: The information contained herein is preliminary and subject to change without notice, its accuracy is not
guaranteed, has not been independently verified and may not contain all material information concerning Vincom Retail
Joint Stock Company (the “Company”) and its subsidiaries (the “Group”). You should not rely upon it or use it to form the
basis for any investment decision or commitment whatsoever.

None of the Company, its shareholders, or any of their respective affiliates, directors, officers, employees, agents, advisers
or any other person makes any representation or warranty (express or implied) or accepts any responsibility or liability for
the accuracy or completeness of this presentation or any or all of the information in this presentation or otherwise made
available. It is not the intention to provide, and you may not rely on these materials as providing, a complete or
comprehensive analysis of the financial or trading position or prospects of the Group. No part of this presentation shall form
the basis of or be relied upon in connection with any contract or commitment whatsoever. Further, nothing in this
presentation should be construed as constituting legal, business, tax or financial advice. You should conduct such
independent investigations and analysis of the Group as you deem necessary or appropriate in order to make an
independent determination of the suitability, merits and consequences of investment in the Company.

This presentation contains “forward-looking statements”. These forward-looking statements involve known and unknown
risks and uncertainties, many of which are beyond the Company’s control and all of which are based on management’s
current beliefs and expectations about future events. Forward-looking statements are sometimes identified by the use of
forward-looking terminology such as “believe”, “expects”, “may”, “will”, “could”, “should”, “shall”, “risk”, “intends”,
“estimates”, “aims”, “targets”, “plans”, “predicts”, “continues”, “assumes”, “positioned” or “anticipates” or the negative
thereof, other variations thereon or comparable terminology. These forward-looking statements include all matters that are
not historical facts. Forward-looking statements are not guarantees of future performance. These forward-looking
statements speak only as at the date of this presentation, and none of the company, its shareholders, or any of their
respective affiliates, directors, officers, employees, agents, advisers or any other person undertakes to update or revise any
forward-looking statements as a result of new information or to reflect future events or circumstances.

                                                                                                                                 2
                                                            Confidential
1. Key Highlights

Financial Performance – 2Q2020 and 1H2020
                                     Pro-forma 1H2020 leasing revenue excluding Covid impact would have increased 11% YoY

 Revenue from Leasing                                                                                                           Gross Profit

 2Q2020: VND1,307 billion                                                     9.8% QoQ                                          2Q2020: VND646 billion                                                       14.9% QoQ
                                                                              21.2% YoY                                                                                                                      32.7% YoY
 1H2020: VND2,756 billion                                                     15.4% YoY                                         1H2020: VND1,405 billion                                                      27.3% YoY

                                        (1)
 Leasing NOI                                                                                                                    EBITDA

 2Q2020: VND931 billion                                                        6.3% QoQ                                         2Q2020: VND910 billion                                                        14.8% QoQ
                                                                               18.9% YoY                                                                                                                      26.9% YoY
 1H2020: VND1,924 billion                                                      16.6% YoY                                        1H2020: VND1,978 billion                                                      19.1% YoY

Impact of Covid-19
 Indicator                                                                                                                    March                                        April                                        May

 Average occupancy/ month                                                                                                     83.6%                                       84.0%                                       83.7%
                                              (2)
 Effective occupancy / month                                                                                                  64.0%                                       27.0%                                       80.0%

 Impact of Covid-19                                                                                                          (19.0%)                                     (57.0%)                                      (3.0%)
Note: Based on VAS Consolidated Financial Statements for 2Q2020
(1) NOI for leasing investment properties and rendering of related services is calculated by taking total income from leasing activities and from other property-related services less any property-related operating expenses
      which include land lease costs but exclude management expenses allocated from parent company
(2) Effective occupancy takes into consideration the operational NLA instead of leased NLA during the lockdown period in April 2020

                                                                                                                                                                                                                                 4
                                                                                                                 Confidential
Key Operational Metrics
Retail GFA                                                                                                              Occupancy rate
                                                                                                                                                              Change
(‘000 sqm)                                1H2019                    1H2020                 Change (%)                                       1H2019   1H2020
                                                                                                                                                               (ppts)

                                                                                                                         Vincom Center      90.0%    92.3%       2.3

Vincom Center                                280                        280                          -                   Vincom Mega Mall   90.6%    87.4%       3.2

                                                                                                                         Vincom Plaza       88.6%    82.3%       6.3

                              (1)
Vincom Mega Mall                             395                        388                        1.8                   Vincom+            85.2%    76.2%       9.0

                                                                                                                         Total              89.2%    85.0%       4.2

                                                                                                                                                              Change
Vincom Plaza                                 766                        858                      12.0                                       1Q2020   2Q2020
                                                                                                                                                               (ppts)

                                                                                                                         Vincom Center      92.1%    92.5%       0.4

                                                                                                                         Vincom Mega Mall   87.6%    87.2%       0.4
Vincom+                                       63                         72                      15.0
                                                                                                                         Vincom Plaza       82.2%    82.5%       0.3

                                                                                                                         Vincom+            76.5%    76.0%       0.5

Total                                       1,503                     1,598                        6.2                   Total              84.9%    85.0%       0.1

Note: As at 30 June 2020
(1) Due to re-categorizing some shop-offices from Investment Property to Inventory for sales as such area was outright sales

                                                                                                                                                                        5
                                                                                                             Confidential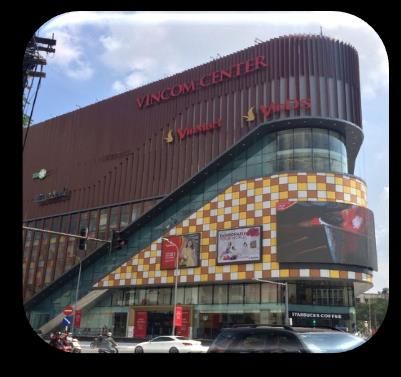
Tenants Recovery After Covid-19
1 Footfall
Phases Hanoi malls HCMC malls
% effective Footfall as % % effective Footfall as %
operation (1) of pre Covid (2)
operation of pre Covid
Phase 1: Relaxed social distancing (23 April – 8 May) 87% 60% 85% 45%
Phase 2: Entertainment industry reopened (9 May – 31 May) 98% 85% 95% 65%
Phase 3: All stores reopened and activities resumed (1 June – 30 June) 100% 95% 100% 75%
2 Tenants’ sales as % of 2019 sales
F&B Fashion Entertainment Cinema
91.0% 96.0%
74.0% 78.0%
56.0%
22.0% 25.0%
14.0% 17.0% 13.0%
4.0% 0.0%
Apr-20 May-20 Jun-20 Apr-20 May-20 Jun-20 Apr-20 May-20 Jun-20 Apr-20 May-20 Jun-20
Good recovery in Hanoi and Good recovery in Hanoi and Relatively more impacted sector Most impacted sector
HCMC HCMC Good recovery in Hanoi and Gradual recovery in Hanoi and
HCMC HCMC
3 Support initiative Supported tenants with VND 675bn package
Note: As at 30 June 2020
(1) Operational NLA as % of leased NLA
(2) Pre-Covid level is defined as the different periods between 1 and 31 Jan 2020
6
Confidential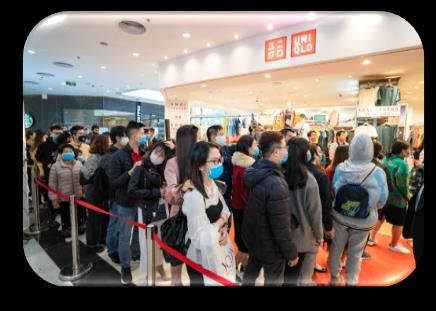
Vincom Pham Ngoc Thach – New Shopping and Entertainment
Destination in Hanoi
Revamp initiatives and results Pre and post renovation
Renovation was from June 2019 to Mar 2020 Footfall growth Before After
Internal and external renovation: YoY change (%)
49.0% 51.0%
External renovation with golden theme
color
Addition of big LED screen for
positioning and advertising purpose
May-20 Jun-20
Upgrade tenant mix with major brands:
Fashion: UNIQLO Tenant sales
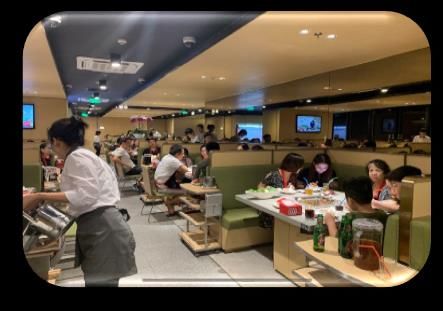
F&B: Haidilao Hot Pot, Pizza 4P’s, YoY change (%)
Marukame Udon, Koi Thé 76.0% 75.0%
Cosmetics: Innisfree
Target customers:
Modern and active young generation,
middle income customers
May-20 Jun-20
Upgraded Tenant mix
Uniqlo Koi Thé Haidilao Hot Pot Pizza 4P’s
7
Confidential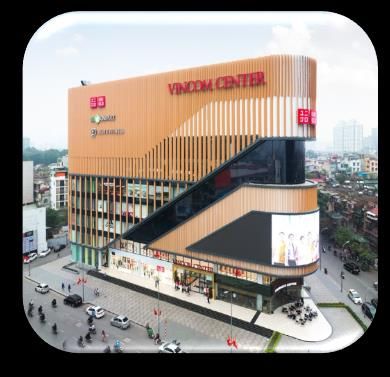
Solidified Position As Dominant Retail Platform In Vietnam
Distinguished retail formats and focused on wide range of lifestyle oriented consumers
Prime Urban and High Growth Areas in Key Cities Unique Multi-Format Retail Model
(Segmentation by GFA)
Vincom Mega Mall
Vincom Center Location: In integrated, mixed-use projects
43 79 ~1.6mm Location: City-center, CBD Retail GFA: 60,000 – 150,000+ sqm
No. of Malls: 3
Cities/ Operational Retail GFA: 40,000 – 60,000 sqm
Retail GFA No. of Malls: 7 Total GFA: 388,082 sqm
Provinces Malls (sqm) Total GFA: 280,026 sqm
VCC
Key Cities 18%
North Vietnam (ex. Hanoi) VC+ VMM
19 Vincom Malls 24%
5%
16 Vincom Plazas
3 Vincom+
Hanoi
10 Vincom Malls
5 Vincom Centers VCP
2 Vincom Mega Malls Central Vietnam 53%
20 Vincom Malls
3 Vincom Plazas
13 Vincom Plazas Vincom Plaza
Vincom+ Location: High-density, CDB of cities
7 Vincom+ Location: Medium-density, non-CBD ex. Hanoi and HCMC
Ho Chi Minh City Retail GFA: 3,000 – 5,000 sqm Retail GFA: 10,000 – 40,000 sqm
13 Vincom Malls No. of Malls: 15 No. of Malls: 54
South Vietnam (ex. HCMC) Total GFA: 71,936 sqm Total GFA: 857,517 sqm
2 Vincom Center
1 Vincom Mega Mall 17 Vincom Malls
7 Vincom Plazas 15 Vincom Plazas
3 Vincom+ 2 Vincom+ Proven and scalable
4 retail
retail development
formats
platform
Note: As at 30 June 2020
8
Confidential
2. Market Update
Vietnam Races Ahead of Its Regional Peers Amidst Covid-19
Vietnam Experienced The Shortest Lockdown Regionally Vietnam’s Retail Sales Grew Healthily As Compared to Its Counterparts
# of weeks 2Q2020 Nominal retail sales chg, YoY %
Malaysia 24 weeks 8.4%
Thailand 19 weeks 0.4%
Hong Kong SAR 17 weeks (1.0%) (1.5%)
(6.1%)
Mainland China 16 weeks (11.6%)
Philippines 10 weeks (20.8%)
Singapore 8 weeks (32.4%)
Indonesia 8 weeks (40.2%)
Vietnam 3 weeks Vietnam China Australia South Indonesia Japan Thailand Hong Singapore
(mainland) Korea Kong SAR
Jan Feb Mar Apr May Jun Jul Aug Sep
High Domestic Consumption Growth Signals Lower Reliance on
International Trade Fastest Growing Economy in Southeast Asia Pre and Post Covid-19
Growth YoY(%) Real GDP growth (%)
7.2% 6.7%
5.5% 6.2%
5.1%
4.0% 3.9% 4.4%
3.3% 3.6% 3.0%
1.7% 1.5% 2.2%
1.4%
0.4% 0.0%
(1.0%)
(2.0%) (2.2)%
(3.4%)
(3.9)% (3.9%) (4.2)%
(5.5%) (5.6)%
(6.2)% (6.2)%
(9.4%) (10.9)%
Vietnam Indonesia Malaysia Thailand Philippines Singapore Vietnam Philippines Thailand Indonesia Singapore Malaysia
2019 2020F Pre Covid-19 Post Covid-19 2Q2020
Source: : CBRE Research (APAC report 1H2020), FactSet, Fitch Solutions, EIU
10
ConfidentialVietnam’s Economic Outlook Remains Resilient Going Forward
(1) (2)
Vietnam Experiences Faster Footfall Recovery amongst its Peers Retail leasing enquiry still shows positive trend during the pandemic
Visit to Retail Space (% of Pre-Covid level)
100
Mobility level before Covid-19
No. of Leasing Enquiry Index
100% 90
Vietnam 80
(W1 March = 100)
80% 70
Thailand
60
60% Malaysia
50
Singapore 40
40% 30
Philippines
20
20% 10
0
0% W2 W3 W4 W5 W6 W7 W8 W9 W10 W11 W12 W13 W14 W15 W16 W17 W18
1-Apr 15-Apr 29-Apr 13-May 27-May 10-Jun 24-Jun 10-Jul Mar Apr May Jun
High NLA Supply in Vietnam Signifies Strong Potential Upside in Future
Rental Outlook Remains Stable Regionally with One of The Lowest Decline Development
900,000 Hanoi and HCMC
5%
800,000
Future Supply (sqm NLA)
0% 700,000
(5%) 600,000
(10%) 500,000
(15%) 400,000
300,000
(20%)
Hong Kong SAR
Melbourne
Guangzhou
Taipei
Singapore
HCMC
Auckland
Beijing
Shanghai
Sydney
Perth
Shenzhen
Brisbane
Hanoi
200,000
100,000
-
2017 2018 2019 2020F 2021F
Hong Kong Hanoi HCMC Singapore Bangkok
2020F (As of Apr) Q-o-Q Change in Retail Rents in Q1 2020
Source: CBRE Research (APAC report 1H2020 and HCMC Market Outlook 2Q2020)
Note:
(1) Visit to retail space compared with pre Covid level. The baseline for prior outbreak is the median value for the corresponding day of the week during the 5 week period Jan 3 – Feb 6, 2020
(2) Leasing enquiries collected by CBRE Vietnam in Hanoi & HCMC between March and June 2020
11
ConfidentialDomestic Market Overview 2Q2020
Hanoi HCMC
Current
NLA 9.7%
5.4%
1.05m 1.00m
sqm sqm
94.6%
90.3%
CBD Non CBD
USD/sqm/mo. USD/sqm/mo.
Rent and 150.0 20% 150.0 20%
vacancy
rate 120.0 16% 120.0 16%
90.0 12% 90.0 12%
60.0 8% 60.0 8%
Rent rate, 30.0 4% 30.0 4%
Occupancy - 0% - 0%
2Q19 1Q20 2Q20
in Hanoi, 2Q19 1Q20 2Q20
HCMC(1)
Rent (CBD) Rent (Non CBD) Vacancy rate (CBD) Vacancy rate (Non CBD)
Asking rent in 2Q2020 is more stable in CBD compared to 1Q, 2.5 – 3.8% increase YoY, gaining momentum from end of 2019.
Non-CBD areas saw slight decrease of 0.7-0.9% in rental rate
Occupancy rate in 2Q2020 is stable in CBD, mostly decline in non-CBD, larger reduction in HCMC than Hanoi (5.2% vs. 1.63%)
compared to 1Q2020
Source: CBRE Hanoi and HCMC Forum, Market Insights reports 1H2020 12
Confidential3. Operational Update
Business Highlight 2Q2020 – Recovery Post-Pandemic
                                                                                                    2Q2020: Finished                   2 June: Haidilao               5 June: UNIQLO
                                   26 May: 2020 AGM of
                                                                                                    go-live CRM/FM                     opened for the first           opened at VCC
      Events                       Vincom Retail
                                                                                                    phase 1                            time in Hanoi at VCC           Landmark 81
                                                                                                                                       Pham Ngoc Thach

                                    70% has been leased, of which all anchor tenants have been secured

  Leasing                                                                                                                       Popular international
                                       Leading
 plan VMM                           international
                                                                        International fashion portfolio with                        F&B chain
 Ocean Park                        fashion chain
                                                                           leading and popular brands

                  Secured chain tenants in                                                                                                  New Tenants
                  Vincom malls in 2Q2020
                      +3 projects                                    +3 projects                         Popular international brand         Japan home appliances retailer
   Fashion +3,700 sqm                             Fashion
                                                                     +5,300 sqm

                                                                                                                                             Japan's largest pharmacy-cosmetics store
              Popular international                                  +5 projects
                                                                                                                                             chain for the first time in Vietnam – secured
                  F&B chain                                          +4,600 sqm
                                                                                                                                             and expected to open in Aug 2020 at VCC
                                                                                                                                             Dong Khoi
                                                                     +4 projects
                                                                     +2,800 sqm
                                                                                                                                             Area dedicated to experience and promote
                       Bookstore chain                               +6 projects                                                             Korean culture and products – secured
                       Tan Viet                                      +8,300 sqm                                                              2,500 sqm

Note: name of some tenants are censored as they are finalizing their contracts with Vincom Retail
                                                                                                                                                                                             14
                                                                                                                 Confidential
Marketing Activities in 2Q2020
After social distancing measures were lifted at the end of April 2020, several marketing activities were successfully launched
to welcome back customers to the malls
Reunification Day & Labor Day Campaign (30 Apr – 3 May) Summer Campaign 2020 (1 – 14 June 2020)
Safe Shopping – Plenty Promotions Glorious Summer – Plenty Happiness
• Vincom implemented safety measures which allows • Creative Rainbow Land Festival offered playing
customers to meet up and shop comfortably area for children to stimulate creativity and
interaction, and encouraged reading habits during
• Customers enjoyed exclusive offers and promotions from the summer
retail stores
• Customers enjoyed exclusive offers and latest
• Social media contest “Come to Vincom – Hunt Good Deals” summer collections from famous brands
boosted customers’ demand with discount up to 80%
Footfall 52% 23%
Compared with before social distance Compared with before the campaign
Media
reach ~ 23 million ~ 82 million
15
Confidential3Q2020 Plan
Sales
1 Large international tenants in Chain tenants in negotiation to expand
Finalize key discussion
and anchor
tenants
following chain Leading Popular Vincom Retail is in negotiation with multiple
Popular home
development fashion beauty fashion, F&B, entertainment chains and
appliances
strategy. chain brand health/beauty brands who express their
retailer
Expected to interest to expand their network in Vincom
accomplish at +7 projects +1 project +5 projects retail malls
end of 3Q2020 +15,000 sqm +2,000 sqm
2
Continue
leasing plan for
Vincom Mega
Malls Ocean
Park, Smart
City and Grand
Park VMM Ocean Park: Launch in November VMM Smart City: Finalize and secure all key
tenants / anchor tenants; commence fit-out
Note: name of some tenants are censored as they are finalizing their contracts with Vincom Retail
16
Confidential3Q2020 Plan (cont.)
Marketing
Red Sale 2020 2020 Mid-autumn Festival Independence Day Campaign
Co-operate with Ministry of Industry and August: Prepare to launch Mid-Autumn 2 Sep: Celebrates Vietnam Independence
Trade to hold “Vincom 2020 Red Sale” (4 Festival campaign with large decoration Day with promotions and entertainment
– 12 July 2020) with slogan “Proudly Red activities, highlight events, and gifts for activities for customers
– Search For Gold Promotions”, being part families
of Vietnam Grand Sale launched
nationwide in July offering up to
100% discounts
Roadshow – free double decker trip to Vincom malls
Mid autumn festival (2019) Independence Day campaign (2019)
in Hanoi and HCMC (2020)
Technology
Initiate CRM Phase 2 Select contractors
Manage marketing activities; manage retail leasing space on Digital Twins Develop Vincom Retail’s website/app
software; develop “Tenant Portal” to complete entire CRM system
17
Confidential4. Financial Update
Financial Performance in 2Q2020 vs 2Q2019
 Figures in VND billion                           2Q2019             2Q2020            YoY (%)                  Commentary              QoQ (%)              Commentary

                                                                                                 -   Issue additional VND375 billion
                                                                                                                                                  -   Slightly higher support
                                                                                                     (USD16.3m) of support package
                                                                                                                                                      compared to 1Q
 Leasing of Investment                                                                               for tenants
                                                                                                                                                  -   Decreased ancillary revenue,
 Properties and Rendering of                       1,659              1,307             21.2     -   Decreased ancillary revenue,         9.8
                                                                                                                                                      including utilities revenue and
 Related Services                                                                                    including utilities revenue and
                                                                                                                                                      parking during mandatory
                                                                                                     parking during mandatory
                                                                                                                                                      lockdown
                                                                                                     lockdown

 Sale of Inventory Properties                        302                294              2.4                                             46.6

 Other revenue                                       22                  29             32.6                                             18.1

 Total Revenue                                     1,983              1,630             17.8                                              3.3

                                                                                                 -   Revenue reduction from Covid
                                                                                                     impact, partially offset by cost
 Gross Profit(1)                                     959                646             32.7                                             14.8     Same reason
                                                                                                     reduction, albeit at a smaller
                                                                                                     degree

 Operating Profit / (Loss)                           788                467             40.7                                             18.8

 Profit / (Loss) before Tax                          788                446             43.4                                             28.0

 Profit / (Loss) after Tax for the
                                                     640                343             46.4                                             30.3
 Period

 Profit / (Loss) after Tax and
                                                     639                343             46.3                                             30.3
 Minority Interest

Note: VAS Consolidated Financial Statements for 2Q2020
(1) Gross profit already subtracted D&A relating to investment properties under VAS.

                                                                                                                                                                                        19
                                                                                                 Confidential
Financial Performance in 1H2020 vs 1H2019
Figures in VND billion 1H2019 1H2020 Change (%) Commentary
In 1H2020 VRE issued a supporting package of VND675bn
Leasing of Investment
(USD29.3m) for tenants affected by Covid-19. Ancillary
Properties and Rendering of 3,258 2,756 15.4
revenue from utilities and parking also decreased ~ VND
Related Services
42bn in 2Q due to lockdown
In 1H2019, VRE delivered more units in a big project
Sale of Inventory Properties 903 495 45.2
Shophouse Ca Mau
Entertainment business and operation of Condotel Da Nang
Other revenue 105 65 38.5
were heavily impacted by Covid-19
Total Revenue 4,267 3,316 22.3
Revenue reduction from Covid impact, partially offset by cost
Gross Profit(1) 1,931 1,405 27.3
reduction, albeit at a smaller degree
Operating Profit / (Loss) 1,559 1,043 33.1
Profit / (Loss) before Tax 1,566 1,065 32.0
Profit / (Loss) after Tax for
1,251 835 33.2
the Period
Profit / (Loss) after Tax
1,251 835 33.3
and Minority Interest
Note: VAS Consolidated Financial Statements for 2Q2020
(1) Gross profit already subtracted D&A relating to investment properties under VAS.
20
ConfidentialFinancial Performance
(1)
Total Revenue Gross Profit
VNDbn VNDbn
Gross Profit Margin (%)
50.8% 39.9% 47.6% 45.3% 42.4%
9,124 9,259
4,404
185 215
2,027 3,641 735
3,433 (47)
5,518 2,801 806
112 4,267 48 1,931
951 411
3,316 (39) 1,405
105
7,017 903 3,752 (84) 269
495 65 2,882 (96)
5,506 245
4,455 2,342
3,258 2,756 1,701
1,255
2017 2018 2019 1H2019 1H2020 2017 2018 2019 1H2019 1H2020
Leasing of Investment Properties Sale of Inventory Properties Other revenue Leasing of Investment Properties Sale of Inventory Properties Other revenue
Depreciation & amortization of investment properties (VNDbn)
829 1,042 1,331 676 675
(2)
Leasing Net Operating Income (NOI) Profit After Tax and Minority Interest
VNDbn VNDbn
Leasing NOI Margin (%)
69.3% 69.5% 70.6% 70.9% 69.9%
2,851
4,955 2,404
3,829 1,905
3,089
2,306 1,251
1,924
835
2017 2018 2019 1H2019 1H2020 2017 2018 2019 1H2019 1H2020
Note: Based on VAS Audited Consolidated Financial Statements for respective years and VAS Consolidated Financial Statements for 2Q2020
(1) Depreciation and amortization relating to investment properties is below the graph and should be added back (to Gross Profit) under IFRS. Since 2018, “Other” segment includes results from management of Da Nang condotels
which was incurring loss as the property was still ramping up after launch in May 2018.
(2) NOI for leasing investment properties and rendering of related services is calculated by taking total income from leasing activities and from other property-related services less any property-related operating expenses which
include land lease costs but exclude management expenses allocated from parent company.
21
ConfidentialBalance Sheet
Total Assets Total Borrowings, Cash and Cash Equivalents
VNDbn VNDbn
5,974
38,133 38,684 38,761
35,839
10,423 4,095 4,170
10,911 7,121 3,804
16,652
3,133
2,780 2,785
2,177
27,773 28,718 28,338
21,481
(2)
31-Dec-17 31-Dec-18 31-Dec-19 (2) 30-Jun-20 31-Dec-17 31-Dec-18 31-Dec-19 30-Jun-20
(1) Total Borrowings Cash and Cash Equivalents
Investment Properties and Investment Properties Under Construction Other Assets
Total Equity (Net Debt / (Net Cash))(3) / Equity
VNDbn VNDbn
28,509
26,094 26,954 27,789 7.2%
2.3%
Net cash Net cash
(2)
31-Dec-17 31-Dec-18 31-Dec-19 30-Jun-20
31-Dec-17 31-Dec-18 31-Dec-19 (2) 30-Jun-20
Note: Based on VAS Audited Consolidated Financial Statements for respective years and VAS Consolidated Financial Statements for 2Q2020
(1) Investment Properties and Investment Properties Under Construction (IP/IPUC) are valued at development cost minus depreciation and amortization and are not fair valued
(2) Decline in other assets, cash and cash equivalents, total equity as well as increase in gearing ratio as of 31 December 2019 was due to the payment of cash dividends of VND 2,445bn in June 2019 and buy back 56.5 mil
treasury shares completed in December 2019
(3) Net Debt / (Cash) = (Short-term Borrowings + Long-term Borrowings) – (Cash & Cash Equivalents + ST Investments).
22
ConfidentialAppendix
Bridging VAS to IFRS
                                                                                                                                                                            Unit: VND Billion
                                                               VAS                   Adj.             IFRS                            Commentary on Adjustments
                                                              1H2020                                 1H2020
Leasing revenue and other related                                                                                  Realized unearned revenue of deposit from customer in relation to
                                                                2,756                 66                   2,822
services                                                                                                           amortization of deposit
Sale of inventory properties                                     495                                       495
Other revenue                                                     65                                        65
Total revenue                                                   3,316                 66                   3,382
Cost of leasing activities and other related
                                                               (1,501)               679                   (822)   Mostly depreciation of malls included in VAS; excluded under IFRS
services
Cost of inventory properties sold                               (250)                                  (250)
Others                                                          (160)                                  (160)
Cost of goods & services                                       (1,911)               679              (1,232)
Gross profit                                                    1,405                745               2,149
                                                                                                                   Gain in fair valuation of the investment properties and investment
Gain/loss from recording FV of IP/IPUC                                              1,629              1,629       properties under construction (“IP/IPUCs”) based on management’s
                                                                                                                   estimate as of 30 June 2020
Selling expenses                                                (105)                                  (105)
General and administrative expenses                             (182)                 36               (146)       Amortization of goodwill included in VAS; excluded under IFRS
Other income                                                       27                                       27
Other expense                                                     (5)                                      (5)
Finance expense                                                 (179)               (172)                  (351)   Amortization of deposit from customer
Finance income                                                   105                 (16)                   89     Amortisation of deposit under BCC and deposit from customer
Profit before tax                                               1,065               2,222                  3,287
Tax expense                                                     (230)               (460)              (690)       Mainly deferred tax arising from fair value adjustment of IP/IPUC
    Note: Based on VAS Consolidated Financial Statements for 2Q2020 and conversion to IFRS by management
Profit after tax                                                 835                1,762              2,598

                                                                                                                                                                                          24
                                                                                                    Confidential
THANK YOU!
You can also read