Generalizing multistain immunohistochemistry tissue segmentation using one-shot color deconvolution deep neural networks
←
→
Page content transcription
If your browser does not render page correctly, please read the page content below
Generalizing multistain immunohistochemistry tissue
                                         segmentation using one-shot color deconvolution deep
                                                           neural networks

                                                 Amal Lahiani1,3 , Jacob Gildenblat2 , Irina Klaman1 , Nassir Navab3 , and Eldad Klaiman1
arXiv:1805.06958v3 [cs.CV] 22 Sep 2018

                                             1
                                           Pathology and Tissue Analytics, Pharma Research and Early Development, Roche Innovation
                                                                                    Center Munich
                                                                               2
                                                                                 SagivTech LTD., Israel
                                                3
                                                  Computer Aided Medical Procedures, Technische Universität München, Germany
                                         {amal.lahiani, irina.klaman, eldad.klaiman}@roche.com, jacob@sagivtech.com, navab@cs.tum.edu

                                         1

                                                                                        Abstract
                                                    A key challenge in cancer immunotherapy biomarker research is quantification of
                                                    pattern changes in microscopic whole slide images of tumor biopsies. Different
                                                    cell types tend to migrate into various tissue compartments and form variable
                                                    distribution patterns. Drug development requires correlative analysis of various
                                                    biomarkers in and between the tissue compartments. To enable that, tissue slides are
                                                    manually annotated by expert pathologists. Manual annotation of tissue slides is a
                                                    labor intensive, tedious and error-prone task. Automation of this annotation process
                                                    can improve accuracy and consistency while reducing workload and cost in a way
                                                    that will positively influence drug development efforts. In this paper we present a
                                                    novel one-shot color deconvolution deep learning method to automatically segment
                                                    and annotate digitized slide images with multiple stainings into compartments of
                                                    tumor, healthy tissue, and necrosis. We address the task in the context of drug
                                                    development where multiple stains, tissue and tumor types exist and look into
                                                    solutions for generalizations over these image populations.

                                         1       Introduction
                                         Recent studies in digital pathology have shown significant advancement in automatic tumor detection
                                         in clinical diagnostic scenarios (Wang et al. [1], Liu et al. [2]). However, the unique requirements for
                                         research and drug development are not addressed in most of these studies. This is because typically,
                                         in a clinical diagnostic environment, the tasks are limited to a single staining, typically Hematoxylin
                                         and Eosin (H&E) stained slides, from a specific hospital lab and containing one kind of tissue with
                                         a specific cancer type (e.g. Metastases in breast) (Wang et al. [1], Liu et al. [2]). In the context of
                                         drug development, and specifically in the development of immunotherapy drugs, the samples are
                                         much more variable. Slides are typically stained in at least 3 different Immunohistochemistry (IHC)
                                         staining methods with different stain types and colors in addition to the traditional H&E. Moreover,
                                         the slides originate from different hospital centers around the globe which can lead to variability in the
                                         fixation and state of the specimens due to varying collection techniques. It is also common to have 5-6
                                         cancer types in a clinical trial and biopsies or surgical specimen may come from various body organs.
                                         Manual annotation of tissue slides is a time consuming and poorly-reproducible task, especially when
                                            1
                                              This work has been submitted to the IEEE for possible publication. Copyright may be transferred without
                                         notice, after which this version may no longer be accessible.

                                         Preprint. Work in progress.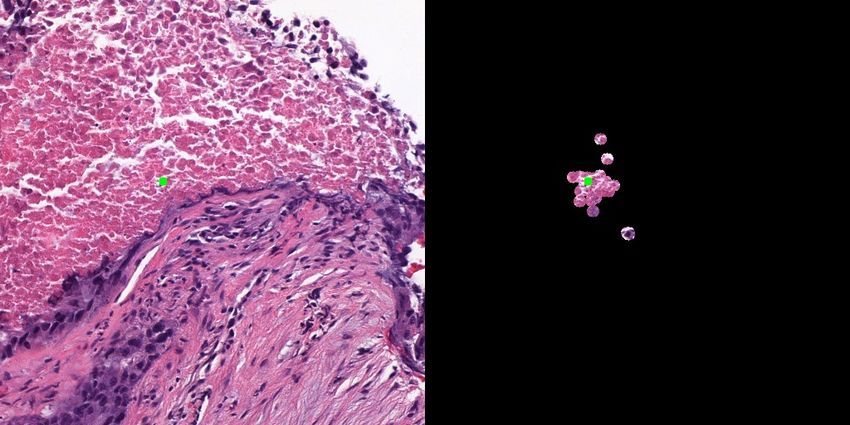
Figure 1: Example tiles from the dataset and their respective label images colored green, red, yellow,
black and white corresponding to the different tissue regions of tissue, tumor, necrosis and background
and exclude respectively.

dealing with images scanned under high magnification and containing billions of pixels. Previous
studies have shown that pathologist concordance in the manual analysis of slides suffers from a
relatively high inter and intra user variability (Veta et al. [3], Bhargava and Madabhushi [4], Meyer
et al. [5]) mainly due to the large size of the images. Automation of this annotation process can
improve the accuracy and consistency while reducing workload and cost in a way that will positively
influence drug development efforts and will assist pathologists in the time consuming operation of
manual segmentation. In the recent years, deep learning methods have been used with great success in
several domains, including computer vision (Russakovsky et al. [6], Krizhevsky [7], Geiger et al. [8]),
sometimes surpassing human capabilities on tasks such as classification performed on specific data
sets. Motivated by the success of applying deep learning based approaches to image segmentation
tasks (Badrinarayanan et al. [9]), we investigate the possibility of applying deep learning based
algorithms for automatic tissue segmentation.
In the next sections of this paper, we describe the main building blocks used for our automatic tissue
segmentation algorithm including a deep learning network for segmentation of a highly unbalanced
dataset with 4 categories, a methodology for addressing the dataset and its high variability (9 stain
types were included in our experiments), a one-shot color deconvolution deep learning network
architecture and visualization techniques for understanding the algorithm results and gaining trust
from pathologists to use the system.

2   Dataset

We selected 77 whole slide images of Colorectal Carcinoma metastases in liver tissue from biopsy
slides stained with H&E (blue,pink) and 8 additional immunohistochemistry (IHC) assays stains
as follows: CEA (brown), CD163/CD68 (brown, red), CD8/CD3 (brown, red), FoxP3 (brown),
Ki67/CD3 (brown, red), Ki67/CD8 (purple, yellow), PRF/CD3 (brown, red), PD1 (brown). All these
IHC stainings use a blue (Hematoxylin) counterstain. The selection was done according to the most
frequent stainings. These 77 slides compose our dataset for this project. We then split this dataset
into training (51 slides) and testing (26 slides) sets. The various regions on the slides were annotated
with one of the following categories: "Tissue" - i.e. normal tissue, "Tumor", "Necrosis" - i.e. dead
tissue, and "Exclude" - i.e. areas not to be used due to irrelevance, artifacts, etc. Areas not included
in any of the above categories is labeled "Background".
Each high resolution whole slide image was split into overlapping 512 × 512 × 3 RGB tiles for
processing at a 10x magnification factor (half the original scanning resolution). The selection of a
lower resolution was needed to increase the contextual information when classifying a given tissue
pixel. The memory bound on the compute hardware limits the size of the input images to the network
and therefore, in order to have enough tissue context for a limited tile size in the image dataset, we
opted for the reduced magnification. Other studies have also found 10x magnification to be sufficient
for tissue segmentation tasks (Wang et al. [1], Liu et al. [2]). For each image tile a corresponding
ground truth tile was created using the region annotations of the pathologist. This process yielded
16834 512 × 512 × 3 RGB tiles and their corresponding 512 × 512 × 1 ground truth tiles. A sample
of these tiles can be seen in figure 1.
Different biopsies contain variable amounts of background, tumor, tissue and necrosis. Thus, the
generated dataset contained an inherent imbalance of the classes (58%, 19%, 16% and 7% for
background, tumor, tissue and necrosis respectively). Such class imbalances can significantly hinder
the learning process in deep learning. To address the high class imbalance we use a loss weighting
strategy called median frequency balancing (Eigen and Fergus [10]).

                                                   2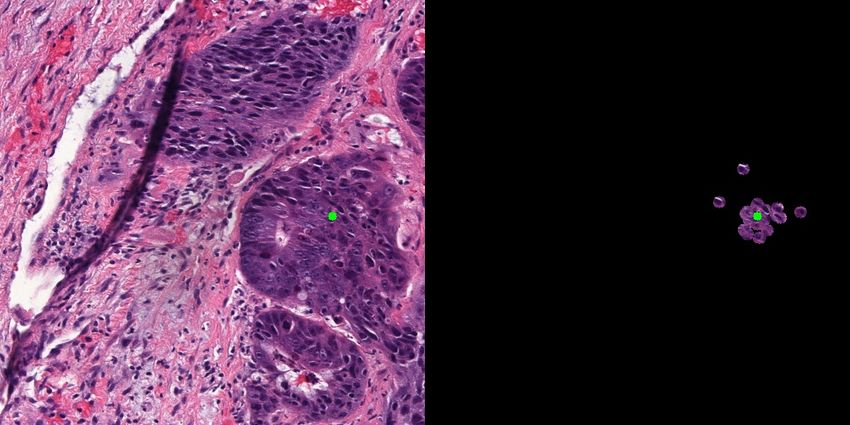
Figure 2: Evolution of validation F1 scores during training. The black, red, green and yellow
curves correspond to background, tumor, tissue and necrosis respectively. The dotted and solid lines
correspond to validation scores of UNET during training for a single stain (H&E) and a multistain
dataset respectively.

In order to increase the amount of labeled data for training the network, we used data augmentation
techniques including hue, brightness and scale jittering, adding uniform noise to the intensity channel,
random occlusion, image flips and random but small affine transforms.

3     Methodology and results

This section describes our methodology, the neural network used for the tissue segmentation task and
the results we obtained. The input images are BGR 512 × 512 images scaled to the range [0, 1], and
the outputs are 512 × 512 × 4 images, where each pixel contains a vector of four probabilities for
that pixel for each class. The loss function is the average of the cross entropy loss, across the image
at the output from the network. The loss of pixels marked to be ignored, were given a zero weight.
The optimization step was done with the SGD optimizer (Bottou [11]) with a momentum of 0.9. To
accelerate the network training on multiple GPUs, the Synchronous SGD algorithm (Das et al. [12])
was used, using 15 GPUs on the Roche Pharma HPC cluster in Penzberg and a total batch size of
240 (16 per GPU). The base learning rate of the SGD optimizer was multiplied by the number of the
GPUs used, where 0.001 was the default learning rate for 1 GPU. We used the distributed module
in PyTorch (Paszke et al. [13]) for implementing the distributed training, which was crucial for fast
experimenting on large quantities of data. During training, 10% of the training data was reserved for
validation. As an evaluation metric we used the F1 score to account for both precision and recall.

3.1   UNET with a single staining vs UNET with multiple stainings

In the development of the network architecture we initially examined the results of a segmentation
network from previous research: UNET fully convolutional network (Ronneberger et al. [14]). We
trained UNET with 2 different datasets: The first dataset contains only one specific staining (H&E)
and the second dataset contains different staining types (H&E and 8 IHCs). We noticed that validation
F1 scores of the different classes converge smoothly during training after 200 epochs in the case of
the single stain dataset while they did not converge smoothly or to the same levels during the same
training period in the case of the multiple staining dataset. This difference is most strongly expressed
for the classes of necrosis and background. Figure 2 shows validation F1 scores for the different
classes during the 200 epochs of training with both datasets. The validation and the calculation of the
scores were performed every 10 epochs.
Evaluation of the networks’ performance on the testing dataset showed increased generalization
capabilities for the single stain dataset compared to the multistain dataset (Table 1). For a fair
comparison, we evaluated both networks on exactly the same testing set image using only H&E
images from the testing set.

                                                   3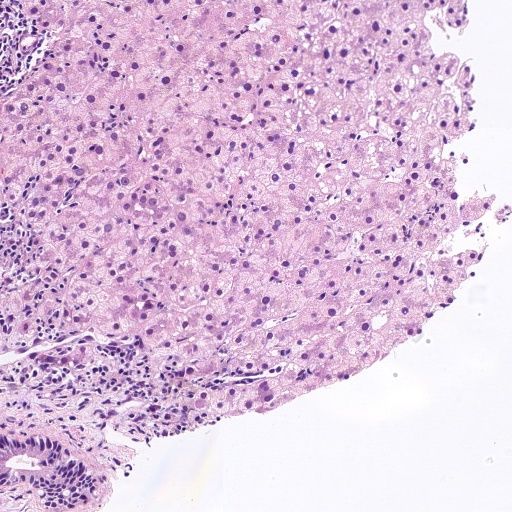
Table 1: Testing F1 scores for each of the categories: multiple stain and H&E only
                                   Background Tumor Tissue Necrosis
                       Multistain    0.63            0.20       0.78      0.44
                       H&E only      0.99            0.85       0.71      0.88

3.2   Network architecture: CD-UNET

These results made us theorize that images of slides with multiple stainings in the training dataset
make it harder to learn the correct features of the different classes due to increased dataset and
intra-class variability. Additionally, when multiple stainings are available, it is preferred to train a
single model that will perform well on all stainings rather than multiple models (i.e. for each specific
stain) in order to avoid the need for storing multiple models. A combined dataset with multiple
stainings also has the advantage of making the training dataset larger and more comprehensive thus
potentially also reducing overfitting. Still, the slower convergence during training and the lower
generalization present challenges that need to be dealt with.
One way of limiting the detrimental effect of stain variability on training which has been described
in previous studies is using the concentration of stains as network input instead of the RGB pixel
values. Color deconvolution has been used on histology images as a pre-processing step showing
improved segmentation and classification results (Sirinukunwattana et al. [15], Kainz et al. [16], Aliaa
A.A Youssif Abeer Saad Gawish [17], Chen and Chefd’Hotel [18]). However, stain deconvolution
is generally subjective and depends on stain bases. In the context of drug development, staining
procedures, colors and quality may vary for different reasons such as lab processes, imaging scanners
and staining protocols. In Duggal et al. [19] a stain separation layer was added to the network as
part of a binary cell classification framework, however a pre-processing step to estimate the optical
density from the raw image was used. In addition, their method is heavily dependent on the parameter
initialisation of the stain separation layer. This filter initialisation was based on stain parameters
making it subjective and limited to the use of a single staining. In our case the training dataset
comprises multiple stainings making the approach problematic to use.
We propose addressing these problems by the addition of an inherent color deconvolution segment to
the UNET architecture. In our approach, the color deconvolution parameters are learned as part of
the segmentation network without the need to pre-process the images, making it ideal in the case of
training on a multistain dataset. We then eliminate the need to run a separate pre-processing color
deconvolution step for each different stain type and make both training and inference simpler. To
the best of our knowledge, this is the first work where a color deconvolution estimation, applicable
to different stainings, was learned inherently as part of a segmentation network without the need to
pre-define the stain basis parameters.
The proposed architecture has two additional (1 × 1) convolution layers preceding the original UNET
segmentation network. As the training dataset is composed of different stainings, the number of
principle color shades in the training images was 6: pink, blue, purple, brown, yellow and red. We
chose then the first layer to have 6 (1 × 1) filters, each filter corresponding to a color. The second
layer contains 3 (1 × 1) filters so as not to change the original UNET architecture input size.
Many of state of the art stain separation methods are based on Beer-Lambert’s law using the optical
density space (Li and Plataniotis [20], Ruifrok and Johnston [21], Xu et al. [22]). According to this
law, the optical density is defined as OD = log10 ( II0t ) = εLC where OD is the optical density, I0 is
the intensity of the incident light, It is the intensity of the light after passing through the specimen, ε
is the absorption coefficient, C is the concentration of the absorbing substance, and L is the thickness
of the specimen. This law states then that the observed pixel intensity It varies non-linearly with the
concentration of staining. In order to allow the color deconvolution segment to learn this non-linearity
of the physical model, each of the (1 × 1) convolution layers is followed by a nonlinear function.
The proposed color deconvolution network architecture (CD-UNET) is composed of 2 main parts
(Figure 3). The first part is a color deconvolution segment composed of 2 layers of (1 × 1) convolution
with ReLU and batch normalization. The second part is a UNET fully convolutional network
(Ronneberger et al. [14])resulting in a pixel wise segmentation of the input image. We additionally

                                                    4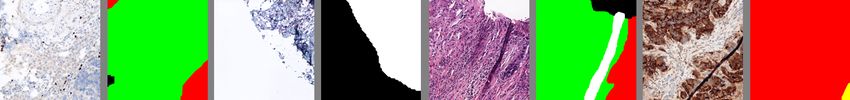
Figure 3: The proposed CD-UNET architecture.

Figure 4: Validation F1 scores for the different categories during 200 epochs of training. The dotted
and solid lines correspond to UNET and CD-UNET respectively.

modified the original UNET architecture as follows. First, we used an appropriate size of zero padding
in all convolution layers to preserve the spatial size of the input to the layers. The result is that both
the input and the output spatial dimensions of the network are 512 × 512. We also considered a
smaller network width: each layer has half the number of filters compared to the original UNET
network. This helped speeding up the learning process and reduce overfitting. In addition, batch
normalization (Ioffe and Szegedy [23]) was applied after every convolutional layer.

3.3   CD-UNET vs UNET

In this experiment we compare the learning and performance of UNET to CD-UNET. We trained
UNET and CD-UNET for 200 epochs on the same multistain dataset and computed F1 scores for
the different classes on a validation set every 10 epochs. The validation F1 scores converge faster
and more smoothly on this dataset for the CD-UNET architecture compared to the original UNET
architecture (Figure 4).
After 200 epochs of training, we evaluated the performance of both networks on a test set of 26
unseen whole slide images. The testing dataset consists of slides from the stain types that were
present in the training dataset. To ensure a fair comparison, we used the same training and testing
datasets for both networks. The F1 scores of the test set are listed in Table 2.
F1 scores on the testing set were remarkably higher with CD-UNET and convergence of F1 scores
during training was quicker and smoother. This shows better generalization capabilities and faster

            Table 2: Testing F1 scores for each of the categories : UNET and CD-UNET
                                    Background Tumor Tissue Necrosis
                      UNET           0.92               0.52   0.89       0.60
                      CD-UNET        0.99               0.88   0.90       0.80

                                                    5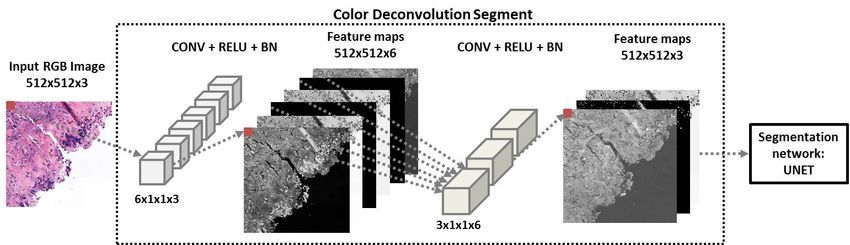
(a)             (b)              (c)              (d)               (e)              (f)
Figure 5: Examples of CD-UNET segmentation output of two images from the testing set. (a), (b) and
(c) correspond to the original image, ground truth and corresponding segmentation result respectively
of a CD163/CD68 slide. (d), (e) and (f) correspond to the same images for a CD8/KI67 slide.

Figure 6: Activation maximization of the filters of the first layer. The obtained images correspond to
different stain colors. The white image corresponds to the background color.

learning over multistain images for the CD-UNET architecture compared with the original UNET
architecture.

3.4     Segmentation results: CD-UNET

Figure 5 shows some example results of the trained segmentation network on two differently stained
slides.

4     Tools for understanding the network

Visualizing and understanding network decisions is especially important in the medical field where
medical experts need to understand algorithm decisions in order to trust the results of automated
analysis. For this purpose we visualize and highlight pixels in the image that were significant for the
network’s output (often termed attribution) as well as the features learned by the network (Olah et al.
[24], Yosinski et al. [25], Nguyen et al. [26, 27]). We also visualize outputs of specific layers.

4.1     Color deconvolution segment visualization

The visualization of filters and feature maps has been one of the most prominent tools used in
deep learning in order to facilitate the understanding of the network decisions (Zeiler and Fergus
[28], Krizhevsky et al. [29]). In order to visualize the effect of the color deconvolution segment on
input images, we apply activation maximization to the filters of the first layer. Then we show some
examples of the color deconvolution segment feature maps on different stainings.

4.1.1    Activation maximization of the first layer filters

This approach allowed us to generate synthetic images that maximally activate the response of the
first layer filters (Mahendran and Vedaldi [30]). A noise image is inserted to the network, and several
iterations of gradient ascent are run in order to modify the input image pixels to maximize the
response of each of the filters. Figure 6 shows the images we obtained following this approach. We
notice that the resulted images correspond to stain colors from the training dataset.

                                                  6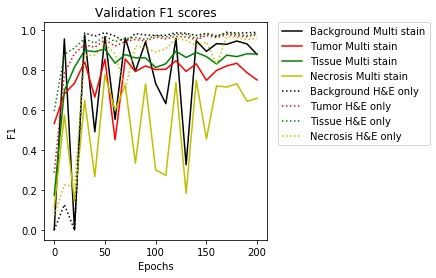
(a) (b) (c) (d)
Figure 7: Example of the output of the color deconvolution segment on an H&E image: (a) Original
image (b) First output of the segment: corresponds to the hematoxylin channel (blue cells) (c) Second
output of the segment: corresponds the the eosin channel (pink connective tissue) (d) Third output:
corresponds to the background in this case.
(a) Tumor (b) Tissue (c) Necrosis
Figure 8: (a), (b) and (c) correspond to synthetic images that maximize the scores for tumor, tissue
and necrosis respectively.
4.1.2 Color deconvolution segment output
In order to demonstrate the effect of the color deconvolution segment, we visualize its outputs using
different stains (H&E and IHC). Figure 7 shows an example of an input image and its corresponding
outputs from the color deconvolution segment of the network.
4.2 Feature visualization and pixel attribution
For feature visualization we used the approach of Simonyan et al. [31]. A noise image is inserted
to the network, a specific pixel and category in the network output is set as the target, and several
iterations of gradient ascent are run in order to modify the input image pixels to receive a high value
in the target pixel. Using this we can create examples of input images, that cause a high activation at
the target pixel for each of the categories (Figure 8). An interesting observation is that the area of the
pixels in the input image that affect an output pixel (the effective receptive field) is different for the
three categories. The tissue category score is maximized when there are tissue cell nuclei far from
the target pixel, implying that patterns of multiple tissue cell nuclei around the target pixel are used
by the network as clues of tissue presence. The tumor and necrosis categories on the other hand seem
to look for patterns of condensed large distorted cell nuclei around the target pixel. The synthetic
image for tissue shows regular cell structures in the center but also far from the center meaning that
patterns of cells around the target pixel were used by the network in order to make the decision.
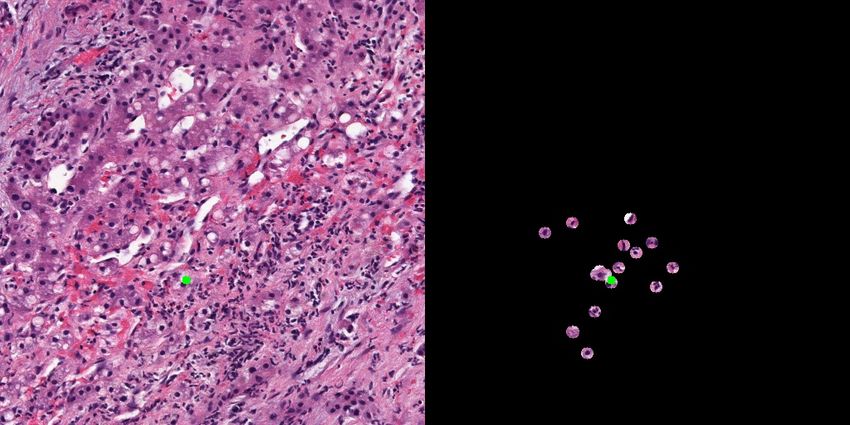
For pixel attribution we used the SmoothGrad technique (Smilkov et al. [32]), and averaged the
gradients of the category score with respect to noisy input image pixels. The gradient image was
passed to a ReLU gate, to keep only positive gradients. The gradient image is then thresholded, and
input image pixels that had gradients below the threshold were masked out, to keep only pixels that
were important for the network decision. A repeating theme in the visualizations was that for normal
7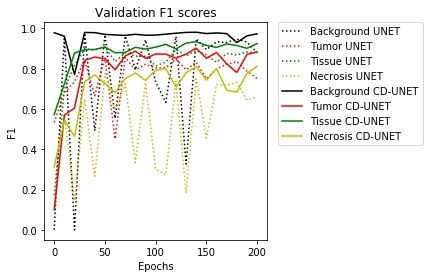
(a) Tumor                          (b) Tissue                         (c) Necrosis
Figure 9: (a), (b) and (c) correspond to SmoothGrad results for a tumor, a tissue and a necrosis pixel
respectively. The target pixel is marked by the green circle.

tissue and tumor, the gradients highlight respectively healthy looking and tumor cell nuclei in the
target pixel surroundings, while ignoring other texture. Another important observation is that the
effective receptive field was different between the different categories. The tissue category has a large
effective receptive field compared to tumor and necrosis, which is in harmony with the interpretation
of the synthetic images maximizing the scores of the classes. Figure 9 corresponds to the gradient
images of the different categories.

5   Discussion and conclusions

Computerized segmentation of different tissue compartments has the advantage of being faster, less
expensive, less laborious and more accurate and objective than manual segmentation traditionally
performed by expert pathologists. Using expert annotated slides in order to teach an automatic
segmentation model has the additional value of reusing expensive annotations and biopsy slide
images to generate additional value. In the context of drug development, multiple IHC stains are used.
To the best of our knowledge, this is the first work where multiple stains were simultaneously used in
order to train a unified segmentation model that deals with multi stain histopathology images. Our
experiments proved a higher difficulty in training the network for the more complex task of multistain
image segmentation compared to the one stain scenario. Our interpretation was that the increased
variability of the input image colors presented an additional complexity for the network and made the
training process more difficult and erratic.
Several state of the art methods used stain normalization as a pre-processing step (Albarqouni et al.
[33], Khan et al. [34, 35]) in order to reduce color variability in the input space and improve segmen-
tation and classification performance on different datasets. Other methods use color deconvolution as
a pre-processing step. However, state of the art color deconvolution methods are highly dependent on
the choice of a reference image, which is a very subjective and stain dependent task. Some methods
suggested to include a stain separation layer as part of the network architecture (Duggal et al. [19]).
However, they show that their method is highly dependent on filter initialization, which should follow
stain basis vectors. Their architecture is also based on the assumption that only a single stain is used.
In our case, different stains (H&E and 8 IHCs) were used, and more stains are periodically added to
our slide processing. In addition, defining stains reference vectors is a laborious and subjective task.
We therefore present a method for generalizing tissue segmentation over multiple stainings by adding
a color deconvolution segment to the segmentation network architecture. The parameters of this
segment are optimized during the regular learning process in a "one-shot" training scheme. Adding
the color deconvolution segment to UNET substantially improved the convergence smoothness and
speed of the network when training on a multistain dataset. Generalization is also substantially
improved, as can be seen by the network performance on the testing set. We theorize that this segment
allows the network to deal with the variation of the input in the first color deconvolution layers and
leaves the "rest" of the network with a much easier task to learn. The visualization of the outputs of
the color deconvolution segment using different stainings as inputs shows the added layers actually
learned to separate between different stain channels for the different stain types.
In order to enable understanding of the network architecture, we visualize synthetic images that
maximize the scores of the different classes as well as different gradient images. This allowed us to
see the effective receptive field that the network needs in order to make a decision for a specific pixel
as well as to see what kinds of eigen-images make the network predict a specific label.

                                                   8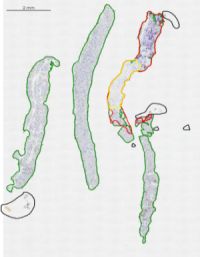
We plan to continue investigating the effects of color deconvolution segments in other deep learning
architectures and for additional digital pathology tasks, e.g. cell detection and classification. Addi-
tional variance capturing segments could be designed to help reducing dataset complexities from
other sources, like different tumor and tissue types in order to facilitate inference when image sources
are not known or when staining or imaging quality is suboptimal.

Acknowledgments
The authors would like to thank and acknowledge the following people:

      • Dr. Chen Sagiv for her detailed review of the text and valuable recommendations.
      • Ben Levy for his valuable insights and code contributions.
      • Dr. Shadi Albarqouny for his insights and fruitful discussions.
      • Dr. Oliver Grimm for his trust and guidance.
      • Dr. Fabien Gaire for his vision and continued support.

References
 [1] Dayong Wang, Aditya Khosla, Rishab Gargeya, Humayun Irshad, and Andrew H. Beck. Deep
     learning for identifying metastatic breast cancer. CoRR, abs/1606.05718, 2016. URL http:
     //dblp.uni-trier.de/db/journals/corr/corr1606.html#WangKGIB16.

 [2] Yun Liu, Krishna Gadepalli, Mohammad Norouzi, George E. Dahl, Timo Kohlberger, Aleksey
     Boyko, Subhashini Venugopalan, Aleksei Timofeev, Philip Q. Nelson, Gregory S. Corrado,
     Jason D. Hipp, Lily Peng, and Martin C. Stumpe. Detecting cancer metastases on gigapixel
     pathology images. CoRR, abs/1703.02442, 2017. URL http://dblp.uni-trier.de/db/
     journals/corr/corr1703.html#LiuGNDKBVTNCHPS17.

 [3] Mitko Veta, Josien P. W. Pluim, Paul J. van Diest, and Max A. Viergever. Corrections to
     "breast cancer histopathology image analysis: A review". IEEE Trans. Biomed. Engineering,
     61(11):2819, 2014. URL http://dblp.uni-trier.de/db/journals/tbe/tbe61.html#
     VetaPDV14a.

 [4] Rohit Bhargava and Anant Madabhushi. Emerging themes in image informatics and molecular
     analysis for digital pathology. Annual review of biomedical engineering, 18:387–412, 2016 Jul
     11 2016. ISSN 1545-4274. doi: 10.1146/annurev-bioeng-112415-114722.

 [5] John Meyer, Consuelo Alvarez, Clara Milikowski, Neal Olson, Irma Russo, Jose Russo, Andrew
     Glass, Barbara A Zehnbauer, Karen Lister, and Reza Parwaresch. Breast carcinoma malignancy
     grading by bloom-richardson system vs proliferation index: reproducibility of grade and
     advantages of proliferation index. Modern Pathology, 18, 2005. URL http://dx.doi.org/
     10.1038/modpathol.3800388.

 [6] Olga Russakovsky, Jia Deng, Hao Su, Jonathan Krause, Sanjeev Satheesh, Sean Ma, Zhiheng
     Huang, Andrej Karpathy, Aditya Khosla, Michael S. Bernstein, Alexander C. Berg, and Fei-Fei
     Li. Imagenet large scale visual recognition challenge. International Journal of Computer Vision,
     115(3):211–252, 2015. URL http://dblp.uni-trier.de/db/journals/ijcv/ijcv115.
     html#RussakovskyDSKS15.

 [7] Alex Krizhevsky. Learning multiple layers of features from tiny images. University of Toronto,
     05 2012.

 [8] Andreas Geiger, Philip Lenz, Christoph Stiller, and Raquel Urtasun. Vision meets robotics: The
     kitti dataset. I. J. Robotics Res., 32(11):1231–1237, 2013. URL http://dblp.uni-trier.
     de/db/journals/ijrr/ijrr32.html#GeigerLSU13.

 [9] Vijay Badrinarayanan, Alex Kendall, and Roberto Cipolla. Segnet: A deep convolutional
     encoder-decoder architecture for image segmentation. CoRR, abs/1511.00561, 2015. URL http:
     //dblp.uni-trier.de/db/journals/corr/corr1511.html#BadrinarayananK15.

                                                   9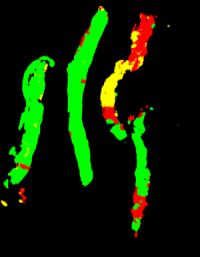
[10] David Eigen and Rob Fergus. Predicting depth, surface normals and semantic labels with a
     common multi-scale convolutional architecture. CoRR, abs/1411.4734, 2014. URL http:
     //dblp.uni-trier.de/db/journals/corr/corr1411.html#EigenF14.
[11] Léon Bottou. Stochastic gradient learning in neural networks. In In Proceedings of Neuro-Nîmes.
     EC2, 1991.
[12] Dipankar Das, Sasikanth Avancha, Dheevatsa Mudigere, Karthikeyan Vaidyanathan, Srinivas
     Sridharan, Dhiraj D. Kalamkar, Bharat Kaul, and Pradeep Dubey. Distributed deep learning
     using synchronous stochastic gradient descent. CoRR, abs/1602.06709, 2016. URL http:
     //dblp.uni-trier.de/db/journals/corr/corr1602.html#0002AMVSKKD16.
[13] Adam Paszke, Sam Gross, Soumith Chintala, and Gregory Chanan. Pytorch, 2017.
[14] Olaf Ronneberger, Philipp Fischer, and Thomas Brox. U-net: Convolutional networks
     for biomedical image segmentation. CoRR, abs/1505.04597, 2015. URL http://dblp.
     uni-trier.de/db/journals/corr/corr1505.html#RonnebergerFB15.
[15] Korsuk Sirinukunwattana, Shan e Ahmed Raza, Yee-Wah Tsang, David R. J. Snead, Ian A.
     Cree, and Nasir M. Rajpoot. Locality sensitive deep learning for detection and classifica-
     tion of nuclei in routine colon cancer histology images. IEEE Trans. Med. Imaging, 35(5):
     1196–1206, 2016. URL http://dblp.uni-trier.de/db/journals/tmi/tmi35.html#
     Sirinukunwattana16.
[16] Philipp Kainz, Michael Pfeiffer, and Martin Urschler.     Semantic segmentation of
     colon glands with deep convolutional neural networks and total variation segmentation.
     CoRR, abs/1511.06919, 2015. URL http://dblp.uni-trier.de/db/journals/corr/
     corr1511.html#KainzPU15.
[17] Mohammed Elsaid Moussa Aliaa A.A Youssif Abeer Saad Gawish. Automated Periodontal
     Diseases Classification System. International Journal of Advanced Computer Science and
     Applications(IJACSA), 3(1), 2012. URL http://ijacsa.thesai.org/.
[18] Ting Chen and Christophe Chefd’Hotel. Deep learning based automatic immune cell detection
     for immunohistochemistry images. In Guorong Wu, Daoqiang Zhang, and Luping Zhou,
     editors, MLMI, volume 8679 of Lecture Notes in Computer Science, pages 17–24. Springer,
     2014. ISBN 978-3-319-10580-2. URL http://dblp.uni-trier.de/db/conf/miccai/
     mlmi2014.html#ChenC14.
[19] Rahul Duggal, Anubha Gupta, Ritu Gupta, and Pramit Mallick. Sd-layer: Stain decon-
     volutional layer for cnns in medical microscopic imaging. In Maxime Descoteaux, Lena
     Maier-Hein, Alfred M. Franz, Pierre Jannin, D. Louis Collins, and Simon Duchesne, editors,
     MICCAI (3), volume 10435 of Lecture Notes in Computer Science, pages 435–443. Springer,
     2017. ISBN 978-3-319-66179-7. URL http://dblp.uni-trier.de/db/conf/miccai/
     miccai2017-3.html#DuggalGGM17.
[20] Xingyu Li and Konstantinos N. Plataniotis. A complete color normalization approach to
     histopathology images using color cues computed from saturation-weighted statistics. IEEE
     Trans. Biomed. Engineering, 62(7):1862–1873, 2015. URL http://dblp.uni-trier.de/
     db/journals/tbe/tbe62.html#LiP15.
[21] Arnout Ruifrok and Dennis Johnston. Quantification of histochemical staining by color decon-
     volution. Analytical and quantitative cytology and histology, 23, 08 2001.
[22] Jun Xu, Lei Xiang, Guanhao Wang, Shridar Ganesan, Michael D. Feldman, Natalie N. C. Shih,
     Hannah Gilmore, and Anant Madabhushi. Sparse non-negative matrix factorization (snmf)
     based color unmixing for breast histopathological image analysis. Comp. Med. Imag. and
     Graph., 46:20–29, 2015. URL http://dblp.uni-trier.de/db/journals/cmig/cmig46.
     html#0005XWGFSGM15.
[23] Sergey Ioffe and Christian Szegedy. Batch normalization: Accelerating deep network training
     by reducing internal covariate shift. CoRR, abs/1502.03167, 2015. URL http://dblp.
     uni-trier.de/db/journals/corr/corr1502.html#IoffeS15.

                                                10
[24] Chris Olah, Alexander Mordvintsev, and Ludwig Schubert. Feature visualization. Distill, 2
(11), November 2017. doi: 10.23915/distill.00007. URL https://doi.org/10.23915%
2Fdistill.00007.
[25] Jason Yosinski, Jeff Clune, Anh Mai Nguyen, Thomas J. Fuchs, and Hod Lipson. Understanding
neural networks through deep visualization. CoRR, abs/1506.06579, 2015. URL http://dblp.
uni-trier.de/db/journals/corr/corr1506.html#YosinskiCNFL15.
[26] Anh Mai Nguyen, Jason Yosinski, and Jeff Clune. Multifaceted feature visualization: Un-
covering the different types of features learned by each neuron in deep neural networks.
CoRR, abs/1602.03616, 2016. URL http://dblp.uni-trier.de/db/journals/corr/
corr1602.html#NguyenYC16.
[27] Anh Nguyen, Alexey Dosovitskiy, Jason Yosinski, Thomas Brox, and Jeff Clune. Synthesizing
the preferred inputs for neurons in neural networks via deep generator networks. In Daniel D.
Lee, Masashi Sugiyama, Ulrike von Luxburg, Isabelle Guyon, and Roman Garnett, editors, NIPS,
pages 3387–3395, 2016. URL http://dblp.uni-trier.de/db/conf/nips/nips2016.
html#NguyenDYBC16.
[28] Matthew D. Zeiler and Rob Fergus. Visualizing and understanding convolutional networks.
CoRR, abs/1311.2901, 2013. URL http://dblp.uni-trier.de/db/journals/corr/
corr1311.html#ZeilerF13.
[29] Alex Krizhevsky, Ilya Sutskever, and Geoffrey E Hinton. Imagenet classification with deep
convolutional neural networks. In Advances in neural information processing systems, pages
1097–1105, 2012.
[30] Aravindh Mahendran and Andrea Vedaldi. Visualizing deep convolutional neural networks
using natural pre-images. CoRR, abs/1512.02017, 2015. URL http://dblp.uni-trier.de/
db/journals/corr/corr1512.html#MahendranV15.
[31] Karen Simonyan, Andrea Vedaldi, and Andrew Zisserman. Deep inside convolutional networks:
Visualising image classification models and saliency maps. CoRR, abs/1312.6034, 2013. URL
http://dblp.uni-trier.de/db/journals/corr/corr1312.html#SimonyanVZ13.
[32] Daniel Smilkov, Nikhil Thorat, Been Kim, Fernanda B. Viégas, and Martin Wattenberg.
Smoothgrad: removing noise by adding noise. CoRR, abs/1706.03825, 2017. URL http:
//dblp.uni-trier.de/db/journals/corr/corr1706.html#SmilkovTKVW17.
[33] Shadi Albarqouni, Christoph Baur, Felix Achilles, Vasileios Belagiannis, Stefanie Demirci,
and Nassir Navab. Aggnet: Deep learning from crowds for mitosis detection in breast cancer
histology images. IEEE Trans. Med. Imaging, 35(5):1313–1321, 2016. URL http://dblp.
uni-trier.de/db/journals/tmi/tmi35.html#AlbarqouniBABDN16.
[34] Adnan Mujahid Khan, Nasir M. Rajpoot, Darren Treanor, and Derek R. Magee. A nonlinear
mapping approach to stain normalization in digital histopathology images using image-specific
color deconvolution. IEEE Trans. Biomed. Engineering, 61(6):1729–1738, 2014. URL http:
//dblp.uni-trier.de/db/journals/tbe/tbe61.html#KhanRTM14.
[35] Adnan Mujahid Khan, Hesham El-Daly, Emma M Simmons, and Nasir M. Rajpoot. Hymap: A
hybrid magnitude-phase approach to unsupervised segmentation of tumor areas in breast cancer
histology images. In Journal of pathology informatics, 2013.
11You can also read