Geo Energy 1Q2021 Revenue and Earnings Surge, Declares a Dividend and Looks at Diversification into New Businesses
←
→
Page content transcription
If your browser does not render page correctly, please read the page content below

Geo Energy 1Q2021 Revenue and
Earnings Surge, Declares a Dividend
and Looks at Diversification into New
Businesses
Geo Energy Resources Limited (“Geo Energy” or “the Group”), an
integrated Indonesian coal mining group, is pleased to announce a
record set of financial results for the three months ended 31 March
2021 (“1Q2021”).

Results Briefing
Tung Kum Hon
CEO/Director
Singapore
21 May 2021

Forward Looking Statements
This announcement contains statements that are, or may be deemed to be, “forward looking statements” which are prospective in nature. These forward looking
statements may generally be identified by the use of forward looking terminology, or the negative thereof such as "plans", "expects" or "does not expect", "is
expected", “seeks”, "continues", "assumes", "is subject to, "budget", "scheduled", "estimates", "aims", "forecasts", "risks", "intends", "positioned", "predicts",
“projects”, "anticipates" or "does not anticipate", or "believes", or variations of such words or comparable terminology and phrases or statements that certain
actions, events or results "may", "could", "should", “shall”, "would", "might" or "will" be taken, occur or be achieved. Such statements are qualified in their entirety
by the inherent risks and uncertainties surrounding future expectations. Forward-looking statements are not based on historical facts, but rather on current
predictions, assumptions, expectations, beliefs, opinions, plans, objectives, goals, intentions and projections about future events, results of operations, prospects,
financial condition and discussions of strategy, any of which could prove to be inaccurate. By their nature, forward looking statements involve known and unknown
risks and uncertainties, many of which are beyond the control of Geo Energy Resources Limited (“Geo Energy”). Forward looking statements are not guarantees
of future performance and may and often do differ materially from actual results. There is no certainty or assurance as at the date of this announcement that any
transaction disclosed in this announcement will proceed or be completed or that no changes will be made to the terms thereof. Important factors that could cause
these uncertainties include, but are not limited to, those discussed in Geo Energy’s Annual Report 2020 and/or the offering memorandum dated 27 September
2017 in relation to the US$300 million 8.00% senior notes due 2022 offering by Geo Coal International Pte. Ltd., a wholly-owned subsidiary of Geo Energy. Neither
Geo Energy nor any of its associates or directors, officers or advisers, provides any representation, assurance or guarantee that the occurrence of the events
expressed or implied in any forward-looking statements in this announcement will actually occur. You are cautioned not to place undue reliance on these forward-
looking statements which only speak as of the date of this announcement. Other than in accordance with its legal or regulatory obligations (including under the
listing rules of the Singapore Exchange Securities Trading Limited), Geo Energy is not under any obligation and Geo Energy and its affiliates expressly disclaim
any intention, obligation or undertaking to update or revise any forward-looking statements, whether as a result of new information, future events or otherwise.
This announcement shall not, under any circumstances, create any implication that there has been no change in the business or affairs of Geo Energy since the
date of this announcement or that the information contained herein is correct as at any time subsequent to its date. No statement in this announcement is intended
as a profit forecast or a profit estimate. This announcement does not constitute or form part of any offer or invitation to sell or issue, or any solicitation of any offer
to purchase or subscribe for any securities. The making of this announcement does not constitute a recommendation regarding any securities. Shareholders,
investors and other persons are advised to exercise caution in trading the securities of the Group.

                        GEO                                                                                                                      © G E O     E N E R G Y      R E S O U R C E S
1Q2021                                                                    Key Operating Matrix
    Highlights                                                                                                           % change
    3 Months - 31 March 2021                                    1Q2020    2Q2020    3Q2020    4Q2020       1Q2021         (B – A) /
                                                                  (A)                                        (B)            (A)
                                  In Mt
    Key Performance
    Indicators                    Sales volume                      2.5       2.5       2.5        3.2            2.9               19
    Increased sales volume        Production volume                 2.6       3.2       3.0        3.9            2.0             (22)
    (19%) and ASP (17%) and
    reduced production cash
    costs (14%). Record cash      In US$ / tonne
    profit at US$15.71 per
    tonne                         Average ICI4                    34.44     26.78     23.95     31.97          41.84                21
                                  Average selling price (ASP)     33.22     27.17     23.46     27.84          38.85                17
    Note: ICI4 coal price as at
    14 May 2021 – US$55.98
                                  Production cash cost            26.86     20.92     19.58     19.75          23.14              (14)
    per tonne                     Cash profit                      6.36      6.25      3.88      8.09          15.71              147

                                  Mt: Million tonnes

3                                                                                             © G E O    E N E R G Y    R E S O U R C E S
1Q2021                                                                                                                      Key Financials
    Highlights                                                                                                                                                      %
    3 Months - 31 March 2021                                                                                                                                     change
                                                                                     1Q2020          2Q2020          3Q2020          4Q2020          1Q2021      (B – A) /
                                 In US$M                                               (A)                                                             (B)         (A)
    Key Performance
    Indicators                   Income Statement
    Record revenue of            Revenue                                                       88             73              59              87         115             30
    US$115m. 12-mth trailing
    EBITDA was US$88m.
                                 EBITDA                                                        14             14               7              22          45            221
                                 12-mth trailing EBITDA                                        35             35              40              57          88            151
    FCF in 3 months of           Net profit                                                    31             35              25               4          29             (9)
    US$29.7m.

    Note: 1Q2020 included        Cash flows
    gain on repurchases of the
    Senior Notes of US$40m       CAPEX                                                       0.6             0.8             0.4            0.1          0.1           (79)
                                 Free cash flow (FCF) 1                                     24.5             1.9             0.5           22.8         29.7             21
                                     M: Million
                                 1   Free cash flow is calculated as net cash from operating activities less net cash used in investing activities

4                                                                                                                                   © G E O     E N E R G Y   R E S O U R C E S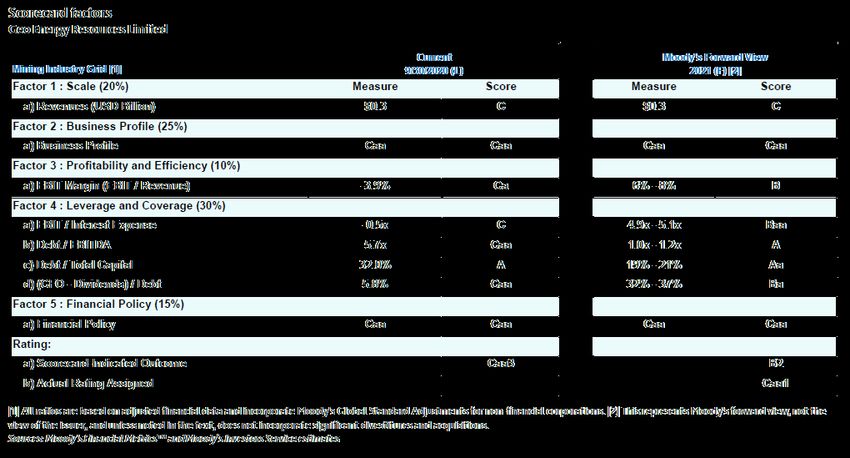
1Q2021                                                                                                                   Key Financials
    Highlights
    3 Months - 31 March 2021                                                       31 Mar          30 Jun          30 Sep         31 Dec         31 Mar        % change
                               In US$M, unless otherwise                            2020            2020            2020           2020           2021          (B – A) /
                               stated                                                                                               (A)            (B)            (A)
    Key Performance
    Indicators
                               Balance Sheet
    Low debt at US$62m and     Total debt 1                                                195            134              62              60            62                2
    net cash position. Cash    Cash and bank balance                                       107             78              33              53            82               55
    and bank balance
    increased to US$82m.       Net debt (cash)                                              88             56              29              7          (20)               nm
                               Net debt (cash) / EBITDA2                                  2.5x           1.6x            0.7x           0.1x        (0.2x)               nm
                               (times)
                               Equity                                                      155            190             215            218           247                13
                               1   Total debt is calculated as the aggregate of the Group’s lease liabilities and Senior Notes (including interest payable)
                               2   12-month trailing EBITDA

                               nm – not meaningful         M: Million

5                                                                                                                                © G E O    E N E R G Y       R E S O U R C E S
1Q2021 Financial Highlights
Highlights 140
Record Quarterly Revenue
In US$M
3 Months - 31 March 2021
115
120 Highest EBITDA
• Revenue increased by 30% to US$115 million from US$88
million in 1Q2020, driven by higher average selling price and 100
volume sold. 88 88
80
• 12-month trailing EBITDA increased by 151% to US$88 million
from US$35 million in 1Q2020 due to this quarter’s increased cash
60
profit resulting in the highest cash profit recorded by the Group
in a quarter.
40 35
30
• Free cash flow in three months increased by US$30 million 25
GEO
from US$25 million in 1Q2020, driven mainly by cash generated 20
from operations.
0
1Q2020 1Q2021
M: Million Revenue EBITDA Free cash flow
6 © G E O E N E R G Y R E S O U R C E S1Q2021 ICI4 coal price as at 14
May 2021 was US$55.98 Revenue
per tonne, up US$14.14
Highlights from 1Q21 Sales by countries (US$M)
3 Months - 31 March 2021 Highest
quarterly ICI4
140
coal price and
ASP in last 12
Sales volume (Mt) Coal prices (US$/mt) months 120
17.4
3.5 100
50
3 41.84 9.6 27.2
38.85 80
2.5 40 34.44 33.22
1.7 31.97 24.5
60
2 1.8 30 26.78 27.17 27.84
1.3 1.5 1.4 23.95 23.46
1.5 40
20 69.9
1 53.7
1.5 10 20
0.5 1.2 1.0 1.1 1.1
0 0 0
1Q20 2Q20 3Q20 4Q20 1Q21 1Q20 2Q20 3Q20 4Q20 1Q21 1Q20 1Q21
SDJ TBR ICI4 ASP China Indonesia Others
M: Million Mt: Million tonnes
7 © G E O E N E R G Y R E S O U R C E S1Q2021 Revenue
Highlights
3 Months - 31 March 2021
• Achieved highest revenue recorded in a quarter, as revenue increased by 30% to US$115 million in 1Q2021 from
US$88 million in 1Q2020.
• Delivered 2.9 million tonnes of coal in 1Q2021 with an average selling price per tonne of US$38.85.
• Average ICI4 coal price was US$41.84 per tonne in 1Q2021, up from US$31.97 per tonne in 4Q2020 and US$34.44
per tonne in 1Q2020. ICI4 coal price as at 14 May 2021 was US$55.98 per tonne, up US$14.14 from 1Q2021.
• China and Indonesia remain the Group’s core markets, contributing 61% and 24% respectively to the Group’s total
revenue in 1Q2021 (1Q2020: 61% and 28% respectively).
GEO
• Revenue coming from other regions increased slightly from 11% in 1Q2020 to 15%, mainly coming from South Korea
(1Q2021: US$11 million; 1Q2020: US$8 million)
8 © G E O E N E R G Y R E S O U R C E S1Q2021 Cost of Sales
Highlights Cost of sales (US$M) Components
3 Months - 31 March 2021
8%
• Production cash cost decreased by 14% to 78.7
-2%
US$23.14 per tonne due to negotiations with our
service providers in 2020 for a cost structure linked
31%
to coal price and lower SR (Strip Ratio) mining. US$73.7M
73.7
• Slight increase in Selling & marketing and other 61%
expenses (US$68 million: 1Q2020 US$67 million)
despite higher sales volume.
1Q20 1Q21
• Depreciation & amortisation decreased to US$6 Mining & other production costs
GEO
million despite higher sales volume due to increase Selling & marketing
in the SDJ & TBR’s coal reserve in 2020. Depreciation & Amortisation
Others
M: Million
9 © G E O E N E R G Y R E S O U R C E S1Q2021 Other Income / Expenses
Highlights General and Administration
expenses (US$M)
Other income (net) (US$M)
33.7
3 Months - 31 March 2021
Included US$40M
• Slight reduction in G&A due to lower staff costs and 2.7 gain on repurchases
of Senior Notes
professional fees.
2.5
• High net other income in 1Q2020 mainly due to US$40 0.3
million gain on repurchases of Senior Notes, offset by the
fair value loss on receivables of US$5 million due to the 1Q20 1Q21 1Q20 1Q21
pandemic and depressed coal prices impacting the value-in-
use of coal reserves in a Cooperation Agreement with Finance costs (US$M)
7.4
certain debtors.
Significant
reduction in 3
• Lower finance costs mainly due to lower outstanding months finance
GEO
costs by US$6.1m
Senior Notes of US$59 million (31 Mar 2020: US$188
1.3
million), and the accelerated amortisation of transaction
costs recorded during repurchases in 1Q2020.
1Q20 1Q21 M: Million
10 © G E O E N E R G Y R E S O U R C E SGross profit
1Q2021 increased by
US$31.7M in 3
months 1Q21
Net Profit
Highlights 70.0
5.0 ( 39.8 )
1Q20 included
US$40M gain on
(In US$M)
3 Months - 31 March 2021 60.0 26.7 repurchases of
Senior Notes. No Significant
repurchase of Senior reduction in 3
Notes in 1Q21
• Significant increase in Operating profit to 50.0 months finance
costs by US$6.1m
US$39 million (highest in a quarter) from US$7
million in 1Q2020. Net profit in 1Q2020 included 40.0
( 7.4 )
6.1
the US$40 million gain on the Senior Notes 31.3
repurchases. The higher tax is mainly due to 6.4 28.5
30.0
increase in operating profit for the quarter. 0.2
20.0
10.0
11
M: Million GEO -
1Q20 Revenue COS Other
Income
G&A
Increase
Other Finance Income
expense costs
Decrease
© G E O
tax
E N E R G Y
1Q21
R E S O U R C E S1Q2021 EBITDA
Highlights 50.0
(In US$M)
3 Months - 31 March 2021 0.2 0.1 44.9
3.5 0.3
26.7
40.0
• EBITDA increased from US$14 million in
1Q2020 to US$45 million (highest in a
quarter) largely driven by the increase in 30.0
Significant
revenue following the increase in ICI4 prices increase in
and lower cash cost of production. EBITDA to
20.0
14.1 US$44.9M in 1Q21
• 12 months trailing EBITDA at US$88 (increase by
million 221%)
10.0
12
M: Million GEO -
1Q20 Revenue Cash
cost
Other
Income
Increase
G&A
Decrease
© G E O
Other
expense
E N E R G Y
1Q21
R E S O U R C E SCash Flow
1Q2021 100.0 44.8 ( 13.0 ) (In US$M)
Highlights 90.0
( 1.6 ) 0.1 ( 0.1 ) ( 0.1 ) ( 0.7 ) 82.0
3 Months - 31 March 2021 80.0
70.0
• Cash and bank balances increased to US$82
60.0
million from US$53 million as at 31 Dec 2020,
driven by the high EBITDA and changes in
52.6 Free cash flow
50.0
working capital caused by payments made to of US$30.3M in
vendors and deposits paid third parties for the 40.0 3 months
quarter.
30.0
20.0
10.0
GEO
-
Dec '20 EBITDA Changes Tax paid Interest PPE Financing Other non- Mar '21
cash and in WC received activities cash cash and
bank bank
balance balance
Increase Decrease
M: Million
13 © G E O E N E R G Y R E S O U R C E S1Q2021 Debt Profile
Highlights Debt maturity at 31 Mar 2021
(US$M)
Debt / EBITDA (12-mth
trailing) times
3 Months - 31 March 2021
5.50
100% 0.2
• The Group’s debt comprises Senior Notes of US$62 98% Debt/EBITDA (times)
million (including interests) due in Oct 2022 and 96% 0.4 improved significantly
to 0.7 times
leases. 94% 62.7
92% Senior Notes
• The Group was in a net cash position (Debt less due in Oct 2022 0.70
90% 4.7
cash) of US$20 million as at 31 Mar 2021.
88%
2021 2022 DEC'20 MAR'21
• Debt/EBITDA (times) improved significantly from
5.6 times to 0.7 times as at 31 March 2021. US$ Bonds Leases
GEO
• FCCR (Fixed Charge Coverage Ratio) increased M: Million
from 1.5 times to 35.4 times in 1Q2021.
14 © G E O E N E R G Y R E S O U R C E SCredit Ratings Applying Moody’s mining rating
methodology
• Credit ratings have been upgraded
by all the Credit rating agencies
based on the Group’s improved
liquidity position and meeting of
the requirements for the
Mandatory Offer to Purchase
covenant to fall away.
• S&P Global raised to “CCC” from
“SD”, Fitch rating upgrade to “CCC”
from “CC” and Moody’s upgrade to
“Caa1” with outlook remains stable.
Source: Credit rating reports of (1) Fitch dated 19 February 2021; (2) Moody’s dated 9 December 2020; and (3) S&P dated 8 December 2020
15 © G E O E N E R G Y R E S O U R C E SShare Price Performance
Market Total 12M
Cap Return YTD Total Total Div. Yield
S$M QTD % Return % Return % %
20 May 2021
Geo Energy 294 31 17 58 6
Resources (RE4)
QTD means from 1 Apr 2021 to 20 May 2021; and
YTD means from 1 Jan 2021 to 20 May 2021
• The above total returns and dividend yield includes the
Group’s interim dividend of S$0.005 per share declared
for this quarter and the final dividend paid to shareholders
on 17 May 2021 of S$0.008 per share and are based on
the share price of S$0.210 on 20 May 2021.
0.14 SGD 20 May 2020
• EPS for 1Q2021 was S$0.027; NTA per share as at 31
Mar 2021 was S$0.238.
16 © G E O E N E R G Y R E S O U R C E SBond Price Performance US$ Bonds
• The price of our US$ Bonds has performed
well, increasing by 71% from 52% in 20
May 2020 to 89% in 20 May 2021, following
the optimisation of our capital structure and
US$89.13 20 May 2021
the upgrade of our credit ratings, based on the
Group improved liquidity position and the
falling away of the put option after fulfilling the US$52.10 20 May 2020
coal reserve requirements of 80 million tonnes
and the extension of mining licenses of the
SDJ and TBR mines to beyond 2025.
20 May 2021
17 © G E O E N E R G Y R E S O U R C E SESG
• Sustainability leadership during COVID-19 pandemic challenges Geo to re-examine
the fundamentals that are critical to the sustainability of the business and reinforce
resilience and looks at Diversification into New Businesses.
• We have invested over US$600,000 towards community well-being, particularly
through supporting education, public infrastructure and healthcare response to
COVID-19. We will continue to explore opportunities to enhance our social value
contribution (please refer to our Sustainability Reports).
• It is increasingly difficult for coal industry companies to raise financing from debt and
equity markets. This is evident from news that major banks are pulling out from the
industry, including Standard Chartered, DBS, MUFG, and others. This has impacted
our offtakers who hare reduced trade finance lines available for coal commodities. We
continue to build our banking relationships with Indonesian banks, Chinese banks and
GEO
commodity banks such as Macquarie that can still support coal. Furthermore, we are
looking at diversification opportunities to allow us greater access to cheaper
financing and not have a heavy reliance on the coal business.
18 © G E O E N E R G Y R E S O U R C E SICI coal Indexes
Industry Outlook
• Rising coal prices driven by the fall in coal production due to strong monsoon coupled with the rising exports as Indonesia
emerged at the forefront of the China-Australia trade dispute is expected to massively benefit Indonesian miners in near
term. ICI4 coal price was US$55.98 per tonne, up US$14.1 from 1Q2021. With the global improvement in the coal
industry, the Group is optimistic of the business outlook going forward.
• China’s coal futures have risen sharply and increased demand is supporting thermal coal prices. China's thermal coal
imports rebounded in March from a low base in February, driven by stronger receipts of non-coking bituminous coal and
lignite.
• Indonesia's MEMR has increased the national coal production target for 2021 by 75Mt to 625Mt on expectations of
continued strong demand, according to a signed ministerial decree. This will help the coal mining industry recover from the
effects of the COVID-19 pandemic last year contributed to Indonesia coal prices at all-time low. This also gives the
opportunity for Geo to apply for an increase in the RKAB (Work Plan and Budget) for SDJ and TBR production quota,
as we seek to achieve more than the 10Mt production target we have set for 2021.
19
GEO
Source: Science The Wire, 21 March 2021, Welcome to Indonesia – Coal’s Final Frontier, Argus Coal Daily International
Highlights Report, April 2021
© G E O E N E R G Y R E S O U R C E SThank You
For more Information, please visit
www.geocoal.com
20 © G E O E N E R G Y R E S O U R C E SYou can also read