GEORGIA POWER PLANT MCINTOSH - NPDES PERMIT NO. GA0003883 ASH POND DEWATERING PLAN REVISED JANUARY 2021
←
→
Page content transcription
If your browser does not render page correctly, please read the page content below
Georgia Power Plant McIntosh
 NPDES Permit No. GA0003883
   Ash Pond Dewatering Plan

    Revised January 2021
Background Plant McIntosh is located on the Savannah River in Effingham County and began commercial operation of the 167 MW coal-fired Unit 1 in 1979. Units 2 through 9 are simple-cycle combustion turbines and have been operational since 1995. Units 10 & 11 were added in 2005 and are natural gas-fired combined cycle units with a capacity rating of 688 MW each. The Ash Pond system is comprised of four cells and currently contains approximately 13,000,000 ft3 of water, subject to change as result of dewatering activities, precipitation, and evaporation. Purpose This Ash Pond Dewatering Plan (Plan) describes the additional procedures, safeguards and enhanced wastewater treatment measures that Georgia Power Company (GPC) will implement to ensure the facility’s NPDES permit effluent limitations continue to be met and the receiving waterbody continues to be protected during the ash pond dewatering process. This Plan provides an overview of the wastewater treatment system, describes the key processes, details of the major process control measurements being performed, and explains the effluent monitoring to be completed during dewatering. This Plan will be implemented upon commencement of active ash pond closure activities. Prior to the closure process beginning, ash pond discharges will not cause water levels to drop beyond normal historical operation. Following approval of the dewatering plan by EPD, and prior to commencement of dewatering, GPC will provide EPD with notification of dewatering implementation. As explained below, in addition to the requirements implemented during the dewatering process, GPC will continue to meet the effluent limitations of the plant’s NPDES permit and comply with all requirements of the NPDES permit. Wastewater Treatment System The wastewater treatment system (Treatment System) that is being utilized is a physical-chemical treatment plant that consists of sodium hypochlorite addition, equalization tank, pH adjustment, followed by solids separation by flocculation/clarification, clearwell, filtration, and finally monitoring. Solids will be dewatered and sent to the onsite landfill for disposal. Figure 1 provides a schematic of the Treatment System Location The Treatment System is located adjacent to the Plant McIntosh Ash Pond. The Treatment System has a containment system that assures that any ash pond water remains within the NPDES wastewater permitted basin until treated for discharge. The Treatment System will operate on an as-needed basis up to 24 hours per day and is sized to treat a maximum flow of 1,200 gpm. Influent As shown in Figure 2, wastewater is pumped to the Treatment System directly from the Ash Pond. The intake for the influent pump is operated to minimize solids inflow to the Treatment System. As the water level in the ash pond drops, treatment operations may cease until the volume of water in the pond is adequate for operations, or other measures may be implemented to provide sufficient water volume for pumping to the Treatment System. Water levels in the ash pond may fluctuate based upon storm water inflows, ash pond management, and dewatering activities. As overall water volumes in the ash pond decreases, operation of the Treatment System may be intermittent and on an “as needed” basis, although continuous operation may be utilized in response to wet weather conditions.
The influent to the Treatment System will be monitored for pH and turbidity. These parameters will be
used as a guide for treatment requirements. Influent flow rates will be managed to limit ash pond draw-
down at a rate of no greater than one foot per week or a rate to ensure structural integrity of the
impoundment as determined by the Dam Safety Engineer.
Sodium Hypochlorite Addition
All water pumped to the Treatment System will be treated with sodium hypochlorite to control biological
growth in the Treatment System. Treating the water for biological growth improves the Treatment
System efficiency and reduces maintenance. Based upon the demand for chlorine in the water being
pumped into the Treatment System, sodium hypochlorite addition will be adjusted. The dosage rate for
sodium hypochlorite will depend upon the flow rate, sediment load, and water temperature. Residence
time will be provided in the equalization tank. The equalization tank also provides a means to recycle
water.

pH & Coagulant
After the equalization tank pH adjustment is performed, the pH of the water pumped to the Treatment
System will be continuously tested before it enters the clarifier. Based upon the pH measurement, the
pH is adjusted to the optimal range for coagulation. Following pH adjustment, a coagulant and polymer
may be injected into the flow to aid in flocculation prior to entering the clarifier section. The dosage
rates for all chemicals will depend upon the flow rates, sediment loads, and inlet pH. Dosage rates will be
documented and kept on-site.

Clarifier
The chemically treated water flows into a clarifier and gravity settles the flocculated material to the
bottom of the clarifier. A pump pulls the underflow at the bottom of the clarifier towards the underflow
discharge point and is pumped to a sludge tank for thickening. Solids will be collected and disposed at
the onsite permitted landfill. The solids may be dewatered through a filter press or solidified to meet
moisture disposal requirements. Clarified water flows in an upward direction over a set of weirs and into
the clearwell tanks.

In the event any system issues are identified related to turbidity or pH at the clarifier, the effluent from
the clarifier will be sent to the off-spec water tank(s). Effluent from the off-spec water tank(s) will then
be recirculated to either the ash pond or to the equalization tank.

Clearwell Tanks
The clearwell tanks will gravity-fill from the weir overflows. The clearwell will be tested for oxidation
reduction potential (ORP) so the free chlorine residual from the sodium hypochlorite feed on the inlet is
removed before water leaves the Treatment System. As water moves through the Treatment System,
some of the free chlorine will be consumed and any remaining chlorine will be neutralized in the
clearwell. Sodium bisulfite will be maintained on site, as a backup, to remove any residual chlorine.

Filters
Following the clearwell tanks, water is then fed into the bag filtration system. The bag filtration system is
composed of two housings with sixteen sock filters. Each housing is rated for 100% of the design
flowrate, which allows for sock replacement without interruption of operation. The sock filters are initially
planned to be 100 microns, but the size can be adjusted during the ash pond closure process to optimize
solids removal. The clarified water passes through the bag filter system as a final particulate removal step
prior to discharge. The bag filter system has pressure differential gauges that require monitoring to
determine when a change of the sock filters is required. The pressure differential gauges are monitored
frequently by on-site personnel to ensure change-out of the bag filter when needed. The bag filtration
system is the final treatment process prior to the discharge.
During operation, effluent from the filters will be continuously tested for flow, pH, chlorine and turbidity,
and this information will be used to monitor the Treatment System operation. If an inline instrument
detects a reading above an effluent quality standard set point, the effluent will not be discharged and
instead will be recycled back to the equalization tank(s) or to the ash pond.
Upon initial startup of the Treatment System, samples of the treated water will be tested to verify the
Treatment System is operating as designed. In the event any system issues are identified, the treated
effluent will be recycled back to the equalization tank(s) or to the ash pond until the treatment system
efficacy is established. Only after initial treatment efficacy is established will treated effluent be routed to
Outfall 02.

Operation
The operational oversight of the Treatment System will be performed by a certified wastewater treatment
plant operator in accordance with the certification requirements of the Georgia Water and Wastewater
Treatment Plant Operators and Laboratory Analysts Rule.
FIGURE 1

                                                   Plant McIntosh Treatment System Schematic

                                                                                                                                                Effluent Quality
                                                                                                                                                                   Effluent Sampling
                                                                                                                                              Standards Sampling
                                                                                                                                                                       Point (ESP)

Influent        Sodium       Equalization                pH
                                                                  Coagulant &
              Hypochlorite
                                                     Adjustment
                                                                    Polymer           Clarifier                 Clearwell Tank        Bag Filter
                 Feed          Tank(s)                              Addition
                                                                                                                                                                                  Effluent

                                                                                            Solids

                                                                                                                     Off-Spec Water
                                                                                 Solids Handling Tank                    Tank(s)

                                       Return to EQ Tank(s)

                                                                                     Filter Press

     Return to Ash Pond                Return to EQ Tank(s)

                                                                                             Cake to Landfill
FIGURE 2
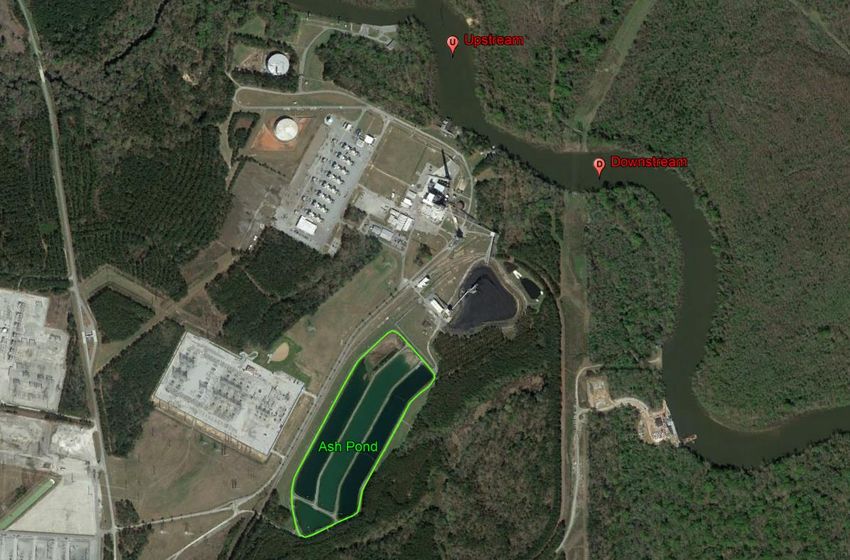
FIGURE 3

Plant McIntosh Ash Pond
Process Control Monitoring

Each day following Treatment System startup, pH and turbidity of the influent and effluent of the
Treatment System will be verified prior to discharge of treated water to the permitted outfall. Upon
verification the Treatment System performs as expected, the discharge will be routed to Outfall 02.

During discharge operations, pH, chlorine and turbidity are continuously measured, and the discharge will
be visually inspected, to ensure the Effluent Quality Standards (EQS) listed below are met. If the treated
effluent indicates a significant change during operations, discharge to the permitted outfall will be
automatically diverted and the treated water will be recycled to the equalization tank(s) or to the ash
pond while adjustments are made. After any issues are resolved, the Treatment System will be returned
to normal operation with discharge to Outfall 02 following verification the system performs as expected.

Maintenance
Instrumentation for use on the site will be maintained to ensure optimal performance and provide
accurate results. Each piece of technical equipment will be calibrated at the manufacturer’s recommended
intervals and more often if deemed necessary by on-site personnel. The instrumentation includes a
turbidity meter, a pH meter, flow meters, and the chemical feed pumps.

Testing
Samples are collected from both the influent (ash pond) and the Treatment System Effluent Sampling
Point (ESP) to guide system operation and compare against the continuous monitoring results for the
EQS’s listed below. The results will be used to verify that the Treatment System is performing optimally,
as well as to obtain data to establish and update the correlation between the total suspended solids
(TSS) and turbidity of the Treatment System effluent. TSS/turbidity control is an indicator of Treatment
System efficient operation that is correlated to metals removal efficiencies as further confirmed by weekly
monitoring results. The initial TSS vs Turbidity correlation curve and EQS’s results will be provided to EPD
prior to commencement of dewatering activities and updated quarterly or more frequently on an as
needed basis. Furthermore, the TSS vs Turbidity correlation will be updated in the event that the EQS for
TSS is exceeded. All EQS’s results including TSS vs Turbidity correlation curves will be available onsite for
EPD review. TSS correlation to turbidity will be used to establish a turbidity set-point for the effluent.
Effluent reaching this set-point will be recycled back to the equalization tank(s) or to the ash pond for
additional treatment.

Effluent Quality Standards (EQS’s)
    •   pH: 6.4 to 8.6 S.U. operational limits
    •   Turbidity: Determined by TSS correlation
    •   Flow rate: 1,200 gpm max
    •   Total Suspended Solids (TSS):
Effluent Monitoring and Reporting Stream Monitoring Effluent Requirement Measurement Sample Type Sample Location Characteristics Frequency mg/L or (Units) pH (s.u.) Report 2/Month Grab Upstream & Downstream* TSS Report 2/Month Grab Upstream & Downstream* Oil & Grease Report 2/Month Grab Upstream & Downstream* Turbidity (NTU) Report 2/Month Grab Upstream & Downstream* TDS Report 2/Month Grab Upstream & Downstream* BOD5-day Report 2/Month Grab Upstream & Downstream* Copper, total Report 2/Month Grab Upstream & Downstream* Selenium, total Report 2/Month Grab Upstream & Downstream* Arsenic, total Report 2/Month Grab Upstream & Downstream* Mercury, total Report 2/Month Grab Upstream & Downstream* Chromium, total Report 2/Month Grab Upstream & Downstream* Lead, total Report 2/Month Grab Upstream & Downstream* Cadmium, total Report 2/Month Grab Upstream & Downstream* Zinc, total Report 2/Month Grab Upstream & Downstream* Nickel, total Report 2/Month Grab Upstream & Downstream* Ammonia-N Report 2/Month Grab Upstream & Downstream* TKN Report 2/Month Grab Upstream & Downstream* Nitrate/Nitrite Report 2/Month Grab Upstream & Downstream* Organic Nitrogen Report 2/Month Grab Upstream & Downstream* Phosphorus, total Report 2/Month Grab Upstream & Downstream* Orthophosphate-P Report 2/Month Grab Upstream & Downstream* Hardness Report 2/Month Grab Upstream & Downstream* Sampling and monitoring to be performed using standard methods as provided for in 40 CFR Part 136, which will be sufficiently sensitive. * Instream sampling shall occur at approximately 1000ft upstream and downstream of the final discharge to the Savannah River (Figure 3).
Effluent Monitoring

Effluent                  Monthly            Daily                 Measure               Sample Type           Sample
Characteristics           Average            Maximum               Frequency                                   Location
mg/L or (Units)

Flow (MGD)                Report             Report                Daily                 Continuous            EQS

pH (s.u.)                 Report             Report                Daily                 Continuous            EQS

TSS                       Report             Report                Weekly                Grab                  ESP

Oil & Grease              Report             Report                Weekly                Grab                  ESP

Turbidity (NTU)           Report             Report                Daily                 Continuous            EQS

TDS                       Report             Report                Weekly                Grab                  ESP

TRC                       Report             Report                Daily                 Continuous            EQS

BOD5-day                  Report             Report                Weekly                Grab                  ESP

Copper, total             Report             Report                Weekly                Grab                  ESP

Selenium, total           Report             Report                Weekly                Grab                  ESP

Arsenic, total            Report             Report                Weekly                Grab                  ESP

Mercury, total            Report             Report                Weekly                Grab                  ESP

Chromium, total           Report             Report                Weekly                Grab                  ESP

Lead, total               Report             Report                Weekly                Grab                  ESP

Cadmium, total            Report             Report                Weekly                Grab                  ESP

Zinc, total               Report             Report                Weekly                Grab                  ESP

Nickel, total             Report             Report                Weekly                Grab                  ESP

Ammonia-N                 Report             Report                Weekly                Grab                  ESP

TKN                       Report             Report                Weekly                Grab                  ESP

Nitrate/Nitrite           Report             Report                Weekly                Grab                  ESP

Organic Nitrogen          Report             Report                Weekly                Grab                  ESP

Phosphorus, total         Report             Report                Weekly                Grab                  ESP

Orthophosphate-P          Report             Report                Weekly                Grab                  ESP

Hardness                  Report             Report                Weekly                Grab                  ESP

Sampling and monitoring to be performed using standard methods as provided for in 40 CFR Part 136, which will be sufficiently
sensitive.
Reporting and Notification
Effluent and instream monitoring results will be submitted to EPD via e-mail by the 15th day of the month
following the sampling period. Results shall be submitted in an Excel spreadsheet to both the EPD
compliance office and the EPD industrial permitting unit. Laboratory analysis and data sheets shall be
retained on site. The first sampling report will be submitted the month following Treatment System
startup. In addition, quarterly updates of the TSS vs. Turbidity correlation curve and other updates
based on an exceedance of the EQS for TSS, will also be submitted to EPD via e-mail by the 15th of the
month following the end of the quarter or the month after the EQS exceedance.
Immediate (within 24 hours) notification to both the EPD compliance office and industrial permitting unit
will occur and a corrective action plan implemented if any of the EQS’s for pH, total residual chlorine, or
turbidity are not achieved, and the automatic recirculation system fails.
You can also read