Getting water policy right: a Sydney Water perspective Dr Kerry Schott, Melbourne Institute Economic and Social Outlook Conference, July 2011
←
→
Page content transcription
If your browser does not render page correctly, please read the page content below

Getting water policy right:
     a Sydney
        y   y Water p
                    perspective
                        p

    Dr Kerry Schott,
    Melbourne Institute
1   Economic and Social Outlook Conference, July 2011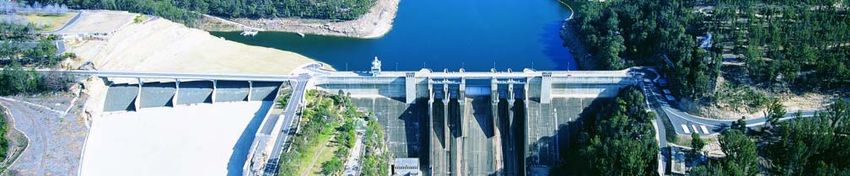
Good water policy:
   A customer focus
   Good long term planning
   Catering for a growing city
   Efficient delivery and use of resources
   The right prices
   Independent regulation

Customer focus…
  g q
High       y drinking
     quality        g water
Infrastructure investment to
maintain service standards and
secure supplies
Wastewater systems to protect
waterways and beaches
Sustainability
Customers appreciate that they get
value for money
Good planning…

Analysis: Portfolio choice
    Constraint:      S=D
     Where there are various supply options S = (S1…..Sn)
               Dams / desal / recycling
    - And various demand management
                             g      options
                                     p      D = ((D1…..Dm)

    Evaluate on basis of:
            – volume supplied or saved
            – total cost per kilolitre
            – variance/reliability

5
Portfolio approach – choices
     Option                         Cost per kilolitre
     Dams (Regulated value)         $0.74
     Dams (Replacement value)       $1.32

     Desal Stage 1                  $2.24
     Desal Stage 2                  $1.99

     Recycled Water (Industrial)    $1.00 - $4.00 (and above)
     Recycled Water (Residential)   $4.00 - $6.00 (and above)

     WaterFix                       Less than $1.50
     EDC Business programs          $0.50 to $2.00
     DIY Water
         W t saving
                i kits
                    kit             L
                                    Less than
                                         th $1.50
                                              $1 50
     Toilet replacement service     Less than $1.50
     Love your Garden               Greater than $2.00
     Washing machine rebates        Greater than $3.20
     Rainwater Tanks                At least $5.00
6
Dams

7

Desalination plant - Kurnell

8

Recycling
        y   g–
    St Mary’s

9
Water Efficiency
                   y

1
0
Active leak detection 11
Efficient delivery
                 y
A typical $1000 water and wastewater bill comprises:
2009-10 Expenses
p by
y type
yp
Total operating
p g expenditure
p 2009-10 (($1,076
, million))
Staff costs
Bulk water and filtration
Service contractors
Materials, transport and elec.
Property and Administration
Other expensesStaff numbers
Currently just under 3,000 FTEs
S d
Sydney Water
W t Staff
St ff Numbers
N b
16,000
14,000
quivalent Staff
12,000
10,000
8,000
Full Time Eq
6,000
4,000
2 000
2,000
0
80
85
87
88
89
90
91
92
93
94
95
96
97
98
99
00
01
02
03
04
05
06
07
08
09
10
19
19
19
19
19
19
19
19
19
19
19
19
19
19
19
20
20
20
20
20
20
20
20
20
20
20
Calendar YearSydney Water’s Energy use 15
Energy
                        gy use 1996 - 2020
                    600,000

                                Historical data   Forecast projections          Additional:
                                                                                • 40,000
                                                                                  40 000 t CO2
                    500,000                                                     • $11M (2020)

                                                                                From:
               h)
 Energy Use (MWh

                                                                                • New
                                                                                  N    efficiency
                                                                                        ffi i
                    400,000
                                                                                  and renewable
                                                                                  energy projects

                    300 000
                    300,000                                                     Totalling:
                                                                                T  t lli
                                                                                • 135,000 t CO2
                                                             Growth satisfied   • $35M (2020)
                    200,000                                  by energy
                                                             saving projects
                                                                                  Current Efficiencies
                    100,000                                  Grid electricity     Current REG
                                                             purchase same        New Efficiencies and REG
                                                             as in 96/97          Greenpower
                                                                                  Grid power Consumed
                         -

16
Biogas
g
Cogeneration
17Hydro
yd o electric
e ect c ge
generation
e at o - Nth
t Head
ead S
STP
18Catering for a growing city…
5-year Growth Servicing Plan
Work with private sector and planning authorities
– timing growth servicing to match demand
Growth a major
j driver of our infrastructure
planning and investmentWater demand: 1995 - 2030 20
To help protect y our priv acy , PowerPoint prev ented this external picture from being automatically downloaded. To download and display this picture, click Options in the Message Bar, and then click Enable external content.

                                                                 Localised p
                                                                           projects
                                                                              j     –
                                                                 impact of WICA

                    21
The right pricing
Current…
• Water prices have fixed and variable components
• The total p
price of 1kL of water is close to the average
g LRMC of supply
pp y
• Over time the average LRMC is rising
g stamp
• Postage pppricing
g is p
popular
p with customers
Policy debates
debates…
• Linking prices to dam levels – ‘scarcity pricing’
• How far should postage stamp pricing extendResidential price elasticity…
Impact of increasing water usage prices from $2.00kL to
$3 00kL (50% iincrease))
$3.00kL
‘Scarcity pricing’ outcomes for an average house and unit/flat
Housing type Price Reduction in Increase in
elasticity
l i i water use water use charges
h
(%) (%) (kL/year) ($/year)
House -12% -6% 12kL +$165
Unit/flat -2% -1% 1.5kL +$146Independent
p regulation
g for
public monopolies:
p of the model if monopoly
part p y water networks are to
operate "at arm's length” from government
assists in achieving full cost recovery on investment
imposes cost discipline on the utilityWater industry
y in Sydney
y y
Bulk Water (SCA and SDP) Contestable
E i ti separation
Existing ti
Contestability for the
Water treatment (BOO)
Existing separation market
Existing SWC
Water and wastewater transport N t lM
Natural Monopoly
l
Potential divisions and distribution
Wastewater Recycling Contestable
treatment
and disposal
Retail services ContestableGood water policy: A customer focus Good long term planning Catering for a growing city Efficient delivery and use of resources The right prices Independent regulation
You can also read