Global Ecology and Conservation
←
→
Page content transcription
If your browser does not render page correctly, please read the page content below
Global Ecology and Conservation 24 (2020) e01272

                                                     Contents lists available at ScienceDirect

                                          Global Ecology and Conservation
                                  journal homepage: http://www.elsevier.com/locate/gecco

Review Paper

Conservation of carnivorous plants in the age of extinction
Adam T. Cross a, b, *, Thilo A. Krueger a, Paulo M. Gonella c,
Alastair S. Robinson d, Andreas S. Fleischmann e, f
a
  School of Molecular and Life Sciences, Curtin University, GPO Box U1987, Bentley, WA, 6102, Australia
b
  EcoHealth Network, 1330 Beacon St, Suite 355a, Brookline, MA, 02446, United States
c                          ~o Joa
  Universidade Federal de Sa    ~o Del-Rei, Campus Sete Lagoas, Rodovia MG 424, Km 47, 35701-970, Sete Lagoas, Minas Gerais, Brazil
d
  National Herbarium of Victoria, Royal Botanic Gardens Melbourne, Melbourne, VIC, 3004, Australia
e
  Botanische Staatssammlung München (SNSB-BSM), Menzinger Strasse 67, D-80638, Munich, Germany
f
  GeoBio-Center LMU, Ludwig-Maximilians-Universita   €t München, Munich, Germany

a r t i c l e i n f o                                a b s t r a c t

Article history:                                     Carnivorous plants (CPs)dthose possessing specific strategies to attract, capture and kill
Received 3 August 2020                               animal prey and obtain nutrition through the absorption of their biomassdare harbingers
Received in revised form 5 September 2020            of anthropogenic degradation and destruction of ecosystems. CPs exhibit highly speci-
Accepted 6 September 2020
                                                     alised and often very sensitive ecologies, being generally restricted to nutrient-
                                                     impoverished habitats where carnivory offers a competitive advantage. As such, they are
Keywords:
                                                     often the first species to disappear following habitat degradation, land use change, and
Conservation
                                                     alteration to natural ecological processes, and are at significant risk from processes such as
Restoration
Carnivorous plants
                                                     eutrophication and weed invasion, and even poorly-understood impacts such as airborne
Insectivorous plants                                 nitrogen inputs. Many of the world's 860 species of CPs are found in wetland habitats,
Threatening processes                                which represent some of the most cleared and heavily degraded ecosystems on Earth.
                                                     Global diversity hotspots for CPs are likewise located in some of the most heavily cleared
                                                     and disturbed areas of the planetdsouthwestern Western Australia, Southeast Asia,
                                                     Mediterranean Europe, central eastern Brazil, and the southeastern United Statesdplacing
                                                     their conservation at odds with human developmental interests. Many carnivorous plant
                                                     species exhibit extreme range-restriction and are wholly localised to specific geological
                                                     formations, microhabitats or elevations, with nowhere to move to in the face of envi-
                                                     ronmental change, such as a warming, drying climate. We provide the first systematic
                                                     examination of the conservation status and threats to all CPs globally, compiling full or
                                                     partial assessments of conservation status category for 860 species from 18 genera, and
                                                     provide ten recommendations towards better conservation and management of this iconic
                                                     group. A total of 69 species were assessed as Critically Endangered (8% of all species), 47 as
                                                     Endangered (6%), 104 as Vulnerable (12%), and 23 as Near Threatened (3%). Slightly over
                                                     60% of CPs (521 species) were assessed as Least Concern. At least 89 species are known
                                                     from only a single location based on current knowledge. Data on threatening processes
                                                     were available for 790 species, with the most common threatening processes including
                                                     Agriculture and Aquaculture (impacting 170 species), Natural Systems Modifications (168
                                                     species), Climate Change and Severe Weather (158 species), Energy Production and Mining
                                                     (127 species), Human Intrusions and Disturbance (126 species), and Biological Resource Use
                                                     (98 species). Almost a quarter of all species were impacted upon by three or more
                                                     threatening processes. The most significant threats placing species at imminent risk of
                                                     extinction include the continuing clearing of natural habitat for urban and agricultural
                                                     development and the illegal collection of individuals from the wild for horticultural trade.

    * Corresponding author. School of Molecular and Life Sciences, Curtin University, GPO Box U1987, Bentley, WA, 6102, Australia.
      E-mail address: adam.cross@curtin.edu.au (A.T. Cross).

https://doi.org/10.1016/j.gecco.2020.e01272
2351-9894/© 2020 The Authors. Published by Elsevier B.V. This is an open access article under the CC BY-NC-ND license (http://creativecommons.org/
licenses/by-nc-nd/4.0/).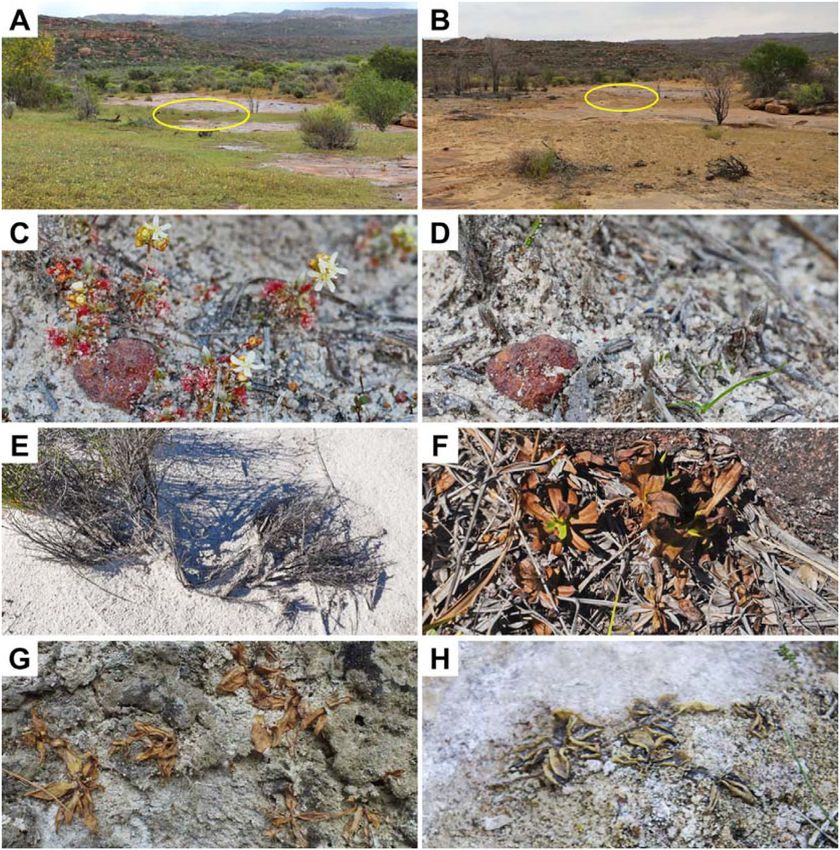
A.T. Cross, T.A. Krueger, P.M. Gonella et al.                                                  Global Ecology and Conservation 24 (2020) e01272

                                                The complex and specialised ecological requirements of CPs, together with the multifac-
                                                eted threats they face, make conservation difficult and repatriation even to restored areas
                                                challenging. As the number of vulnerable, endangered and extinct carnivorous plant
                                                species continues to grow, despite significant conservation efforts in many regions and
                                                greater awareness of their ecological requirements, it is clear that a paradigm shift is
                                                required in our approach to the preservation of this unique group of plants in order to
                                                achieve long-term conservation successes.
                                                © 2020 The Authors. Published by Elsevier B.V. This is an open access article under the CC
                                                                   BY-NC-ND license (http://creativecommons.org/licenses/by-nc-nd/4.0/).

1. Introduction

    Carnivorous plants (CPs) are an iconic and captivating group of plants. While most historic scientific interest in this group
has focussed on their biology, ecology and nutrient acquisition strategies, CPs and other highly ecologically specialised plants
are increasingly recognised as being at risk from a range of anthropogenic influences in a changing world (e.g., Swarts and
Dixon, 2009; Jennings and Rohr, 2011; Clarke et al., 2018; Cross, 2019). A review by Jennings and Rohr (2011) classified the
threatening processes affecting CPs into eleven generalised categories, and found that the most common included ‘habitat
loss from agriculture’, ‘the collection of wild plants’, ‘pollution’, and ‘natural systems modifications’. However, at the time of
their review only around 600 species of CPs were described from 17 genera, and information on threatening processes were
available for only 48 species (Jennings and Rohr, 2011). In the ensuing decade, there has been a significant increase in the
number of species for which up-to-date information exists on threatening processes, while a large number of new species of
CPs have been discovered and described in papers with integral threat assessments, particularly from biodiverse regions such
as northern and southwestern Australia (e.g., Jobson, 2013; Jobson and Baleerio, 2015; Robinson et al., 2018), Borneo, Malaysia
and the Philippines (e.g., Lagunday et al., 2017; Robinson et al., 2019a, 2019b; Golos et al., 2020), and Brazil (e.g., Fleischmann
et al., 2011, 2017; Souza and Bove, 2011; Carvalho and Queiroz, 2014; Rivadavia et al., 2013, 2014; Gonella et al., 2014, 2015;
Gonella and Baleeiro, 2018; Scatigna et al., 2015, Scatigna et al., 2017). As of January 2020, exactly 860 species of CPs had been
described from 18 genera (Ellison and Adamec, 2018, updated since by the authors of the present work).
    Recent studies have highlighted significant conservation concerns for an increasing number of iconic CP species around
the world: the cosmopolitan Aldrovanda vesiculosa (Cross, 2012a, 2012b; Cross et al., 2015, 2016; Adamec, 2018; Cross and
Adamec, 2020); Byblis gigantea and Cephalotus follicularis from southwestern Western Australia (Cross et al., 2013; Cross
et al., 2018b, 2019; Bradshaw et al., 2018; Just et al., 2019); Drosophyllum lusitanicum from the southern Mediterranean
                                          mez-Gonza
(Paniw et al., 2015; Cross et al., 2017; Go           lez et al., 2018; Skates et al., 2019); Triphyophyllum peltatum from western
Africa (Cross et al., 2018b); many Nepenthes from southeast Asia (Clarke et al., 2018; Robinson et al., 2019a, 2019b); almost all
species of Sarracenia from North America (U.S. Fish and Wildlife Service 1991; Schnell, 2002; Koopman and Carstens, 2010;
Jennings and Rohr, 2011); and a number of Drosera species from South America, South Africa and Australia (de Stefano and dos
Santos Silva, 2001; Gonella et al., 2016; Robinson et al., 2017; Clarke et al., 2018; Fleischmann et al., 2018).
    Climatic modelling and niche predictions under predicted climate scenarios suggest many CP species around the world
face an uncertain and potentially challenging future, with nearly 70% of modeled species exhibiting negative median
bioclimatic velocity and several species predicted to experience a 100% loss of potential range area by 2050 (Fitzpatrick and
Ellison, 2018). It appears that increasing numbers of CPs, from almost all regions in which they occur, face growing pressure
from a broadening diversity of threatening processes including increasing habitat loss which is a primary global driver of
biodiversity erosion (e.g., Dobson et al., 2006; Betts et al., 2017; Thompson et al., 2017; Staude et al., 2018). The scale of habitat
loss in regions harbouring high CP biodiversity ranges from fine-scale selective removal of species such as hardwood trees
through forestry and illegal logging in countries such as Indonesia and those of West Africa (Jepson et al., 2001; Nellemann,
2007; Arcilla et al., 2015), to the landscape-scale replacement of natural vegetation with production monocultures such as
Eucalyptus plantations in southeast Brazil (Ribas et al., 2016), and palm oil or cereal crops in southeast Asia and Western
Australia (Nellemann, 2007; Fitzherbert et al., 2008; Bradshaw, 2012; Lee et al., 2014). Although the spatial scale and regional
intensity of habitat loss is dependent upon its underlying drivers and mechanisms (De Chazal and Rounsevell, 2009; de Castro
Solar et al., 2016), the ecological impacts of even small-scale disturbances on species and ecosystems can be profound (Hobbs
and Huenneke, 1992; Langhans et al., 2010), particularly where the cumulative impacts of multiple activities begin to reduce
habitat connectivity and the maintenance of natural ecological processes such as hydrology, fire, pollination, and dispersal
(Theobald et al., 1997; Vanbergen and Initiative, 2013; Auffret et al., 2017). Some CP species are being recognised as at risk of
extinction from threats such as habitat destruction, poaching and/or climatic change even as they are being discovered,
including the iconic giants Nepenthes attenboroughii (Robinson et al., 2009) and Drosera magnifica (Gonella et al., 2015).
    In recognition of the growing need to examine and maintain the currency of conservation status category for this group,
the Carnivorous Plant Specialist Group (CPSG; http://www.iucn-cpsg.org/) of the International Union for the Conservation of
Nature (IUCN) Species Survival Commission was established and has undertaken numerous conservation status assessments
of CPs for the IUCN Red List of Threatened Species. However, while Clarke et al. (2018) overviewed the conservation status
category of CPs following the assessment of ca. 300 previously unassessed species by the CPSG in 2016, no systematic global

                                                                     2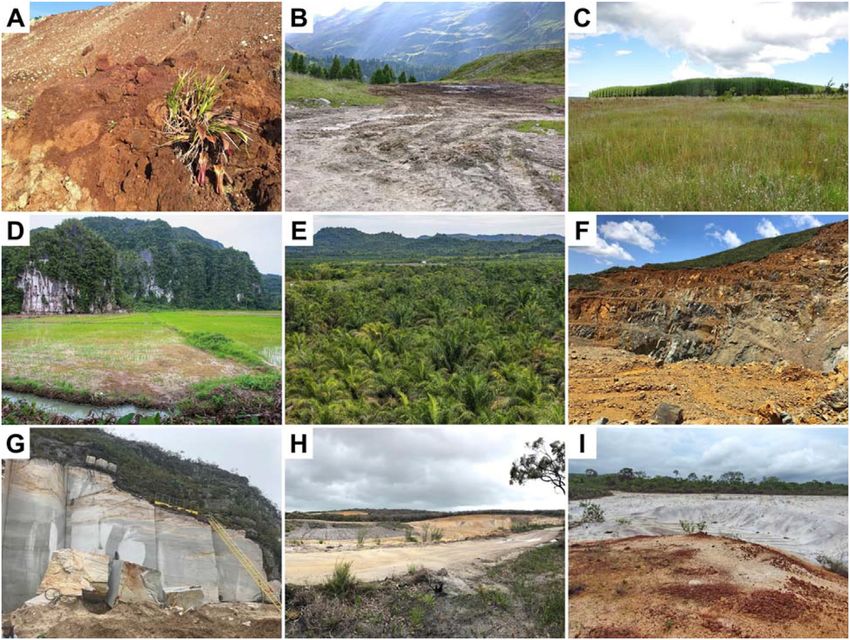
A.T. Cross, T.A. Krueger, P.M. Gonella et al.                                            Global Ecology and Conservation 24 (2020) e01272

review of the conservation status category and threatening processes impacting CPs has been conducted since the work of
Jennings and Rohr (2011).
   This study provides a systematic reexamination of the conservation status and threats to CPs globally, greatly improving
the species coverage achieved by Jennings and Rohr (2011) and determining whether regional and global threats to this iconic
plant group have become better resolved in the intervening decade. We aimed to i) provide an assessment of conservation
status category (IUCN Red List category) for all currently-described CP species; ii) determine which threatening processes
presented the greatest impacts to CPs globally; iii) determine whether putative micro-endemics (i.e., species known from
only from a limited geographical range, sometimes just one locality) or species impacted upon by multiple threatening
processes were significantly more likely to be assessed at greater risk of extinction (i.e., a higher conservation status cate-
gory); and iv) identify regions harbouring the greatest numbers of threatened CPs to evaluate the highest conservation re-
sponsibilities on a global scale and assist and prioritising management efforts. CP species often exhibit highly complex
biological mutualisms, sometimes providing crucial habitat or resources for other organisms (e.g., Grafe et al., 2011; Bazile
et al., 2012; Cross et al., 2018b, 2019), and some ecologically sensitive species have been described as harbingers of
ecosystem decline and habitat degradation (e.g., Cross, 2012a). Jennings and Rohr (2011) noted that the appropriate con-
servation and management of CPs was “likely to help maintain the important ecosystem services they provide and prevent
secondary extinctions of specialist species that rely on them”, and that their loss from ecosystems could cause cascading
secondary effects including extirpations and extinctions. As anthropogenic degrading factors continue to deplete taxonomic,
genetic and functional diversity in ecosystems worldwide (Naeem et al., 2012), the conservation of highly specialised or
range-restricted species occupying small or highly-specific ecological niches becomes ever more challenging (Swarts and
Dixon, 2009). The prioritisation, financing and establishment of appropriate conservation and management activities re-
quires accurate and contemporary information.

2. Methods

    Following the methods of Jennings and Rohr (2011), entries for all carnivorous plants currently assessed in the IUCN Red
List database (www.iucnredlist.org) were extracted on 20 January 2020. The National Red List database (www.na
tionalredlist.org) was also searched on 20 January 2020 for all carnivorous plant genera (published to that date): Aldro-
vanda [one species], Brocchinia [only the two carnivorous species were considered], Byblis [eight species], Catopsis [one
species], Cephalotus [one species], Darlingtonia [one species], Dionaea [one species], Drosera [248 species], Drosophyllum [one
species], Genlisea [30 species], Heliamphora [23 species], Nepenthes [169 species], Philcoxia [seven species], Pinguicula [105
species], Roridula [two species], Sarracenia [11 species], Triphyophyllum [one species], and Utricularia [248 species]. “Para-
carnivorous” species were excluded from analyses; for example, Nishi et al. (2013) propose carnivory in Paepalanthus bro-
melioides (Eriocaulaceae), but the absorptive capacity of its leaf trichomes remains unclear (Cross et al., 2018b) and thus the
species is not generally regarded as carnivorous. To supplement these lists with species for which information on conser-
vation status and threatening processes were published but not yet assessed by the IUCN, we conducted a search using Web of
Knowledge, Google Scholar and Scopus to identify relevant peer-reviewed literature using the keywords ‘carnivorous plants’,
‘conservation’, ‘threats’, ‘threatening’ and each carnivorous plant genus name. Published conservation statuses, mainly from
species descriptions, were included only where species had been assessed recently (2000 onwards) using the IUCN frame-
work and principles. Where adequate data on distribution and threats were available in the published literature but no
conservation status yet proposed, we used these data to assess species against the current IUCN criteria version (3.1) to
provide each with an indicative conservation status (the authors having combined experience in assessing over 500 species
for the IUCN Red List) under the standard IUCN categories (IUCN, 2012), namely Least Concern (LC), Near Threatened (NT),
Vulnerable (VU), Endangered (EN), Critically Endangered (CR), Extinct in the Wild (EW), Extinct (EX) and Data Deficient (DD).
Area of Occurrence (AOO) and Extent of Occurrence (EOO) values were extracted from IUCN assessments or published
literature, or were generated from GeoCAT (http://geocat.kew.org/) consistent with IUCN methodology for species where
sufficient distributional data were available, using published distribution data and quality-controlled Global Biodiversity
Information Facility (GBIF.org, 2020), Atlas of Living Australia (ALA) and iNaturalist.org records. Only records from 1970
onwards were used, and all records were checked to ensure instances of cultivated, misidentified and erroneous locations
were excluded. For consistency, and to facilitate analyses, we present data from global assessments of each species only; it
should be noted that the conservation status of some species examined here may vary among specific regions or jurisdictions.
    All documented threats to each species were classified following the unified scheme proposed by Salafsky et al. (2008), as
adopted by the current IUCN criteria version (3.1) and by Jennings and Rohr (2011). This scheme comprises three hierarchical
levels of threats increasing in specificity with each level, beginning with 11 first level categories: (1) Residential and Com-
mercial Development, (2) Agriculture and Aquaculture, (3) Energy Production and Mining, (4) Transportation and Service Corri-
dors, (5) Biological Resource Use, (6) Human Intrusions and Disturbance, (7) Natural Systems Modifications, (8) Invasive and Other
Problematic Species and Genes, (9) Pollution, (10) Geological Events, and (11) Climate Change and Severe Weather. While second
and third level categories further defining threatening processes are sometimes presented in conservation assessments (e.g.,
Cross, 2020b; Fleischmann et al., 2011, 2017, 2020; Gonella et al., 2016; Robinson et al., 2009, 2018, 2019b), for the purposes of
consistency and statistical analyses we present only first level threatening process categories for species in this study. Data on
threatening processes for species assessed by the IUCN were updated where the published literature provided more
contemporary evidence.

                                                                3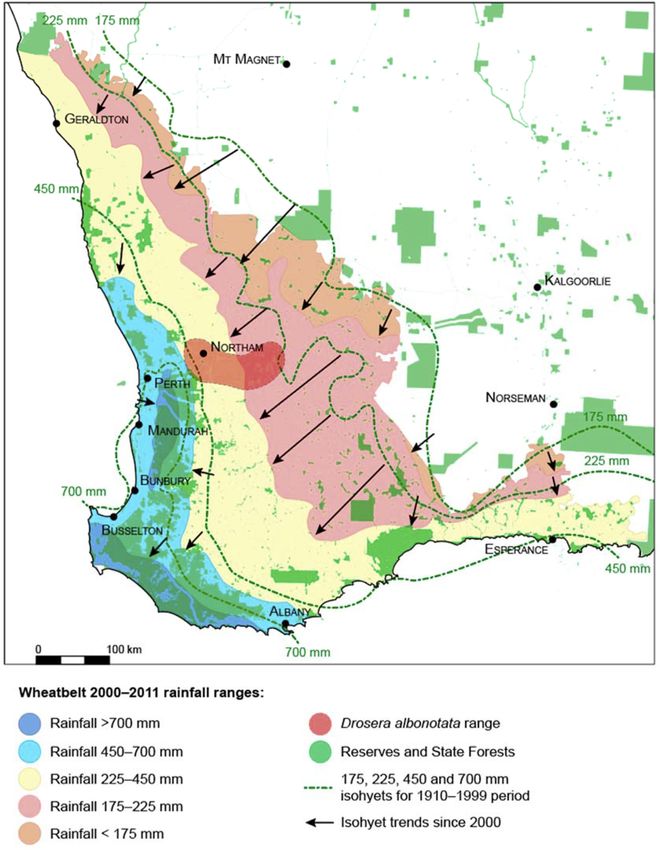
A.T. Cross, T.A. Krueger, P.M. Gonella et al.                                                               Global Ecology and Conservation 24 (2020) e01272

    For speciose genera (defined for the purposes of analyses as genera containing >5 species sensu Jennings and Rohr, 2011,
and as the test is sensitive to small frequencies and can lead to erroneous conclusions when run with five or fewer samples), a
chi-square test of homogeneity was conducted between genera and number of threatened species (with species pooled into
groups of ‘Data Deficient’, ‘Least Concern’, and ‘Threatened’ to ensure all expected cell frequencies were >5). Chi-square tests
of homogeneity were also conducted between genera and number of species impacted upon by each of the 11 first level
threatening process categories (for all species with information available on threatening processes), but could only be run for
the four largest genera (Drosera, Utricularia, Nepenthes and Pinguicula) to ensure all expected cell frequencies were >5. To
determine whether a relationship existed between distribution and conservation status, we ran two-tailed bivariate corre-
lation with Pearson correlation coefficients individually between conservation status (transformed to an ordinal variable from
1 [LC] to 5 [CR] for each species) and AOO, EOO and EOO/AOO. To determine whether any factors significantly predicted
increasing conservation status category (as an indicator of increased level of risk of extinction, increasing from LC to CR),
multiple linear regression models were fitted to examine the effect of Micro-endemism (being known from only a single
location), Number of Threats (the total number of threatening process categories impacting upon the species), and whether
the species was impacted upon by each of the 11 first level threatening process categories, on conservation status (trans-
formed to an ordinal variable from 1 [LC] to 5 [CR] for each species). Stepwise model reduction was completed through
minimising the Akaike's Information Criterion (AIC). Species classified as DD were excluded from regression analyses.
    To visualise the relationship among threatening process categories, among carnivorous plant species, and between
threatening process categories and species, a principal coordinate analysis (PCoA) based on Jaccard's distance was conducted
using the software package CANOCO 5 (Biometris, Wageningen, NL) sensu Jennings and Rohr (2011). Variables included the 11
first level threatening process categories, and the PCoA analysis included a species  threatening process matrix (790 spe-
cies  11 threatening process categories), with only species for which data were available on threatening processes included
in the matrix.

3. Results

3.1. Conservation status

   Full or partial assessments of conservation status category were entered or compiled for all 860 species of carnivorous
plants from 18 genera that had been described by 20 January 2020 (Table 1, Appendix S1). These comprised 495 species
assessed by the IUCN (57.6% of species), 32 species assessed in National Red Lists but not by the IUCN (3.7%), 75 species
assessments derived from the recent published literature (8.7%), and 258 species (30%) assessed by the authors on the basis of
available information on distribution and threats. Over 90% of all assessments were conducted in the last decade. CR species
were recorded from 17 countries, although Brazil, Indonesia and the Philippines together harboured over half of all CR species
(Table 2).
   Approximately a quarter of the 860 currently described species of CPs assessed were found to be at risk of extinction, with
8.0% of species assessed as CR, 5.5% as EN, 12.1% as VU and 2.7% as NT (Table 1). A further 11.2% were assessed as DD, indicating
insufficient information was available on their distribution and threatening processes to confidently allocate them to any
category from LC to CR (Table 1). Approximately 60% of species were assessed as LC (Fig. 1). There was a statistically significant
association between genus and number of threatened species, c2(10) ¼ 129.3, Cramer's V ¼ 0.280, P < 0.001.

Table 1
Numbers of species assessed in each conservation status category under the IUCN Red List criteria for all carnivorous plant genera.

  Genus                              CR          EN                VU                NT                LC                   DD                Genus total
  Aldrovanda                         e           1                 e                 e                 e                    e                 1
  Brocchinia                         e           e                 e                 e                 2                    e                 2
  Byblis                             1           e                 2                 e                 5                    e                 8
  Catopsis                           e           e                 e                 e                 1                    e                 1
  Cephalotus                         e           e                 1                 e                 e                    e                 1
  Darlingtonia                       e           e                 e                 e                 1                    e                 1
  Dionaea                            e           e                 1                 e                 e                    e                 1
  Drosera                            9           12                28                8                 184                  7                 248
  Drosophyllum                       e           e                 e                 1                 e                    e                 1
  Genlisea                           3           2                 3                 3                 15                   4                 30
  Heliamphora                        e           e                 6                 e                 13                   4                 23
  Nepenthes                          30          17                21                3                 77                   21                169
  Philcoxia                          6           1                 e                 e                 e                    e                 7
  Pinguicula                         15          4                 31                3                 33                   19                105
  Roridula                           e           e                 2                 e                 e                    e                 2
  Sarracenia                         1           2                 1                 2                 4                    1                 11
  Triphyophyllum                     e           e                 e                 e                 e                    1                 1
  Utricularia                        4           8                 8                 3                 186                  39                248
  Grand total                        69          47                104               23                521                  96                860

                                                                            4
A.T. Cross, T.A. Krueger, P.M. Gonella et al.                                                            Global Ecology and Conservation 24 (2020) e01272

    Species facing multiple threats and putative micro-endemics (i.e., species known from only one location) were signifi-
cantly more likely to be assessed at greater risk of extinction (i.e., a higher conservation status category). Regression analyses
statistically significantly predicted increasing conservation status category (overall model F(8) ¼ 83.854, P < 0.001), with
increasing conservation status category best predicted by a model including the predictors Micro-endemism (Beta ¼ 0.401,
t ¼ 14.402, P < 0.001), Number of Threats (Beta ¼ 0.517, t ¼ 7.636, P < 0.001), Residential and Commercial Development
(Beta ¼ 0.156, t ¼ 4.239, P < 0.001), Transportation and Service Corridors (Beta ¼ 0.069, t ¼ 2.096, P ¼ 0.036), Biological
Resource Use (Beta ¼ 0.178, t ¼ 5.701, P < 0.001), Human Intrusions and Disturbance (Beta ¼ 0.090, t ¼ 2.190, P ¼ 0.029),
Pollution (Beta ¼ 0.176, t ¼ 4.775, P < 0.001) and Geological Events (Beta ¼ 0.104, t ¼ 3.743, P < 0.001).

3.2. Area and extent of occurrence

   A total of 89 species were known from only a single location based on current knowledge (putative micro-endemics, ca.
10% of all species), with insufficient information available to elucidate the distribution of a further 21 species. Data on AOO
and EOO were available for 629 species (73% of species assessed) and 625 species (75%), respectively, while EOO/AOO could be
calculated for 622 species (Appendix S1). AOO for all species ranged from 4 to 177910 km2, and was strongly positively
correlated with EOO (R2 ¼ 0.758, P < 0.001), which ranged from 4 to 277591043 km2. With DD species excluded from ana-
lyses, AOO (R2 ¼ 0.042, P ¼ 0.301), EOO (R2 ¼ 0.084, P ¼ 0.037) and EOO/AOO (R2 ¼ 0.084, P ¼ 0.041) all negatively
correlated with increasing conservation status category (Table 3).

3.3. Threatening processes

    Data on threatening processes were available for 790 species (92% of species assessed; Table 4), with species being affected
by up to nine of the 11 high-level threatening process categories. Almost a quarter of species for which threats data were
available were impacted upon by three or more threatening process categories (Appendix S1). The most common threatening
processes identified for CP species included Agriculture and Aquaculture (170 species), Natural Systems Modifications (168
species), Climate Change and Severe Weather (158 species), Energy Production and Mining (127 species), Human Intrusions and
Disturbance (126 species), and Biological Resource Use (98 species). The least common threatening process was Geological
Events (listed only for five species of Nepenthes). Many of the significant threatening processes identified impact entire
populations with immediate effect, and represent rapid and often irreversible changes to ecosystems or ecological
functioning.
    Agriculture and Aquaculture (most commonly relating to land clearing for broadacre agriculture or illegal logging activ-
ities), Natural Systems Modifications (most commonly being alterations to natural hydrological and fire regimes) and Climate
Change and Severe Weather were ubiquitous threatening processes affecting species (or more specifically, their habitats) from
almost every CP genus (Table 4). Among the four most speciose genera there was a strong statistically significant association
between genus and number of species impacted upon by Agriculture and Aquaculture (c2(3) ¼ 18.8, P < 0.001; Cramer's
V ¼ 0.164, P < 0.001), Natural Systems Modifications (c2(3) ¼ 62.8, P < 0.001; Cramer's V ¼ 0.300, P < 0.001) and Climate Change
and Severe Weather (c2(3) ¼ 95.3, P < 0.001; Cramer's V ¼ 0.369, P < 0.001), driven primarily in all cases by disproportionately
high representation of these threats among species of Drosera and Pinguicula.
    The impact of Energy Production and Mining was most commonly reported among speciose genera (those containing at
least five species), particularly for Philcoxia (100% of species), Genlisea (63% of species) and Pinguicula (28% of species), while
Human Intrusions and Disturbance most commonly affected Philcoxia (86% of species), Genlisea (47% of species) and Pinguicula

  Table 2
  List of countries harbouring highest numbers of threatened carnivorous plant species (i.e. assessed CR, EN, or VU), ranked by number of CR species.

    Country                                        CR                             EN                             VU                            Total
    Brazil                                         13                             10                             5                             28
    Indonesia                                      12                             9                              5                             26
    Philippines                                    10                             3                              9                             22
    Cuba                                           7                              0                              1                             8
    Thailand                                       5                              0                              0                             5
    Australia                                      4                              4                              22                            30
    Malaysia                                       4                              3                              6                             13
    Italy                                          3                              1                              1                             5
    Mexico                                         2                              1                              20                            23
    Cambodia                                       2                              0                              0                             2
    South Africa                                   1                              2                              9                             12
    USA                                            1                              3                              4                             8
    Venezuela                                      1                              0                              6                             7
    Czech Republic                                 1                              0                              1                             2
    Bolivia                                        1                              0                              0                             1
    DR Congo                                       1                              0                              0                             1
    Dominican Republic                             1                              0                              0                             1

                                                                           5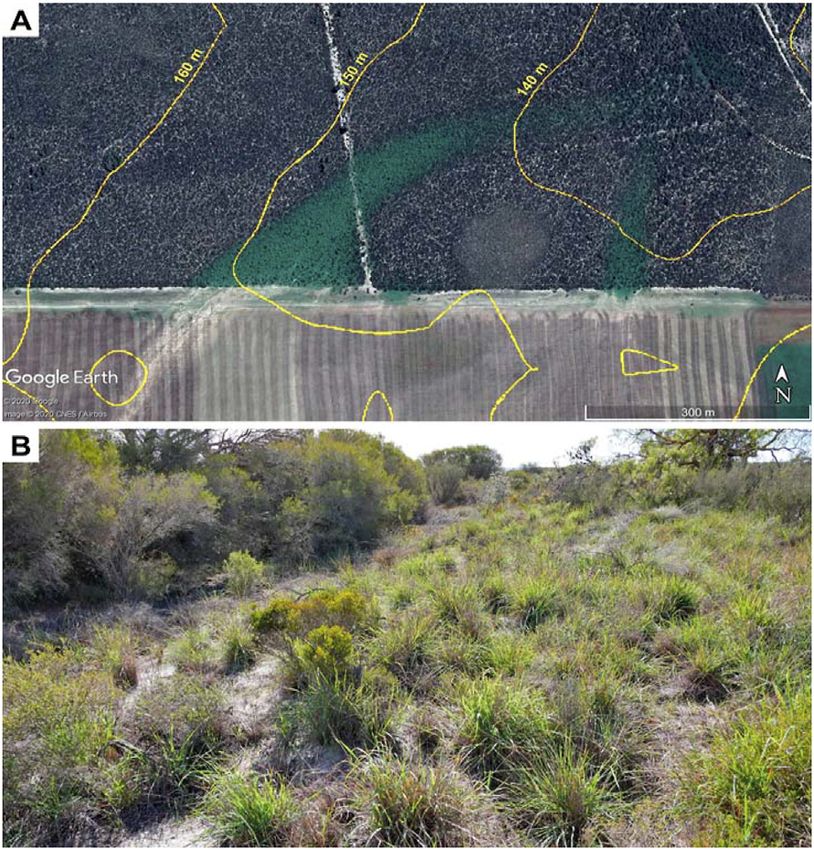
A.T. Cross, T.A. Krueger, P.M. Gonella et al.                                                                   Global Ecology and Conservation 24 (2020) e01272

Fig. 1. Number of species and percentage proportion of all carnivorous plant species in each conservation status assessed under the IUCN Red List criteria, and
number of species and percentage proportion assessed in each conservation status for the most speciose genera (genera containing >5 species), with genera
arranged by phylogenetic affinity. (For interpretation of the references to colour in this figure legend, the reader is referred to the Web version of this article.)

Table 3
Mean ± s.e. for Area of Occurrence (AOO) and Extent of Occurrence (EOO), as well as EOO/AOO, of carnivorous plants assessed under the IUCN Red List
criteria. EOO/AOO is an index of habitat occupancy, calculated by dividing total potential habitat (EOO, acknowledging that EOO often encompasses
unsuitable habitat) by theoretical occupied habitat (AOO, acknowledging that populations of many species are much smaller than the 4 km2 grid squares
employed by the IUCN).

                                        AOO                                   EOO                                                EOO/AOO

                                        Mean(km2)             n               mean(km2)                         n                mean                       n
  Least Concern                         842 ± 423.2           443             4137240 ± 804282.6                459              9893 ± 1147.2              442
  Near Threatened                       220 ± 169.4           13              13915 ± 11098.6                   12               206 ± 144.5                12
  Vulnerable                            63 ± 145.6            70              10182 ± 4881.0                    72               223 ± 118.1                66
  Endangered                            60 ± 17.7             30              16788 ± 13569.8a                  32               966 ± 847.4a               32
  Critically Endangered                 9 ± 1.4               41              16 ± 4.6                          40               1.4 ± 0.3                  40
  Data Deficient                         11 ± 1.5              30              32125 ± 21666.5                   30               2148 ± 1752.6              30
  a
    Excluding the cosmopolitan EN species Aldrovanda vesiculosa, which has an EOO of >114,000,000 km2; when this outlier was included the mean EOO for
group ‘Endangered’ was 3586039 ± 3565275.3 km2 and EOO/AOO was 15566 ± 14623.1.

(36% of species). Among the four most speciose genera there was a strong statistically significant association between genus
and number of species impacted upon by Energy Production and Mining (c2(3) ¼ 47.5, P < 0.001; Cramer's V ¼ 0.260,
P < 0.001), driven primarily by disproportionately higher representation of this threat in species of Pinguicula and Drosera.
    With almost one-third of all CPs threatened by Residential and Commercial Development, Agriculture and Aquaculture, or
Energy Production and Mining (240 species), including 53% of CR, 57% of EN, 50% of VU, and 68% of NT species (Appendix S1),
habitat loss and land use change clearly represents the most significant global threat to CPs. Given the average AOO for CR and
EN species threatened by Residential and Commercial Development, Agriculture and Aquaculture, or Energy Production and
Mining was only 10 and 76 km2, respectively, with at least 17 of these CR species known from only one or two populations, the
impacts of even small-scale disturbances are likely profound.
    Over 10% of all species were threatened by Biological Resource Use, identified in most cases as the poaching of plants for
illegal trade but also rarely for pharmaceutical/medical use (some species of Drosera and Triphyophyllum peltatum). Instances
of Biological Resource Use as a threatening process was highest for species of Sarracenia (100% of species), Nepenthes (27% of

                                                                                6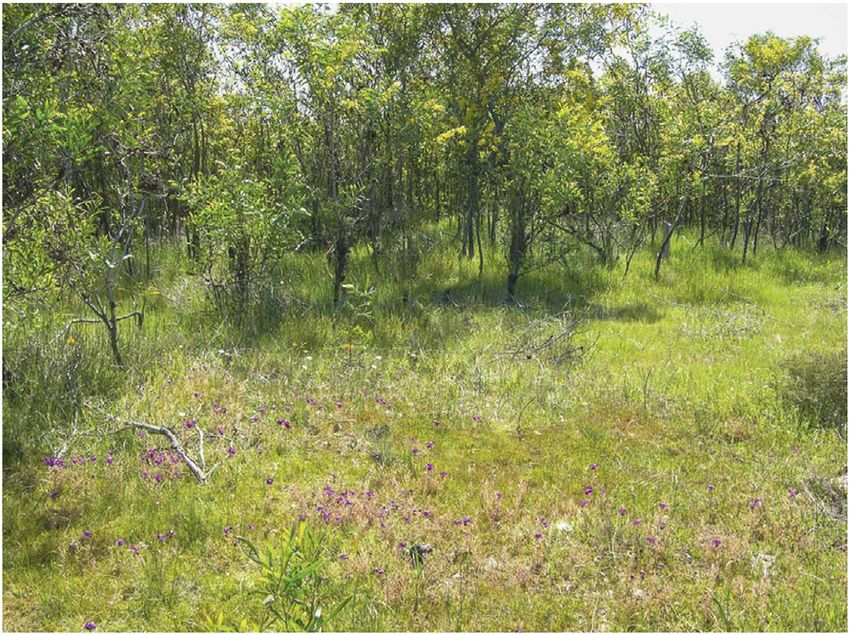
A.T. Cross, T.A. Krueger, P.M. Gonella et al.                                                                  Global Ecology and Conservation 24 (2020) e01272

Table 4
Number of species from each carnivorous plant genus in each of 11 high-level threatening process categories. Many species are impacted by multiple threats,
and are thus represented in multiple threat category columns. 1- Residential and Commercial Development. 2- Agriculture and Aquaculture. 3- Energy Pro-
duction and Mining. 4- Transportation and Service Corridors. 5- Biological Resource Use. 6- Human Intrusions and Disturbance. 7- Natural Systems Modifications.
8- Invasive and Other Problematic Species and Genes. 9- Pollution. 10- Geological Events. 11- Climate Change and Severe Weather.

  Genus (number of species)               1     2           3            4          5         6            7             8         9          10         11
  Aldrovanda (1)                          1     1           e            e          e         e            1             e         1          e          1
  Brocchinia (2)                          e     2           2                                 2                                                          2
  Byblis (8)                              1     2           1                                              8                                             1
  Catopsis (1)
  Cephalotus (1)                          1     1                                   1                      1                                             1
  Darlingtonia (1)                                                                                         1                       1
  Dionaea (1)                             1     1                        1          1         1            1                       1                     1
  Drosera (248)                           30    59          49           15         10        44           78            45        23                    65
  Drosophyllum (1)                        1     1                                                          1             1
  Genlisea (30)                           7     19          19           17                   14           5             3         23                    27
  Heliamphora (23)                                                                  1         2            2             1         1
  Nepenthes (169)                         3     24          10           6          45        4            8                       1          5          1
  Philcoxia (7)                                 5           7            7                    6                                                          7
  Pinguicula (105)                        7     22          29           13         24        38           32            8         11                    39
  Roridula (2)                                  1           1                       2         2            2                       1                     1
  Sarracenia (11)                         11    11                                  11                     11            11        11                    3
  Triphyophyllum (1)                            1           1            1          1         1
  Utricularia (248)                       12    20          8            2          2         12           18            7         7          5          12
  Total (860)                             75    170         127          62         98        126          169           76        81         10         161

species) and Pinguicula (22% of species), and was considered a major threat to species from monospecific genera including
Cephalotus follicularis, Dionaea muscipula and Triphyophyllum peltatum. Among the four most speciose genera there was a
strong statistically significant association between genus and number of species impacted upon by Biological Resource Use
(c2(3) ¼ 124.5, P < 0.001; Cramer's V ¼ 0.422, P < 0.001), predominantly due to the number of Nepenthes species affected by
this threat (45) being three times higher than statistically expected (14.5).
   Among the four most speciose genera, statistically significant associations were also evident between genus and Resi-
dential and Commercial Development (c2(3) ¼ 13.8, P ¼ 0.003; Cramer's V ¼ 0.140, P ¼ 0.003), Human Intrusions and Distur-
bance (c2(3) ¼ 71.5, P < 0.001; Cramer's V ¼ 0.320, P < 0.001), Invasive and Other Problematic Species and Genes (c2(3) ¼ 49.1,
P < 0.001; Cramer's V ¼ 0.265, P < 0.001), and Pollution (c2(3) ¼ 17.6, P ¼ 0.001; Cramer's V ¼ 0.159, P ¼ 0.001).
   PCoA revealed three main species groupings based upon threatening process categories (Fig. 2): one discrete cluster of
species impacted only by Biological Resource Use (mostly species of Nepenthes), one discrete cluster of species impacted only
by Natural Systems Modifications (mostly Australian species of Drosera and Byblis), and one large, poorly-defined cluster
comprising species impacted by multiple threatening process categories. Analyses suggest that many ecosystems harbouring
CPs face multiple concurrent (and likely interrelated) threats from Residential and Commercial Development, Agriculture and
Aquaculture, Energy Production and Mining, Transportation and Service Corridors, Human Intrusions and Disturbance, Invasive
and Other Problematic Species and Genes, Pollution and Climate Change and Severe Weather. The two discrete clusters suggest
that Biological Resource Use, Natural Systems Modifications and Geological Events likely represent threatening processes to
species occurring in predominantly ecologically intact ecosystems further from human development.

4. Discussion

    The majority of CPs occupy highly-specific and often highly-specific ecological niches (Brewer and Schlauer, 2018), within
sensitive habitats in areas experiencing conflict with anthropogenic land use and development. Most CP species are reliant
upon the maintenance of natural ecosystem processes such as hydrology and fire for recruitment and population mainte-
nance, and decline rapidly following disturbance to these processes. Many occupy restrictive niches, such as montane hab-
itats, or persist in small, fragmented habitat remnants, and have no refugia in the face of global climatic change. Even where
refugia are available, it is uncertain to what extent environmental change may impact the complex biological mutualisms and
dietary specialisations upon which many CPs rely (e.g., Clarke et al., 2009; Greenwood et al., 2011; Rembold et al., 2012). Many
perennial taxa can take several years to reach reproductive maturity, for example Cephalotus (Cross et al., 2019), Darlingtonia
(Meindl and Mesler, 2011), Dionaea (Smith, 1931), Heliamphora (D'Amato, 2013), Nepenthes (A. Fleischmann, pers. obs.),
Roridula (A. Fleischmann, pers. obs.), Sarracenia (Slack, 1980), Triphyophyllum (Cross et al., 2018a) and very likely all species of
Philcoxia (A. Scatigna pers. comm.). As these genera harbour a high proportion of the CP species at risk of extinction, we
contend that the high degree of ecological specialisation exhibited by many CP species likely places them at significant and
imminent risk from anthropogenic change. We identify five significant outcomes from examination of the conservation
assessments of CPs:

                                                                              7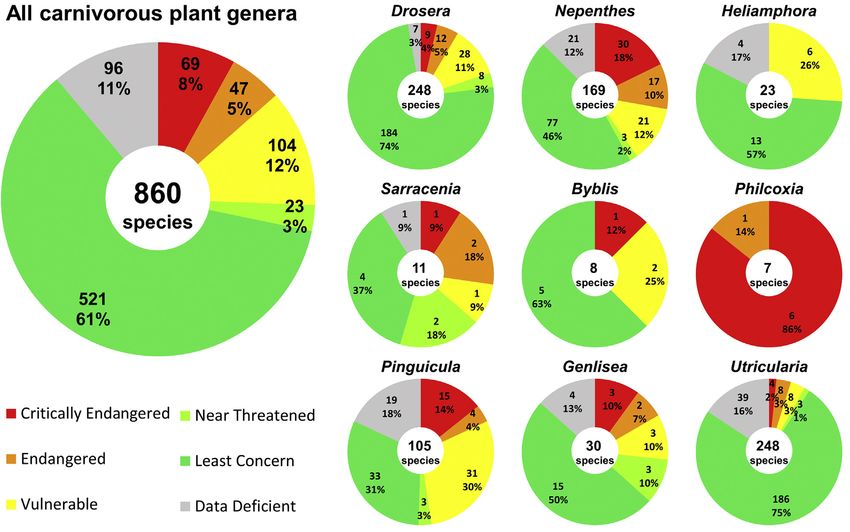
A.T. Cross, T.A. Krueger, P.M. Gonella et al.                                                                    Global Ecology and Conservation 24 (2020) e01272

Fig. 2. Principal coordinate analysis (based on Jaccard's distance) showing the ordination (projection of axes 1 and 2) of the threatening processes impacting
carnivorous plant species (for 790 species where threatening process data are available). Threatening process categories are projected into the ordination space
(perpendicular projection of these categories to the axes provides an estimate of the correlation coefficient of that variable with that axis), and the distance of
species and threat categories from the origin indicate relative importance in the biplot. 1- Residential and Commercial Development. 2- Agriculture and Aquaculture.
3- Energy Production and Mining. 4- Transportation and Service Corridors. 5- Biological Resource Use. 6- Human Intrusions and Disturbance. 7- Natural Systems
Modifications. 8- Invasive and Other Problematic Species and Genes. 9- Pollution. 10- Geological Events. 11- Climate Change and Severe Weather.

     i) Species occurring in habitats in close proximity to, or which are regularly accessed by, people (i.e., Aldrovanda vesiculosa,
        Cephalotus follicularis, Dionaea muscipula, most lowland Nepenthes, Philcoxia, Sarracenia, and many species of Drosera,
        Genlisea and Pinguicula) are threatened by direct human activities such as the clearing of habitat for agricultural and
        residential development, as well as secondary impacts such as pollution and invasive species;
    ii) Many species occurring even in habitats distant from human development are threatened by alteration to natural
        ecosystem processes such as fire regimes and hydrological functioning;
   iii) Species occurring in remote regions or in habitats generally unsuitable for development (i.e., highland Nepenthes,
        Heliamphora) are often threatened by activities such as illegal logging and mining;
   iv) The most unique, spectacular, and horticulturally interesting species (i.e., Cephalotus follicularis, Dionaea muscipula,
        most Sarracenia and many species of Nepenthes) continue to be threatened by illegal collection for horticultural trade;
    v) Many species of CPs may be at risk of extinction in the face of global climatic change, particularly species adapted to,
        and thus reliant upon, highly specific habitats or inhabiting restricted ecological niches (i.e., species occurring in
        seasonally-wet and ephemeral aquatic habitats, and montane and high-elevation species of Drosera, Nepenthes and
        Pinguicula).

5. Habitat loss and land use change

5.1. Residential and Commercial Development

    Residential and Commercial Development represents a rapid and permanent loss of habitat, often also leading to secondary
threats such as weed invasion and alteration to natural ecological processes in surrounding ecosystems. While clearing for
development threatens CPs in many regions (Fig. 3), its scale varies considerably. Urban development in cities in Sierra Leone,
West Africa, has cleared significant Triphyophyllum peltatum habitat (A. Fleischmann pers. obs.; Fig. 3A) Development
servicing tourism activities (e.g., mountain resorts in areas such as the Genting Highlands, Peninsular Malaysia) has been
identified as a threat to N. ultra in the Philippines (Cheek and Jebb, 2013), and likely also affects numerous other Nepenthes
from Southeast Asia (Clarke et al., 2018; Fig. 3B).
    Rapid expansion of the Perth metropolitan area has resulted in substantial habitat loss (Ramalho et al., 2014; MacLachlan
et al., 2017), despite the location of the city in one of the world's most biodiverse and endemism-rich floristic regions (Clarke
et al., 2018). Significant development has occurred around the Swan and Canning Rivers, which once harboured large areas of
low-lying, seasonally-wet heathland supporting diverse vegetation including many CPs (Lowrie, 2014; Cross, 2019). Lowrie
(1981) noted that up to 18 species of Drosera and Utricularia co-occurred with Byblis gigantea in the swampland fringing
the Canning River, and this area once harboured most of the habitat suitable for the CR B. gigantea (Cross et al., 2013). By 1981,

                                                                                 8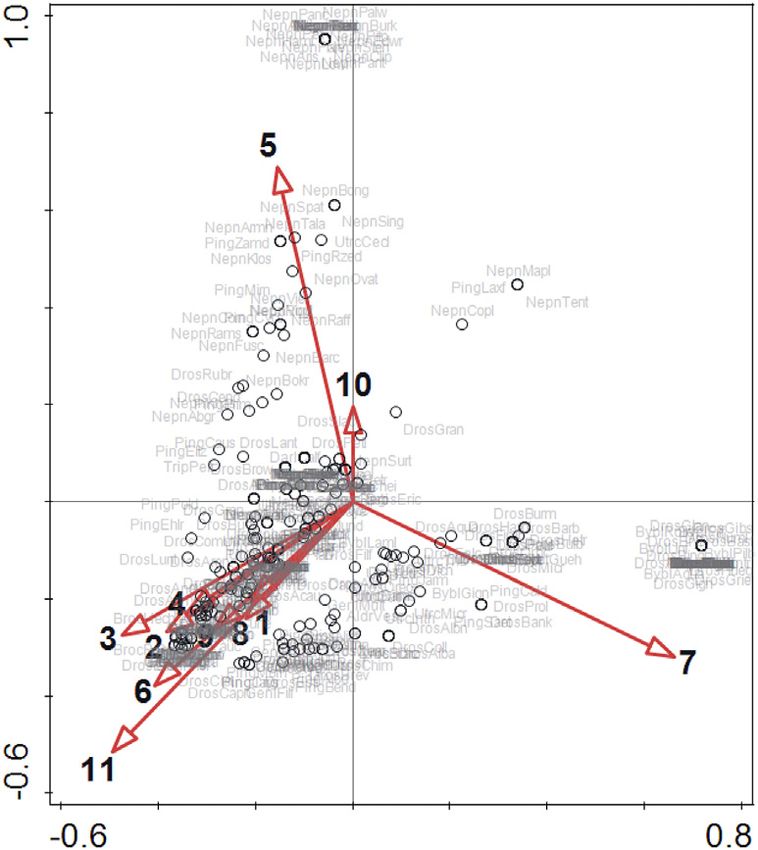
A.T. Cross, T.A. Krueger, P.M. Gonella et al.                                                                    Global Ecology and Conservation 24 (2020) e01272

Fig. 3. Examples of small-scale destruction of carnivorous plant habitats resulting from urban development in the last two decades. A Africa: Triphyophyllum
peltatum (DD, site of secondary rainforest in Sierra Leone personally observed by A. Fleischmann in 2006 indicated by a yellow “ “); B Asia: Nepenthes bokorensis
(CR, previously occurred across the entire illustrated area, which is the type location in Cambodia, pers. obs. by A. Robinson in 2011); C Australia: Byblis gigantea
(CR, extinct sites in Perth indicated by yellow “ “, last observed in 2003; Lowrie, 2014; Cross, 2019); D South America: Drosera schwackei (EN, threatened sites in
Minas Gerais, Brazil indicated by yellow “ “, pers. obs. by P.M. Gonella and A. Fleischmann in 2018). The yellow circle in this image indicates the location of a
Eucalyptus plantation. Satellite images © Google Earth 2020. (For interpretation of the references to colour in this figure legend, the reader is referred to the Web
version of this article.)

much of this swampland had been developed for housing and a shopping complex (Lowrie, 1981), but development continues
in the region and has resulted in the extinction of B. gigantea from the Swan Coastal Plain (Fig. 3C; Cross, 2019). Byblis gigantea
now persists in only four populations in the Darling Range east of Perth, which continue to decline in the face of altered
hydrological and fire regimes (Lowrie, 2014; Cross et al., 2018b; Cross, 2020e). Urban expansion and associated habitat
degradation on the Swan Coastal Plain has also caused declines in the extent of Drosera gigantea and Utricularia menziesii
(Cross, 2019), as well as for many other specialised flora including orchids (Newman et al., 2015). Continued urban expansion
of the town of Albany on the south coast of Western Australia is encroaching on sensitive peat swamp habitats, threatening
the VU Cephalotus follicularis (Cross et al., 2018b, 2019).
    Rather paradoxically, the development of a settlement known as “Sundew Villas” is encroaching on and replacing
botanically diverse fynbos habitat harbouring numerous Drosera species near the town of Hermanus, coastal Western Cape of
South Africa (S. McPherson pers. comm.; A. Fleischmann pers. obs. 2006). Similarly, development around the town of Darling
has resulted in local extinctions of Drosera cistiflora and the VU D. pauciflora as well as several endemic geophytes (E. Green
pers. comm.; A. Fleischmann pers. obs.) in an area of Western Cape renosterveld vegetation celebrated for a particularly high

                                                                                 9
A.T. Cross, T.A. Krueger, P.M. Gonella et al.                                                                    Global Ecology and Conservation 24 (2020) e01272

rate of endemism. The expansion of the city of Diamantina in southeastern Brazil, situated in the diverse and high-endemism
campos rupestres, has impacted at least 15 CP species including the EN local-endemic Drosera schwackei (Fig. 3D) and VU
Drosera spiralis (P.M. Gonella and A. Fleischmann, pers. obs.). Remnant CP habitat in the region continues to be degraded by
alteration to natural fire and hydrological regimes, which have facilitated weed invasion (Barbosa et al., 2010), particularly the
recurrent use of fire for vegetation clearance and the maintenance of pasture for cattle grazing around urban settlements.
    Habitat destruction for development is recognised as the most significant threat faced by Dionaea and all species of
Sarracenia in the USA (Schnell, 2002; Luken, 2012; Clarke et al., 2018). Large areas of undisturbed CP habitats remain on
privately-owned land in the region, and although most CP species being protected under federal or national laws in the United
States, these protections offer minimal protection on private land where it is both legal and often profitable to destroy habitat
harbouring protected species such as Sarracenia (Meyers-Rice, 2001). Large populations of Sarracenia continue to be cleared
by landowners for commercial and domestic development, for example in pine forest habitats in northern Florida (Schnell,
2002; Rice, 2006; Clarke et al., 2018).

5.2. Agriculture and aquaculture

    Logging, particularly illegal logging, represents a significant ongoing threat to CPs in tropical regions (Fig. 4A). Logging of
primary and secondary rainforest represents a significant threat to the remaining populations of Triphyophyllum peltatum (as
well as the closely-related but non-carnivorous Habropetalum) in tropical West Africa (Munro, 2009; Cross et al., 2018b).
Illegal logging has been identified as a threat to Nepenthes species from Cambodia (Mey et al., 2010), Indonesian Borneo
(Giesen, 2000; Meijaard et al., 2005), and throughout the Philippines (Amoroso et al. 2009, 2017,; Gronemeyer et al., 2014;
Cheek et al., 2015; Lagunday et al., 2017, Lagunday and Amoroso, 2019). The discovery of undescribed Nepenthes species and
new populations of known species along the margins of logging roads and in areas made accessible by logging activitiesdfor

Fig. 4. Examples of the degradation and destruction of carnivorous plant habitats from agricultural and development practices (AeE) and mining activities (FeI).
A. Clearance of coastal forest for deluxe housing near Jayapura, Papua Province, Indonesian New Guinea, has destroyed a well-known, local stronghold of Ne-
penthes neoguineensis (Photo: A. Robinson, 2016). B. Alpine seepage habitat of Pinguicula leptoceras paved for a winter sports area in the state of Tyrol, Austria
(Photo: A. Fleischmann, 2008). C. Eucalyptus plantations in areas of campos rupestres in the Serra do Cabral, a biodiversity hotspot for CPs in Minas Gerais, Brazil
(Photo: F. Nepomuceno da Costa, 2012). D. Subsistence padi monoculture abuts a karst formation of special scientific interest in northern Palawan (Philippines),
home to three endemic CPs and numerous other endemic plants protected only by the extreme topography (Photo: A. Robinson, 2011). E. Young oil palm
plantation at a habitat of Nepenthes sumatrana near the North Sumatra (Indonesia) coast where seven individuals of this CR species persist (Photo: A. Robinson,
2017). F. A nickel extraction pit in northern Mindanao (Philippines), the scrub to the rear is the only known habitat of a CR endemic Nepenthes (Photo: A.
Robinson, 2018). G. Quartzite mining of seepage areas in the municipality of Diamantina (Brazil) threatens several micro-endemic species of the campos rupestres
including the EN Drosera schwackei (Photo: K. Henrique da Silva, 2018). H. A sand quarry on the Bass Coast (Victoria, Australia) threatening the
southernmostremnant of native vegetation in the >95% cleared West Gippsland region harbouring numerous Drosera and several threatened orchid species
(Photo: A. Robinson, 2019).

                                                                                10
A.T. Cross, T.A. Krueger, P.M. Gonella et al. Global Ecology and Conservation 24 (2020) e01272
example, N. dactylifera, N. ephippiata, N. fractiflexa, N. glandulifera, N. pitopangii, N. platychila and N. vogelii, among others (Lee
2004; Lee et al., 2009; Robinson et al., 2019a; Golos et al., 2020; A.T. Cross and A. Robinson pers. obs.)dhas led to an
indisputable observation bias of Nepenthes in anthropogenic ruderal habitats, and occasional but not necessarily correct
assertions that these plants might actually benefit from such disturbance (discussed in Golos et al., 2020). However, these
species are naturally often overwhelmingly epiphytic, and while many Nepenthes certainly proliferate in disturbed sites
(typically in the company of resam fern Dicranopteris linearis, Gleicheniaceae), repeated visits to ruderal habitats that do not
undergo periodic maintenance (slashing, mowing etc.) show that Nepenthes are often ephemeral and the succession of
secondary growth eventually renders conditions unfavourable for their survival (A. Robinson pers. obs.). Since it is extremely
difficult to survey epiphytic species assemblages in undisturbed forest across a wide area, it is not readily possible to compare
the relative numbers of Nepenthes growing unseen in pristine forest canopy with those occasionally proliferating along
roadsides in logged areas. However, continued logging can only further erode biodiversity and remove trees large and
sheltered enough to harbour sequential generations of larger, relatively desiccation-intolerant epiphytes such as Nepenthes.
Small-scale clearing in mountainous areas in Europe also threatens CPs such as montane Pinguicula (Fig. 4B).
Plantations of rapid-growing Eucalyptus and Pinus established for timber and pulp production represent a major threat to
CPs in the campos rupestres grasslands of Brazil (Rapini et al., 2008). In addition to habitat clearing for afforestation, Eucalyptus
have relatively high evapotranspiration rates and can markedly alter local soil hydrology in ecosystems around the world (e.g.,
Zhou et al., 2002; Engel et al., 2005; Benyon et al., 2006; Shi et al., 2011; Ribas et al., 2016). Leaf litter from both Eucalyptus and
Pinus is toxic to native flora and soil biota through allelopathic effects (Rizvi et al., 1999; da Silva Rodrigues-Corre ^a et al., 2017),
and their growth form can result in heavy shading which affects the open grassland habitat inhabited by the NT Drosera viridis
(Gonella and Lehn, 2020). Additionally, cultivated Pinus species (usually Pinus elliotii and P. taeda; Zenni and Ziller, 2011) can
become invasive in local ecosystems, and the linear infrastructure for large forest monocultures further fragments habitat,
reducing genetic connectivity between populations of native species (Ribas et al., 2016). Several CR and EN CP species are
threatened by Eucalyptus afforestation in Brazil (Fig. 4C), including Genlisea metallica and G. oligophylla (Fleischmann et al.,
2011), Philcoxia rhizomatosa (Scatigna et al., 2015), and Drosera magnifica (Gonella et al., 2015).
At larger scales, the cultivation of rice (typically Oryza sativa) and, more recently, oil palm (Elaeis guineensis), has destroyed
large areas of tropical and subtropical lowland habitat in Southeast Asia (Fig. 4D and E). Rice cultivation has primarily affected
CPs in Indochina, the rice bowl of Asia and one of the most ancient agrarian landscapes on Earth; Drosera, Utricularia and
Nepenthes in Cambodia, Vietnam and Thailand now persist predominantly in marginal habitats, ruderal habitats, rocky or
sandy mineral soils in seasonally wet veals (savannahs) ill-suited to farming, and occasionally in reserves (A. Robinson pers.
obs.). The farming of hill rice in the dramatic mountainside terraces of great cultural importance in the cordillera of Benguet
and Ifugao (Luzon, Philippines) has destroyed significant areas of montane forest (A. Robinson pers. obs.). The clearing of
natural forest for monocultures of structurally homogeneous oil palm are associated with major declines in biodiversity and
species richness throughout southeast Asia (Fitzherbert et al., 2008; Fig. 4E), and although the rate of conversion of natural
forest to plantation has slowed in recent years, this monoculture remains the dominant agricultural land cover type in
Sumatra and Borneo (Gaveau et al., 2016; Austin et al., 2017). Both islands are recognised centres of Nepenthes biodiversity
(see e.g., Clarke, 1997), and a variety of lowland Nepenthes are associated with peat forests and associated kerangas (heath
forest). The proportion of peat forest cover in Sumatra fell from 75% to 28% between 1990 and 2010, almost entirely to make
way for oil palm plantations (Miettinen et al., 2018). Over 60% of populations of the VU Bornean N. bicalcarata populations
have been lost to the conversion of peat-swamp forests to palm oil monocultures in the last three decades (Clarke et al., 2018),
and the majority of suitable habitat for the CR Sumatran endemic N. sumatrana has been cleared for oil palm and human
settlement (A. Robinson, pers. obs; Fig. 4E). While widespread species such as N. ampullaria, N. gracilis and N. rafflesiana are
still considered LC, the abundance of these species has plummeted due to habitat clearance. In Sierra Leone, clearing for oil
palm plantation has destroyed most known localities of the rare and poorly-protected Triphyophyllum peltatum (A. Fleisch-
mann pers. obs.; Fig. 3A), and deforestation has resulted in this species facing a high risk of extinction throughout large parts
of its natural distribution (Cross et al., 2018b).
In few regions are the broad-scale effects of land use change so well-documented as in Australia. Australia is especially
notable for its carnivorous flora, being home to nearly a third of all CPs (245 species from six genera), of which more than half
(124 species) are endemic to the Southwest Australian Floristic Region (SWAFR; Robinson et al., 2017; Clarke et al., 2018). The
majority of these species evolved within the kwongan shrublands, an extensive, geologically and climatically stable zone of
severely phosphorous-impoverished soils. Kwongan comprises that region's most species-rich vegetation, harbouring
approximately 70% of the ca. 8000 native plant species recorded from the SWAFR, and thus a significant proportion of the ca.
13,000 total native species recorded from all of Western Australia (Hopper and Gioia, 2004; Robinson, 2019). Western
Australia's Wheatbelt, which sits within the SWAFR, has among the highest rates of habitat clearance on the planet; for
example, around 97% of all native vegetation has been cleared in the Avon wheatbelt region (Saunders, 1989; Bradshaw,
2012). This clearing continues, and habitat loss, fragmentation and degradation represent real and ongoing threats to
native flora in the region.
Fewer than 5e20% of remaining native vegetation is retained in protected areas for almost all SWAFR bioregions (Clarke
et al., 2018). As many narrowly endemic CP species from the SWAFR have only been discovered and described in the past
20e30 years (Lowrie, 2014), the high extent of habitat loss suggests that some species may have been driven to extinction
before they could have been discovered (Clarke et al., 2018). Among the CPs endemic to the SWAFR are four assessed as CR
(Byblis gigantea, Drosera allantostigma, D. leioblastus, D. oreopodion), one NT (Utricularia westonii) and 15 VU species. The three
11A.T. Cross, T.A. Krueger, P.M. Gonella et al. Global Ecology and Conservation 24 (2020) e01272
Drosera species are arguably the most threatened of these, with D. oreopodion known from just one extant population
comprising several hundred individuals occupying ca. 25 m2 (Clarke et al., 2018; A. Cross, T. Krueger, A. Robinson pers obs.
2017e2020), D. leioblastus known from a single declining population of seven individuals in 2020 down from 20 individuals in
2019 (T. Krueger pers. obs), and D. allantostigma potentially EW as surveys in both 2019 and 2020 failed to locate any in-
dividuals at the single known locality following severe drought and habitat degradation (Cross, 2020a; T. Krueger pers. obs).
Similar declines in suitable habitat can be observed on both the local scale of apparent micro-endemics (e.g., D. leioblastus),
but also at regional scales as exemplified by D. albonotata; a species described and assessed as VU in 2018 based on its six
small, extant populations (two previous collection sites now comprise farm and residential land, respectively) sparsely
scattered across a relatively broad ca. 87 km corridor of extremely fragmented patches of remnant habitat within which it is
likely to have once been widespread, if not reasonably common (Robinson et al., 2018). The significant issue of habitat
clearance and fragmentation is further compounded by the marked advancement of diminishing rainfall levels from the arid
Australian interior outwards through the Wheatbelt towards the coast (see Global climatic changes; also e.g., Gibson et al.,
2008).
5.3. Energy Production and Mining
The impacts of Energy Production and Mining predominantly affect species of Nepenthes and Pinguicula, as species from
these genera most commonly inhabit higher-elevation habitats on mineral-rich terranes that are the focus of mining ac-
tivities, but are also felt in other significant mining provinces such as Brazil (Fig. 4G) and Australia (Fig. 4H). A number of EN
Nepenthes species (e.g., N. attenboroughii, N. erucoides, N. northiana, N. sumatrana, N. truncata) are threatened by metal
extraction from mafic areas, such as in northeastern Mindanao and Palawan (Philippines), eastern Sulawesi and the highlands
of West Papua (Indonesia), or by quarrying for the concrete industry from limestone areas in western Sarawak and central
Peninsular Malaysia (A. Robinson pers. obs.). Open-cast mining is listed as a specific threat to several Nepenthes in the
Philippines including N. ramos and N. ultra (Cheek and Jebb, 2011, 2013), while nickel mining is a threat to N. erucoides and N.
truncata in the Philippines (Robinson et al. 2019b), N. halmahera and N. weda in Indonesia (Cheek, 2015), and limestone
quarrying and coal mining are regarded as serious threats to N. khasiana in India (Prasad and Jeeva, 2009; Singh et al., 2011).
Environmental impact assessments are poor or non-existent in many of these regions, and rarely consider biodiversity
(Bravante and Holden, 2009); indeed, Bravante and Holden (2009) note that, in a 2005 interview, Attorney Grizelda Mayo-
Anda, the Executive Director of the Environmental Legal Assistance Centre (ELAC) in Palawan, “related how there was an
endangered carnivorous pitcher plant in an area that was scheduled to be a mining project; when she pointed this out to the
engineers in charge they merely laughed at the suggestion that the project should not proceed because of a plant.” Such
attitudes appear to be deeply ingrained in countries such as Indonesia and the Philippines, where ineffective law enforcement
has resulted in the inadequate protection of threatened species even when they occur completely within the boundaries of
protected areas (Gaveau et al., 2009; Clarke et al., 2018).
A number of Pinguicula species are impacted by mining activities in Central and South America, commonly from the
quarrying of gypsum and other limestone terranes. For example, in Mexico P. gracilis occurs in a region aggressively quarried
for limestone in order to provide for the needs of the burgeoning industrial centre of Monterrey (Nuevo Leo n) and to supply
the nearby United States (Lampard et al., 2016), while mining has destroyed and fragmented the habitat of P. albida, P. cubensis
and P. filifolia in western Cuba (Domínguez et al., 2014). The construction of hydroelectric dams pose serious threats to
habitats of some microendemic Pinguicula species in Mexico by flooding their habitats or altering their hydrology (e.g., P.
elizabethiae, P. moctezumaedironically, the latter species was initially discovered during species inventories before the
building of the large Zimapa n Hydroelectric Dam; Lampard et al., 2016; Fleischmann and Roccia, 2018). All species of Philcoxia
are severely or potentially impacted by mining, being restricted to one to only a few populations on deep sand banks from
which sand is extracted for construction purposes (Taylor et al., 2000; Scatigna et al., 2015, 2016a, 2016b, 2017; Fig. 4I).
Habitats of Philcoxia have also been historically used for diamond prospecting (Taylor et al., 2000), and the CR Philcoxia
courensis occurs in an area with potential for construction of hydroelectric plants (Scatigna et al., 2017).
Although poorly documented, both legal and illegal mining activities also impact CP habitats in regions such as South
America, tropical Africa and Madagascar, and may increasingly represent threats to species of Drosera, Genlisea, Heliamphora,
and Utricularia into the future. For example, illegal mining on Venezuelan tepuis (e.g., Sharpe and Rodríguez, 1997) may
threaten species of Heliamphora and Brocchinia (McPherson, 2008). Mining, and often illegal mining activities, threatens
many protected areas throughout Africa (e.g., Laurance et al., 2006; Tranquilli et al., 2014; Boadi et al., 2016), and is a sig-
nificant driver of habitat loss in Madagascar (e.g., Cardiff and Andriamanalina, 2007; Watson et al., 2010). These activities are
often undertaken in regions known to harbour remnant CP habitat, and authors have previously noted inadequacies in the
implementation and enforcement of environmental protection legislation in these jurisdictions (e.g., Sarrasin, 2006;
Andrews, 2015).
5.4. Transportation
In some regions, such as areas of the SWAFR where residential development and agricultural clearing has resulted in the
loss of more than 97% of natural vegetation (Clarke et al., 2018), road and railway reserves comprising narrow, linear bands of
remnant vegetation (corridors) are of significant conservation value (Saunders and Hobbs, 1991), and represent the only
12You can also read